USDJPY.1000.DUB trade ideas

USDJPYHello Traders! 👋
What are your thoughts on USDJPY?
USDJPY is moving within a descending channel and has currently reached the top of the channel, just below a resistance zone.
We anticipate some consolidation in this area, followed by a potential drop toward the bottom of the channel.
For a safer sell entry, it’s better to wait for a break below the specified support level.
After the breakout, a pullback to the broken support could offer a good sell opportunity.
💡Will USD/JPY respect the channel and head lower, or break out to the upside? Share your view below! 👇
Don’t forget to like and share your thoughts in the comments! ❤️

USDJPY Faces Strong Resistance at 151.20 USDJPY Faces Strong Resistance at 151.20
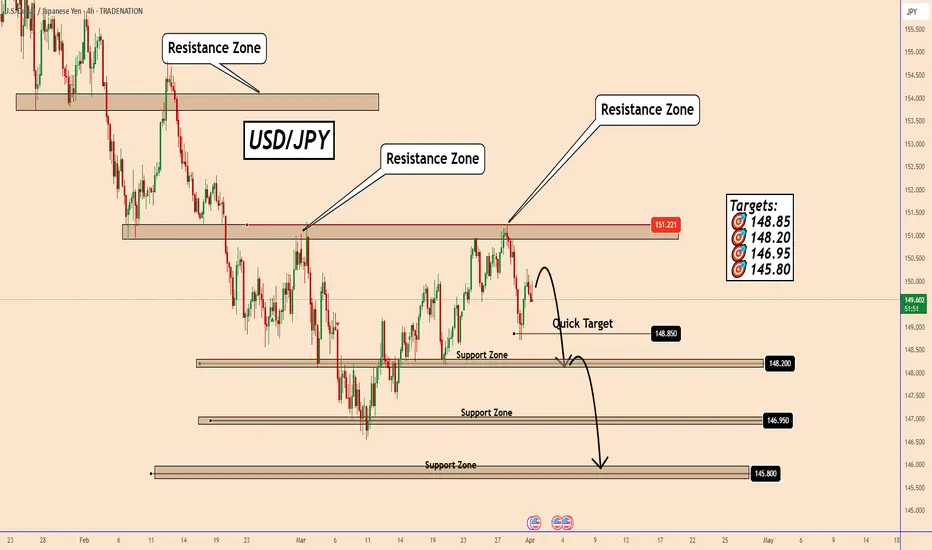
USDJPY tested a strong resistance zone near 151.20. The initial reaction was solid, reinforcing the importance of this level.
Sellers appear to be defending 151.20, as the price has moved down twice after testing the area, successfully halting bullish momentum both times.
If this resistance holds, USDJPY could continue its downward move toward these targets: 🎯 148.85 🎯 148.20 🎯 146.95 🎯 145.80
You may find more details in the chart!
Thank you and Good Luck!
❤️PS: Please support with a like or comment if you find this analysis useful for your trading day❤️
Disclosure: I am part of Trade Nation's Influencer program and receive a monthly fee for using their TradingView charts in my analysis.
Dollar-yen tanks, retesting seven-month lowsHavens generally had a significant boost from Donald Trump’s latest announcement of sweeping new tariffs, with the yen in particular showing strong overall gains in most of its pairs. Flight to safety has been the primary driver for the yen in the last couple of days. The yen’s expected higher yield later this year could now be questioned because the impact of tariffs on Japanese inflation might not be very large while exports will almost certainly be lower than previously expected. When the Bank of Japan will hike next remains a significant intrigue; September seems less certain in light of the latest developments.
¥146.50 is still the key support, last month’s low and the area of lows in March last year also. If the price breaks below there successfully, there might be significant continuation before the next possible support. However, volume has been relatively low for dollar-yen in the last couple of days compared to early March, so an immediate move lower is somewhat questionable.
A bounce above ¥149 is probably less likely still given both the technical and fundamental situation. The price couldn’t move clearly above ¥151 last month amid low volume, with the 200 SMA functioning as a dynamic resistance. As for euro-dollar, dollar-yen’s next major movement is likely to depend on the reaction to 4 April NFP. If the result isn’t particularly surprising and the trade situation remains confused, consolidation seems to be possible in the next few days.
This is my personal opinion, not the opinion of Exness. This is not a recommendation to trade.

USD/JPY Price Action Update – April 3, 2025 📊 USD/JPY Price Action Update – April 3, 2025 🎯
🔹 Current Price: 147.276
🔹 Timeframe: 15M
📌 Key Support Levels (Demand Zones):
🟢 147.200-147.284 – First Support Zone (Liquidity Area)
📌 Key Resistance Levels (Fair Value Gaps - FVGs & Supply Zones):
🔴 147.647 – First Resistance (FVG)
🔴 149.133 – Major Resistance (Potential Target)
📈 Bullish Scenario:
If price respects the 147.200-147.284 demand zone, we could see a push towards 147.647 first.
A breakout above 147.647 could indicate further bullish momentum toward 149.133.
📉 Bearish Scenario:
If price fails to hold 147.200, we might see a deeper retracement.
The next possible downside target would be below 147.000, breaking structure further.
⚡ Trading Tip:
✅ Look for confirmations like bullish candlestick rejections before entering buys.
✅ Monitor reactions at FVG zones for potential reversal trades.
✅ Use proper risk management when trading breakout zones.
#USDJPY #ForexTrading #PriceAction #TechnicalAnalysis #SmartMoney #ForexSignals #JPY #ForexMarket

USD/JPY(20250403)Today's AnalysisMarket news:
US trade policy-① Trump signed an executive order to establish a 10% "minimum base tariff" for all countries, and will impose reciprocal tariffs, including 20% for the EU, 24% for Japan, 46% for Vietnam, and 25% for South Korea. The tariff exemption for goods that meet the USMCA will continue, and the tariff for those that do not meet the requirements will remain at 25%; ② The US Treasury Secretary called on countries not to retaliate; ③ The base tariff will take effect on April 5, and the reciprocal tariff will take effect on the 9th. In addition, the 25% automobile tariff will take effect on the 3rd, and the automobile parts tariff will take effect on May 3rd; ④ Gold bars, copper, pharmaceuticals, semiconductors and wood products are also not subject to "reciprocal tariffs".
Today's buying and selling boundaries:
149.61
Support and resistance levels
150.97
150.46
150.13
149.08
148.75
148.24
Trading strategy:
If the price breaks through 148.75, consider buying, the first target price is 149.08
If the price breaks through 148.24, consider selling, the first target price is 148.00

A CLEAR SELL OPPORTUNITY AS NFP APPROACHES Here’s why NFP will have negative effect on USD/JPY!
Looking at the market structure, we can clearly see how selling pressure keep exerting on USDJPY. We recently Noticed a break below the price of 149.784 I’d be looking forward to seeing more decline in price. During the NFP on Friday

USD/JPY Stands Firm, But Volatility ExpectedVolatility has receded with less than 20-hours to go until Trump's tariffs are officially implemented, with traders now clearly in watch-and-wait mode. So while headline risks around tariffs remain in place, moves could remain limited unless traders are treated to any last-minute negotiations.
Typically, risk has benefitted when it has been expected that tariffs have been watered down. If that turns out to be the case by Trump's speech at 4pm ET Wednesday, indices could rise alongside the US dollar and the yen weaken.
Bit of course, the opposite is true. And that could weigh on USD/JPY. Rightly or wrongly, I'm feeling optimistic and now seeing a bounce on USD/JPY.
Two bullish pinbars found support and close above the 20-day SMA and monthly pivot point. The bias remains bullish while prices remain above Monday's low, and a break above 150 brings the 200-day SMA, February VPOPC and 152 handle into focus.
Matt Simpson, Market Analyst at City Index and Forex.com

USDJPYUSDJPY price is still in a downtrend. If the price cannot break through 150.97, it is expected that the price will drop. Consider selling the red zone.
🔥Trading futures, forex, CFDs and stocks carries a risk of loss.
Please consider carefully whether such trading is suitable for you.
>>GooD Luck 😊
❤️ Like and subscribe to never miss a new idea!

Descending Triangle UJ M5 We have a descending triangle/wedge pattern that has formed. I'm expecting to see some continuation short. This trade is based off the M5 timeframe.

bearish opportunity on UJThis trade idea was shared throughout the weekend and played out perfectly. However we still have an opportunity on the 45 min IC. Risk management is always a must...

USDJPY ShortUSDJPY is now net Short on the regression break.
I am not taking this trade due to the heavy daily roll.

Not enough strengthNot enough strength for a break up of the descending channel. I think is going to be rejects again and drop to the bottom of the channel. Be careful of a fake out, SL triggers only if a daily candle closes above the resistance.

USD/JPY Bearish Reversal Amid Structural ShiftDisclaimer: This is not professional financial advice; it is purely my personal opinion. Please consult a qualified financial expert before making any trading decisions.
Initially, I planned to go long on USD/JPY based on the bullish momentum observed in the 4-hour time frame. However, the external structural high struggled to break, signalling potential weakness. Soon after, price action began forming lower lows, confirming a shift in structure to the downside.
A solid change of character (ChoCh) occurred following a liquidity sweep on the opposite side of the chart, reinforcing the bearish outlook. Given this shift, I adapted my strategy accordingly, favouring a short position.
Additionally, unexpected news from the Eurozone impacted USD pairs, accelerating price movements beyond my anticipated entry. This volatility was likely driven by macroeconomic factors, including a Dow Jones report on tariffs that may have influenced broader USD sentiment.
Key Takeaways:
Bearish Structural Shift – Lower lows formed after failure to break external structural highs.
Change of Character (ChoCh) – Liquidity sweep indicated a momentum shift.
Fundamental Influence – News from the Eurozone and tariff-related updates impacted USD pairs.
I'll be monitoring further price action to confirm bearish continuation and potential re-entry points.
#USDJPY #Forex #PriceAction #LiquiditySweep #MarketStructure

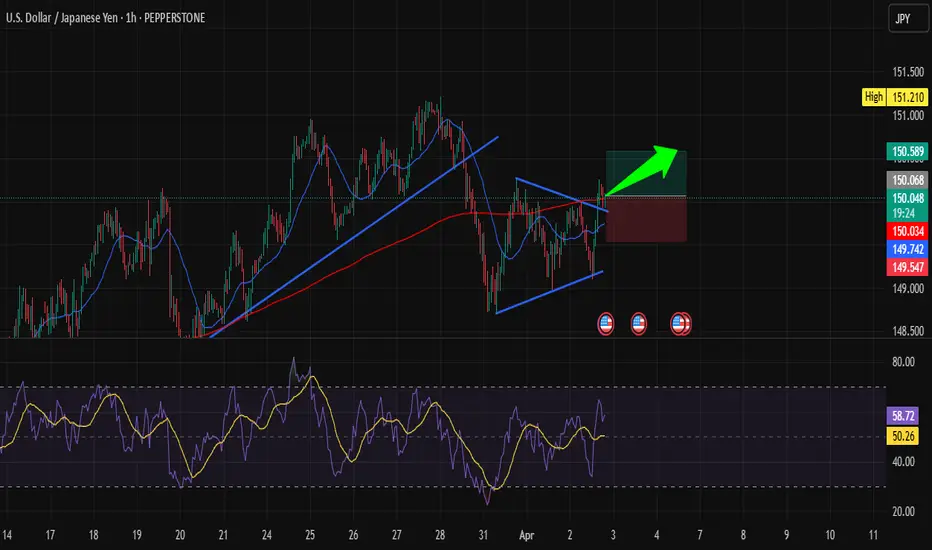
USD/JPY Ready to Take Off: Golden Opportunity on 1H!Hi traders! Analyzing USD/JPY on the 1H timeframe, spotting a potential entry:
🔹 Entry: 150.08
🔹 TP: 150.589
🔹 SL: 149.547
USD/JPY is breaking out of a bullish pennant pattern, suggesting a potential upward move. The RSI is holding above 50, indicating bullish momentum building up. If the price sustains above 150.08, we could see a push toward 150.589. Keep your eyes on price action and manage your risk!
⚠️ DISCLAIMER: This is not financial advice. Trade responsibly.
UJ continuation?as said, prev sessions high are taken out but price hasnt taken out the POI (PDH)
OB identified SM buys? cant say as this is just my view 30 pips target
if u missed early buy u can hop on the continuation until prev day is taken nevertheless trade with caution. Tradingview wont let me publish 5min so i made a video.. wait mss now weve experienced an LQ sweep + inducement.
drop your view

USD/JPY Trend Before and After Tariff Announcement✍ ✍ ✍ USD/JPY news:
➡️ Federal Reserve officials have indicated that interest rates should remain in the current range of 4.25%–4.50% for an extended period until they can assess the impact of Trump’s tariffs on inflation and economic growth.
➡️ Stronger-than-expected US ADP data provided significant support for the sharp rise in USD/JPY.
➡️ Meanwhile, the Japanese Yen (JPY) weakened against other currencies, as Trump’s policies could have a significant impact on Japan’s economic growth, given its status as one of the US’s key trading partners.
Personal opinion:
➡️ Trump’s tariff policies will significantly impact the economy nhant65. So JPY will weaken and USD/JPY will be strongly supported
➡️ Analyze based on physical dimensions - support and quantify reasonable volume with EMA to come up with a suitable strategy
Plan:
🔆Set up price zone:
👉Buy USD/JPY 149.75 – 149.85
❌SL: 149.40| ✅TP: 150.45 – 150.95
FM wishes you a successful trading day 💰💰💰

JPY/USD: Bearish Triangle Pattern Breakout Towards TargetChart Pattern: Triangle Pattern
Pattern Description
Type: The chart identifies a Triangle Pattern, which is a type of consolidation pattern that can act as either a continuation or reversal pattern depending on the preceding trend and the breakout direction. Triangles are characterized by converging trendlines, indicating a period of indecision in the market as the price range narrows.
Specific Type: This appears to be a Symmetrical Triangle, as the upper and lower trendlines converge at a similar angle, suggesting neither buyers nor sellers have clear control during the consolidation phase.
Appearance on the Chart:
The Triangle Pattern is marked with two converging trendlines:
Upper Trendline (Resistance): Connects the lower highs, sloping downward.
Lower Trendline (Support): Connects the higher lows, sloping upward.
The pattern began forming around March 27, after a sharp downtrend, and continued until the breakout on April 2, 2025.
Breakout Direction:
Symmetrical Triangles can break out in either direction, but they often continue the preceding trend. In this case, the preceding trend was bearish (a sharp decline from 0.006720 to 0.006640), and the breakout is to the downside, confirming a bearish continuation.
The chart shows the price breaking below the lower trendline of the triangle around April 2, 2025, with a strong bearish candle, indicating a confirmed bearish breakout.
Key Levels and Trading Setup
1. Support Level
A horizontal support zone is marked around 0.006640 (approximately 0.00664–0.00665).
This level acted as a base during the triangle formation, with the price bouncing off this zone multiple times (e.g., on March 28 and March 31).
The price has now broken below this support, turning it into a resistance level on any potential retest.
2. Resistance Level
A resistance zone is marked around 0.006705 (approximately 0.00670–0.00671).
This level corresponds to a previous high within the triangle and aligns with the upper boundary of the triangle at the time of the breakout.
After the breakout, this resistance level is where the stop loss is placed, as a move back above this level would invalidate the bearish setup.
3. Target
The target for the breakout is projected at 0.006599 (approximately 0.00660).
This target is likely calculated by measuring the height of the triangle at its widest point (from the highest high to the lowest low within the pattern) and projecting that distance downward from the breakout point.
The chart indicates a potential move of -0.000604 (-0.96%), which aligns with the distance from the breakout level (around 0.006654) to the target (0.006599).
4. Stop Loss
A stop loss is suggested above the resistance level at 0.006705.
This placement ensures that if the breakout fails and the price moves back above the triangle’s lower trendline (now acting as resistance), the trade is exited with a manageable loss.
Trading Setup Summary
Entry:
The setup suggests entering a short (sell) position after the price breaks below the lower trendline of the Triangle Pattern, which occurred around April 2, 2025. The breakout is confirmed by a strong bearish candle closing below the trendline at approximately 0.006654.
Stop Loss:
Place a stop loss above the resistance level at 0.006705 to protect against a false breakout or reversal. The distance from the breakout level (0.006654) to the stop loss (0.006705) is 0.000051, representing the risk on the trade.
Take Profit/Target:
Aim for the target at 0.006599, which is the projected price objective based on the triangle’s height. The distance from the breakout level to the target is 0.000055, or a 0.96% move.
Risk-Reward Ratio:
The risk is 0.000051 (from 0.006654 to 0.006705), and the reward is 0.000055 (from 0.006654 to 0.006599), giving a risk-reward ratio of approximately 1:1.08 (0.000055 / 0.000051). While this ratio is slightly above 1:1, it’s on the lower side for a typical trading setup, so traders should ensure high confidence in the breakout.
Additional Observations
Price Action Context:
Before the triangle formed, the price experienced a sharp decline from 0.006720 (March 23) to 0.006640 (March 27), indicating a strong bearish trend.
The triangle represents a consolidation phase within this downtrend, and the downside breakout suggests a continuation of the bearish momentum.
Volume and Momentum:
The chart doesn’t display volume or momentum indicators (e.g., RSI, MACD). However, a typical confirmation of a triangle breakout would include:
An increase in volume on the breakout candle, indicating strong selling pressure.
Bearish momentum signals, such as an RSI below 50 or a bearish MACD crossover.
Traders might want to check these indicators for additional confirmation of the breakout’s strength.
Timeframe:
This is a 1-hour chart, so the setup is intended for short-term trading, with the target potentially being reached within a few hours to a day.
Market Context:
USD/JPY is influenced by factors like U.S. dollar strength, Japanese yen safe-haven demand, and interest rate differentials. A bearish move in USD/JPY could be driven by a stronger yen (e.g., due to risk-off sentiment) or a weaker dollar (e.g., due to dovish U.S. economic data).
Conclusion
The TradingView idea presents a bearish setup for USD/JPY based on a Symmetrical Triangle Pattern on the 1-hour chart. The price has broken below the triangle’s lower trendline, confirming a bearish continuation with a target of 0.006599. The setup includes a stop loss at 0.006705 to manage risk, offering a risk-reward ratio of approximately 1:1.08. Key levels to watch include the former support (now resistance) at 0.006640 and the resistance at 0.006705. Traders should consider additional confirmation from volume and momentum indicators, as well as broader market conditions, before executing the trade. Since this chart is from April 2, 2025, market conditions may have evolved, and I can assist with searching for more recent data if needed!

TRADING PLAN: USDJPY LONG TRADE SETUP Given the bullish sentiment in UJ today, and the successful liquidity grab at the London session low, we'll take a long position. Our initial target is a 1:1 risk-reward ratio, followed by a 1:2 ratio after securing some profits.

USDJPY NEXT MOVE Support Breakdown:
The analysis assumes that the price will respect the support level and bounce back up. However, if the support at around 149.000 is broken, we might see a further decline rather than a bullish reversal.
2. False Breakout at Resistance:
The target suggests a move toward 151.000 resistance. However, price might fail to break above resistance and reverse back down, trapping buyers in a bull trap.
3. Sideways Movement (Consolidation):
The price may not follow the expected movement and could enter a range-bound phase, moving sideways between support and resistance.
4. Fundamental Factors:
Unexpected economic news, central bank intervention, or geopolitical events could disrupt the technical setup, leading to an outcome that does not follow the projected path.

USDJPY: Long Signal with Entry/SL/TP
USDJPY
- Classic bullish setup
- Our team expects bullish continuation
SUGGESTED TRADE:
Swing Trade
Long USDJPY
Entry Point - 149.48
Stop Loss - 148.96
Take Profit - 150.43
Our Risk - 1%
Start protection of your profits from lower levels
Disclosure: I am part of Trade Nation's Influencer program and receive a monthly fee for using their TradingView charts in my analysis.
❤️ Please, support our work with like & comment! ❤️

USDJPY DOWNWARDhello fellow traders, we wait for another down/retracements on this pair FX:USDJPY , but this is only my view, you can share yours if you have any idea.
1st target 148.6,
Long zone 145 . this idea base on my own understanding, on my other pairs that posted, still valid folks. GU, GJ, XAU. are we all connected?
this is not a financial advice,
follow for more swing trades. swing it....

USDJPY INTRADAY capped bearish below 151.20 awaits tariff dataThe USDJPY currency pair remains in a bearish trend, with the recent price action showing signs of an oversold bounce. While a temporary rebound is in play, the broader sentiment remains weak unless a decisive breakout occurs.
Key Levels to Watch:
Resistance Levels: 151.21 (critical level), 152.20, 153.04
Support Levels: 149.17, 148.26, 147.22
Bearish Scenario:
A rejection from the 151.21 resistance level could reaffirm the downside bias, leading to a continuation of the bearish move toward 149.17, with extended declines targeting 148.26 and 147.22 over the longer timeframe.
Bullish Scenario:
A breakout above 151.21 with a daily close above this level would challenge the bearish sentiment, opening the door for further gains toward 152.20, followed by 153.04.
Conclusion:
The market sentiment remains bearish, with 151.21 acting as a critical resistance zone. A rejection from this level could reinforce the downtrend, while a confirmed breakout would shift the outlook to bullish, favouring further upside. Traders should closely monitor price action at this key level for confirmation.
This communication is for informational purposes only and should not be viewed as any form of recommendation as to a particular course of action or as investment advice. It is not intended as an offer or solicitation for the purchase or sale of any financial instrument or as an official confirmation of any transaction. Opinions, estimates and assumptions expressed herein are made as of the date of this communication and are subject to change without notice. This communication has been prepared based upon information, including market prices, data and other information, believed to be reliable; however, Trade Nation does not warrant its completeness or accuracy. All market prices and market data contained in or attached to this communication are indicative and subject to change without notice.
