USD-JPY Resistance Ahead! Sell!
Hello,Traders!
USD-JPY keeps growing
But will soon hit a horizontal
Resistance of 151.466
So after the retest we will
Be expecting a local
Bearish correction
Sell!
Comment and subscribe to help us grow!
Check out other forecasts below too!
Disclosure: I am part of Trade Nation's Influencer program and receive a monthly fee for using their TradingView charts in my analysis.
USDJPY.1000.DUB trade ideas

USDJPY LongAussie Inflation and BOJ Decision in focuse
Dollar getting strong because of FED Decision:,,No-rates cuts!,,
2 ways to trade this:
aggressive entry
and conservative entry:Risk to enter the 2nd approach(That price comes back to the 2nd entry is 37,25% but higher reward-risk ratio
Risk management based on your risk appetite

USD/JPY Trend Coming Up - Further Upward?🔔🔔🔔 USD/JPY news:
➡️ Hawkish bets on the Bank of Japan (BoJ) have been fueled by expectations of further wage hikes. Last week, Japan’s largest labor union group, Rengo, reported that companies had agreed to a 5.4% wage increase this year.
➡️ Although investors have supported the USD against the JPY, the greenback has underperformed against other currencies following President Donald Trump’s implementation of a 25% tariff on imported automobiles to the U.S., set to take effect on April 2.
➡️ Higher tariffs will mainly burden American importers, who are likely to pass the costs onto consumers. Such a scenario could drive inflation in the U.S. economy, eroding household purchasing power.
➡️ Fears of resurging inflationary pressures and a slowdown in U.S. economic growth has prompted Federal Reserve officials to take a cautious stance.
Personal opinion:
➡️ Japan is affected by US auto tariffs because its economy relies heavily on auto exports. Higher tariffs make Japanese cars more expensive in the US, reducing demand, reducing sales for automakers and potentially leading to job losses and slowing economic growth. So it makes sense for the JPY to weaken relative to the USD
➡️Analyze based on important resistance - support and Fibonacci levels combined with trend lines and EMA to come up with a suitable strategy
Plan:
🔆 Price Zone Setup:
👉Buy USD/JPY 150.67- 150.55
❌SL: 1.50.20 | ✅TP: 151.10 – 151.60– 151.95
FM wishes you a successful trading day 💰💰💰

USDJPYWe've got this massive inverted head and shoulder on the daily and h4 that has been forming for a full month. Major upside movement very soon. Keep a look out.

USDJPY 15M LAST PUMP TO UPSIDE BEFORE MASSIVE CRASHWe have few more up to go, still i see bearish sign LONG TERM
But we have unfinish business around 151.65-151.87 (WHICH WILL BE VERY GOOD AREA TO SELL, IF WE GET SELLING FORMATION CANDLE)
Good luck

LAST SELLING OPPORTUNITY FOR UJWe are at the last huddle for UJ, break above this upper daily trend line will suggested market change to bullish, which i still see this as bearish market (GOOD AREA AS WELL TO HOLD TILL 140.85)
Will take some profit along the way

USDJPY: Short Trading Opportunity
USDJPY
- Classic bearish pattern
- Our team expects retracement
SUGGESTED TRADE:
Swing Trade
Sell USDJPY
Entry - 150.88
Stop - 151.54
Take - 149.68
Our Risk - 1%
Start protection of your profits from lower levels
Disclosure: I am part of Trade Nation's Influencer program and receive a monthly fee for using their TradingView charts in my analysis.
❤️ Please, support our work with like & comment! ❤️

USD/JPY AnalysisIn this video I am sharing the possible scenarios that could take place for the UJ pair.
Keeping in mind that tomorrow we have Tokyo CPI and PCE numbers in the US.

15M USDJPY ANOTHER SELLING SQUIZZZZZ LOLSellers hasnt done yet, i went in as seen on the chart. Another one of those try to earn as many pips then you can :)

USD/JPY For Bullishwait for pull-back near by entry point and then go long
general trend is up trend
have fun :)

JPY/USD - Will we make a strong bounce?The JPY/USD is in a downward channel. Will it find support around 0.006 and rebound, or will it break below this key level?
The pair has nearly reached a major support zone—an area where buyers have previously shown strong interest. This level has historically acted as both strong resistance and support, increasing the likelihood of a bounce if buyers step in.
What do we want to see?
For a continuation to the upside, we need this level to hold as support. A bullish engulfing candle could signal a potential reversal.
If JPY/USD is to move lower, we need a clear break below support with high volume to confirm the breakout. In that case, lower prices could follow.
Thanks for your support.
- Make sure to follow me so you don't miss out on the next analysis!
- Drop a like and leave a comment!

USD/JPY Technical Analysis (1-Hour Timeframe)Market Overview:
Trend: Bullish
Divergence: Bearish
Continuation Pattern: Bullish
Reversal Pattern: None
Harmonics: AB=CD Formation
Trade Plan:
You are taking a short-term long entry from point B to D based on the bullish trend continuation. A Buy Stop order is placed at 150.963, with a Stop Loss at 150.001 and Take Profit at 151.925 (Potential Reversal Zone).
Scenario Analysis:
Current Approach:
Entering a buy trade from B to D, following the bullish trend.
Watching price action closely as it reaches the Potential Reversal Zone (151.925).
Next Steps:
If the price continues to break higher above 151.925, you will reanalyze the chart for further trend continuation opportunities.
If the price shows reversal signs at the Potential Reversal Zone, you will look for a short (sell) setup, aligning with the bearish divergence and reversal pattern (AB=CD).
Conclusion:
For now, you are riding the bullish trend from B to D while keeping an eye on 151.925 as a key resistance level. If a reversal occurs at this level, you will evaluate a sell trade setup in the downtrend.
This approach ensures a disciplined trading strategy, adapting to market conditions.


USDJPY is Testing 150 AgainLast week, USDJPY got rejected from the cup&handle's 150 resistance, then break the 149 support, fell sharply. The recovery is in process but the broken trendline is a major hinderance in front of USDJPY bulls. Now the trendline and 150 resistance converged and USDJPY is trying another attempt towards this key resistance. As long as it holds, there is a good chance another downward reaction to begin.
Hovewer, after testing it 5 times, if USDJPY regain control of 150, the short term outlook might turn bullish.

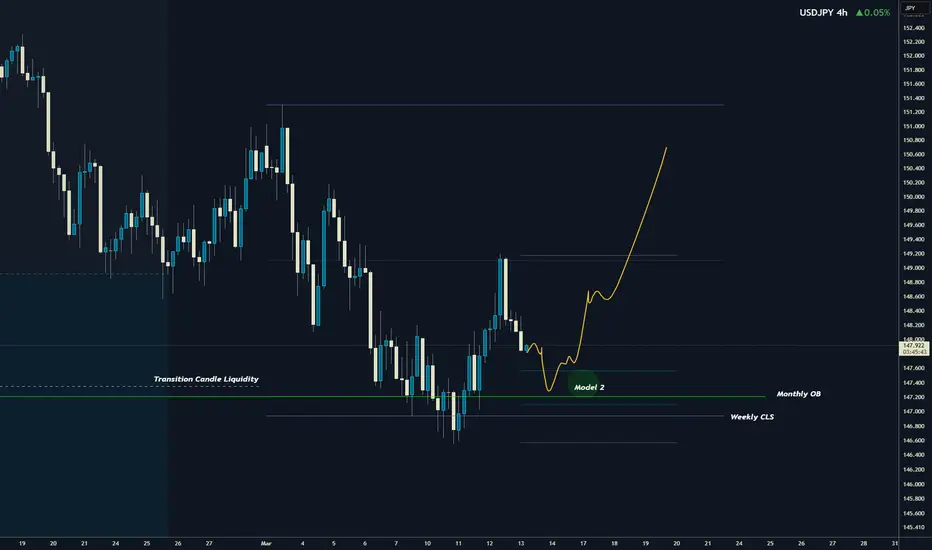
USDJPY I Weekly CLS, KL - Monthly OB, Model 2Hey Traders!!
Feel free to share your thoughts, charts, and questions in the comments below—I'm about fostering constructive, positive discussions!
🧩 What is CLS?
CLS represents the "smart money" across all markets. It brings together the capital from the largest investment and central banks, boasting a daily volume of over 6.5 trillion.
✅By understanding how CLS operates—its specific modes and timings—you gain a powerful edge with more precise entries and well-defined targets.
🛡️Follow me and take a closer look at Models 1 and 2.
These models are key to unlocking the market's potential and can guide you toward smarter trading decisions.
📍Remember, no strategy offers a 100%-win rate—trading is a journey of constant learning and improvement. While our approaches often yield strong profits, occasional setbacks are part of the process. Embrace every experience as an opportunity to refine your skills and grow.
Wishing you continued success on your trading journey. May this educational post inspire you to become an even better trader!
“Adapt what is useful, reject what is useless, and add what is specifically your own.”
David Perk ⚔
151.00 Cracks: Is USD/JPY’s Rally Over? Key Levels AheadFrom a fundamental perspective, the USD/JPY exchange rate retreated from around the 151.00 level. Despite the poor Japanese PMI data on Monday, investors bought the Japanese yen influenced by the hawkish outlook of the Bank of Japan (BoJ). The minutes of the January meeting showed that policymakers tend to tighten policies when appropriate. The BoJ governor also stated that the degree of monetary easing will be adjusted once the 2% inflation target is achieved.
Technically, the overnight breakout above the 150.00 psychological mark and the 200 - period Simple Moving Average (SMA) on the 4 - hour chart is a bullish signal. Indicators on the daily chart also support appreciation, and pullbacks may present buying opportunities. If the rate breaks below 150.00, it may accelerate its decline to support levels such as 149.30 - 149.25. Failure to hold these levels indicates that the rebound momentum has been exhausted and the trend may turn bearish. Conversely, if it stabilizes above 151.00, the upward resistance levels are successively 151.30, 151.75 (the 200 - day SMA), and it may even rise to 153.00.
I will share trading signals every day. All the signals have been accurate for a whole month in a row. If you also need them, please click on the link below the article to obtain them.

Switch Hit on USDJPYLong position from earlier in the day got hit for a stop loss. Risking the other way for a possible reversal in this market

Bullish USDJPY Bullish USDJPY in the gap down. Looking at a retest and/or breakout of recent swing highs as targets

GBPNZD 📊 *GBPNZD Analysis*
GBPNZD is falling from the higher high area of the ascending channel and has started to move within a minor descending channel.
*Don't trade all the time* , trade forex only at the confirmed trade setups.

USD/JPY Bullish Reversal (Inverse Head & Shoulders)📌 Pattern: Inverse Head & Shoulders
📌 Analysis: The chart showcases an inverse head and shoulders pattern, a classic bullish reversal formation. The price has successfully broken out of the downward trendline, indicating potential upside movement.
🔹 Left Shoulder: Formed during the previous retracement.
🔹 Head: The lowest point of the pattern, marking strong support.
🔹 Right Shoulder: Completed with a breakout above resistance.
📈 Trading Plan:
✅ Entry (Buy): After a confirmed breakout and possible retest.
🎯 Target: 153.988 - 154.672 (2.74% potential gain).
🔻 Support: 149.883 - 148.837 (Stops should be placed accordingly).
📊 Conclusion:
If the price maintains above the breakout level, we may see a strong rally toward the resistance target. Watch for volume confirmation and pullback retests before entering a trade.

USDJPYThere is strong bullish momentum in USD/JPY and I have identified a potential cup and handle formation on the chart. This pattern typically signals a continuation of the upward trend after a period of consolidation. If the price successfully breaks above the previous high it could confirm the pattern and lead to a significant bullish rally


USDJPY previous support now resistance retest at 151.21The USDJPY currency pair remains in a bearish trend, with the recent price action showing signs of an oversold bounce. While a temporary rebound is in play, the broader sentiment remains weak unless a decisive breakout occurs.
Key Levels to Watch:
Resistance Levels: 151.21 (critical level), 152.20, 153.04
Support Levels: 149.17, 148.26, 147.22
Bearish Scenario:
A rejection from the 151.21 resistance level could reaffirm the downside bias, leading to a continuation of the bearish move toward 149.17, with extended declines targeting 148.26 and 147.22 over the longer timeframe.
Bullish Scenario:
A breakout above 151.21 with a daily close above this level would challenge the bearish sentiment, opening the door for further gains toward 152.20, followed by 153.04.
Conclusion:
The market sentiment remains bearish, with 151.21 acting as a critical resistance zone. A rejection from this level could reinforce the downtrend, while a confirmed breakout would shift the outlook to bullish, favoring further upside. Traders should closely monitor price action at this key level for confirmation.
This communication is for informational purposes only and should not be viewed as any form of recommendation as to a particular course of action or as investment advice. It is not intended as an offer or solicitation for the purchase or sale of any financial instrument or as an official confirmation of any transaction. Opinions, estimates and assumptions expressed herein are made as of the date of this communication and are subject to change without notice. This communication has been prepared based upon information, including market prices, data and other information, believed to be reliable; however, Trade Nation does not warrant its completeness or accuracy. All market prices and market data contained in or attached to this communication are indicative and subject to change without notice.
