USDJPY: Short Trade Explained
USDJPY
- Classic bearish formation
- Our team expects pullback
SUGGESTED TRADE:
Swing Trade
Short USDJPY
Entry - 150.41
Sl - 151.17
Tp -148.98
Our Risk - 1%
Start protection of your profits from lower levels
Disclosure: I am part of Trade Nation's Influencer program and receive a monthly fee for using their TradingView charts in my analysis.
❤️ Please, support our work with like & comment! ❤️
USDJPY.1000.DUB trade ideas

USDJPY 18K PROFIT LIVE TRADE AND BREAK DOWNUSD/JPY rebounds toward 150.50 on risk recovery
USD/JPY is bouncing back toward 150.50 in Wednesday's Asian session. The pair reverses US President Trump's fresh tariff threats and hawkish BoJ commentary-led drop, tracking the rebound in risk sentiment and the US Dollar. All eyes stay on US tariffs, data and Fedspeak.

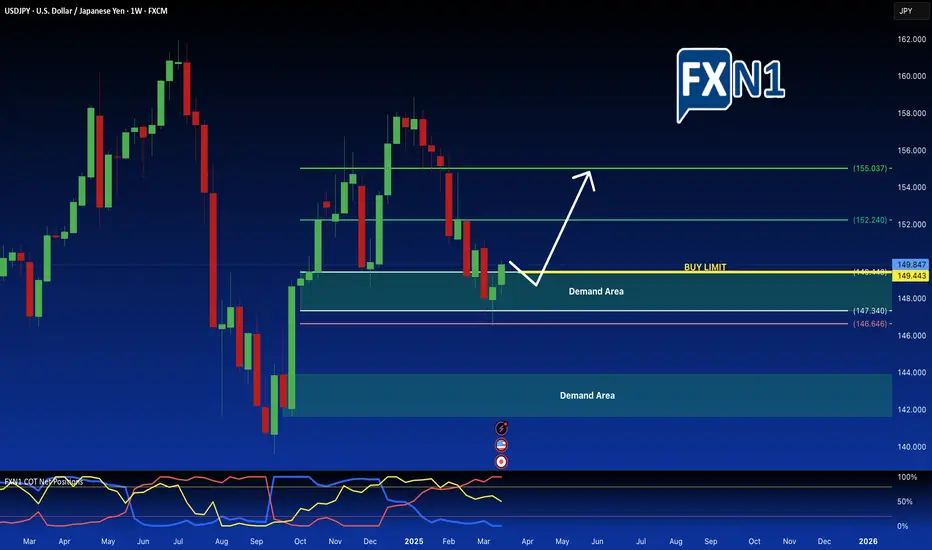
USD/JPY: Long Opportunity at Weekly Demand ZoneThe USD/JPY currency pair is currently pulling back into a significant weekly demand area, presenting a promising opportunity for traders looking to enter long positions. This area historically denotes strong buying interest, suggesting potential upward momentum.
In contrast, the 6J1! Yen futures market displays a bearish sentiment, with many retail traders positioning against this bullish signal in USD/JPY. This divergence in market sentiment could create unique trading opportunities for those who can effectively interpret technical indicators and retail positioning.
Yen Futures
To capitalize on this potential rebound, a pending order has been set on the CFD for USD/JPY, with a buy limit positioned just above the demand zone. Effective risk management, including a stop-loss just below the demand area, is essential as traders navigate this evolving landscape.
In summary, the combination of strong demand at critical levels and contrasting sentiment in the futures market presents a strategic trading scenario for bullish plays in USD/JPY.
✅ Please share your thoughts about USD/JPY in the comments section below and HIT LIKE if you appreciate my analysis. Don't forget to FOLLOW ME; you will help us a lot with this small contribution.
UsdjpyUsdjpy as we can see we have a very strong bullish movement to the upside we have the 1 day to 15 minutes on de uptrend so we buy more

USD/JPY Technical Analysis - Reversal PointsCurrently, USD/JPY is in a bearish momentum, meaning the price is moving downward. Once this bearish move ends, a bullish reversal is expected. I have marked two key zones where a potential reversal could occur.
Potential Reversal Zones (Support Levels):
1. 146.500 - 147.500 → A critical support area where price may bounce and start a bullish move.
2. 143.500 - 144.500 → If the price continues downward, this is the next key level where a bullish reversal could happen.
Bullish Targets (Resistance Levels):
If a reversal occurs, I expect the price to reach:
1. 156.000 - 157.500 → The first major resistance level.
2. 161.500 - 162.000 → If bullish momentum strengthens, the price may push toward this level.
Conclusion :
USD/JPY is expected to remain bearish until it reaches one of the identified support zones. If a bullish signal appears at these levels, the price could then push toward the mentioned resistance zones. 🚀

ZN, US10Yr & USDJPY Daily Trade SetupsIn this update we review the recent price action in the US Treasury Bonds, The US 10yr yield & the USDJPY and identify the next high-probability trade setups and price targets. To reivew today's video analysis click here!

WAITING TO SQUIZZZ IN SELLING PIPS LOLWill add sell once we take out SUPPORT @ 150.03 AREA Target 149.62 (15m time frame trade)
Will update as soon im in
Hollaaaa

USDJPY Short/Sell IdeaUSDJPY Appears to have stalled and is setup for a short to next support zone. I believe it sells off here.

USDJPY Short (future trade!)This is reverse USDJPY trade....The oppositie of the long trade published.
For example today it is not a good time to short the dollar,as technically the price caught in the middle of the range.....Better we wait to reach the higher zone.IF PRICE COMES DOWN to the lower range,then we can plan the long tradefirst(See my USDJPY long apporach!)

USDJPY TIME TO GO BACK DOWN???Good area to SELL this again, as we can see we came to retest NECKLINE OF BROKEN H&S that happen on the 25/03/25
If this HOLD i can see bigger DOWNWARD move with UJ
if we hold this BROKEN NECKLINE, I will hold some position till the end of this week and see how low can we go (But as always i will take some profit along the way)
TP1 149.75
TP2 148.35
TP3 HOLD (I SEE LONG TERM AS LOW AS 140.81)
Let see what this beautiful WEDNESDAY brings
HAPPY TRADING

Yen Steady Near 150.7 as Dollar StrengthensThe Japanese yen hovered near 150.7 per dollar on Tuesday as the U.S. dollar strengthened. Concerns grew over Japan’s exports following Trump’s proposed tariffs on autos and pharmaceuticals. BOJ minutes showed officials remain open to future rate hikes, with one member suggesting a 1% rate by late FY2025. The central bank kept rates steady at 0.5% last week, citing global uncertainties.
Key resistance is at 151.70, with further levels at 152.70 and 154.00. Support stands at 147.00, followed by 145.80 and 143.00.

JPY/USD Technical Analysis – Bullish Breakout from Falling WedgeIntroduction
The JPY/USD chart showcases a classic falling wedge pattern, a strong bullish reversal signal. This pattern is characterized by converging downward-sloping trendlines, indicating a weakening bearish momentum. Eventually, buyers stepped in, leading to a breakout to the upside. This analysis breaks down key elements, including support and resistance zones, trendlines, trading strategy, and risk management.
1. Breakdown of the Chart Pattern
A. The Falling Wedge Formation (Bullish Reversal Pattern)
A falling wedge is a bullish technical pattern that forms when the price consolidates within two downward-sloping trendlines that converge over time. This signals that selling pressure is decreasing and a reversal may be near.
Downtrend Structure: The price was previously in a consistent downtrend, making lower highs and lower lows, which formed the wedge.
Breakout Confirmation: Once the price broke above the upper trendline, the pattern was confirmed, indicating the start of a bullish move.
Retest Possibility: Often, after a breakout, the price retests the upper trendline before continuing higher. If it holds, it strengthens the bullish outlook.
B. Key Levels Identified in the Chart
1. Support Zone (Buying Area)
The price found strong support in the 0.006291 – 0.006500 region.
Buyers stepped in, preventing the price from dropping further.
This support level coincides with the bottom of the wedge, further validating its importance.
2. Resistance Zone (Profit Target)
The 0.007100 – 0.007200 area is a major resistance level where sellers have previously dominated.
If the price reaches this level and consolidates, traders will look for either a breakout or a rejection.
A break above 0.007200 would indicate further bullish continuation.
3. Trendlines & Curve Formation
A curved trendline in the chart suggests a gradual transition from bearish to bullish momentum.
The dotted ascending trendline now acts as dynamic support, helping the price sustain its bullish move.
2. Trading Strategy & Risk Management
A. Entry Strategies
Traders have two primary ways to enter this trade:
Aggressive Entry:
Enter immediately after the breakout of the wedge.
Higher risk but captures early momentum.
Conservative Entry:
Wait for a pullback to the trendline before entering.
Lower risk as it confirms trend continuation.
B. Take Profit Targets
Primary Target: 0.007117 (Resistance level from previous highs).
Extended Target: 0.007200 (Next significant resistance).
C. Stop Loss Placement
Below the recent swing low at 0.006291 to protect against false breakouts.
Ensures a favorable risk-to-reward ratio.
3. Market Sentiment & Confirmation Signals
✅ Bullish Confirmation
Breakout from the falling wedge
Price holding above the trendline
Higher highs and higher lows formation
Increased buying volume
⚠️ Bearish Risks & Invalidations
A break below the trendline would indicate weak momentum.
If the price fails to hold support, it could reverse downward.
Low volume on the breakout could signal a fake breakout.
4. Final Thoughts
This setup provides a high-probability trading opportunity following the breakout from a falling wedge pattern. The risk-to-reward ratio is favorable, making it an ideal setup for trend-following traders. However, patience is key—waiting for a successful retest before entering can minimize risks. If the price maintains momentum, we could see a rally toward the 0.007100 – 0.007200 resistance zone in the coming weeks. 🚀


USDJPY BUYING SETUPOur analysis is based on multi-timeframe top-down analysis & fundamental analysis.
Based on our view the price will rise to the monthly level.
DISCLAIMER: This analysis can change anytime without notice and is only for assisting traders in making independent investment decisions. Please note that this is a prediction, and I have no reason to act on it, and neither should you.
Please support our analysis with a like or comment!
Let’s master the market together. Please share your thoughts and encourage us to do more by liking this idea.

Market Analysis: USD/JPY Eyes Fresh SurgeMarket Analysis: USD/JPY Eyes Fresh Surge
USD/JPY is rising and might gain pace above the 151.00 resistance.
Important Takeaways for USD/JPY Analysis Today
- USD/JPY climbed higher above the 149.55 and 150.00 levels.
- There is a connecting bullish trend line forming with support at 150.30 on the hourly chart at FXOpen.
USD/JPY Technical Analysis
On the hourly chart of USD/JPY at FXOpen, the pair started a fresh upward move from the 148.20 zone. The US Dollar gained bullish momentum above 148.80 against the Japanese Yen.
It even cleared the 50-hour simple moving average and 149.55. The pair climbed above 150.00 and traded as high as 150.94. It is now consolidating gains and there was a move below the 23.6% Fib retracement level of the upward move from the 148.18 swing low to the 150.94 high.
The current price action above the 150.00 level is positive. Immediate resistance on the USD/JPY chart is near 150.95. The first major resistance is near 151.20. If there is a close above the 151.20 level and the RSI moves above 70, the pair could rise toward 152.50.
The next major resistance is near 153.20, above which the pair could test 155.00 in the coming days. On the downside, the first major support is 150.30 and a bullish trend line, below which the bears could gain strength.
The next major support is visible near the 149.55 level and the 50% Fib retracement level of the upward move from the 148.18 swing low to the 150.94 high.
If there is a close below 149.55, the pair could decline steadily. In the stated case, the pair might drop toward the 148.40 support zone. The next stop for the bears may perhaps be near the 147.50 region.
This article represents the opinion of the Companies operating under the FXOpen brand only. It is not to be construed as an offer, solicitation, or recommendation with respect to products and services provided by the Companies operating under the FXOpen brand, nor is it to be considered financial advice.

Yen Slides as Tariff Concerns LoomMacro:
- The Japanese yen weakened in the last few days as markets eyed the potential impact of upcoming US reciprocal tariffs on key Japanese exports.
- Minutes from the BoJ's Jan meeting showed policymakers remain open to further rate hikes, depending on wage growth and inflation data.
- Recent comments from US President Trump helped ease the concerns about the escalating tariff war, boosting the overall market's sentiment.
Technical:
- USDJPY broke the descending channel to give the first glimpse of a potential trend reversal. The price is hovering around its previous swing high, waiting for a clear breakout to determine the upcoming trend.
- If USDJPY breaks above 151.00 and EMA78, the price may surge further to retest the following resistance at 154.70.
- On the contrary, remaining below resistance at 151.00 may prompt a retest to the broken descending channel and the support at 148.60.
Analysis by: Dat Tong, Senior Financial Markets Strategist at Exness

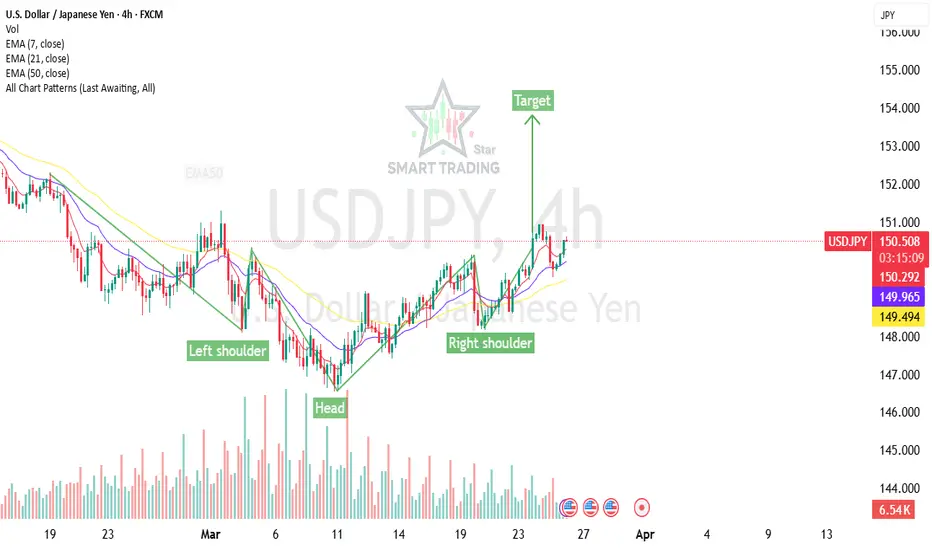
USD/JPY Buy Setup – Inverted Head & Shoulders chart pattern📌 **USD/JPY Buy Setup – Inverted Head & Shoulders** 📌
🔹 **Pattern:** 📈 **Inverted Head & Shoulders** (Bullish Reversal Signal)
🔹 **Entry Point:** ✅ **150.500** (Neckline breakout confirmation recommended)
🔹 **Target:** 🎯 **153.800** (Measured move projection from pattern breakout)
🔹 **Stop Loss:** 🔍 Ideally **below 149.800** (Neckline retest zone or recent swing low)
### 📊 **Analysis & Risk Management:**
✅ **Confluence Factors:**
- **Bullish Chart Pattern:** Inverted H&S suggests trend reversal.
- **DXY Strength:** If USD remains strong, it supports this setup.
- **Yield Differentials:** Watch US-Japan bond yields, as rising US yields boost USD/JPY.
✅ **Risk-Reward Ratio:** ~ **1:5**, making it a high-probability trade.
✅ **Trade Management:**
- If price retests **150.500** after breakout, it could be a strong entry confirmation.
- Secure profits gradually (e.g., **TP1: 152.000**, **TP2: 153.000**, **TP3: 153.800**).
- Use **trailing stop-loss** to lock in gains as price moves higher.
🚨 **Market Caution:**
📅 **Fundamental Watch:** Monitor key news such as:
- **BoJ Policy Decisions** (Any intervention risk if JPY weakens too much)
- **US Economic Data** (CPI, NFP, Fed Statements)
- **Global Risk Sentiment** (If risk-off, JPY may strengthen unexpectedly)
🔥 **Final Tip:** Confirm entry with bullish candle patterns & volume spike on breakout for added confidence.
Happy Trading! 🚀📈💰
USDJPY POSSIBLE BUY OPPORTUNITY Price continues to rise in H1 timeframe as we recently saw a close above 150.579 area. A buy opportunity is envisaged from the current market price. Our target profit is at the area of 151.310

USDJPYUSDJPY
- Bullish Channel as an Corrective Pattern in Long Time Frame
- Break of Structure
- RSI - Divergence
- Completed " 1234 " Impulsive Waves
- Fibonacci Level - 38.20%


USDJPY InsightHello, Subscribers!
I’m glad to see you all. Please share your personal opinions in the comments. Don’t forget to like and subscribe!
Key Points
- According to the Bank of Japan's January meeting minutes, members agreed that if economic activity and inflation outlooks materialize as expected, an additional rate hike would be appropriate due to low real interest rates.
- President Donald Trump met with reporters in the Oval Office on April 2 and stated that tariffs "will create more jobs," emphasizing that his tariffs are fair.
- The market is keeping an eye on the U.S. reciprocal tariffs set for April 2 while also focusing on the PCE price index release on Friday.
This Week’s Key Economic Events
+ March 26: U.K. February Consumer Price Index (CPI)
+ March 28: U.K. Q4 GDP, U.S. February Personal Consumption Expenditures (PCE) Price Index
USDJPY Chart Analysis
USDJPY found support at the lower trendline near the 147 level and has since broken through the upper trendline, expanding its gains to the 151 level. The key focus now is whether it can maintain its uptrend while holding the 149.500 level. If USDJPY remains above 149.500, an upside move toward the 154–155 range is expected. However, if it breaks below 149.500, the pair could decline further toward the 145 level.

USD/JPY(20250326)Today's AnalysisToday's buying and selling boundaries:
150.12
Support and resistance levels:
151.50
150.98
150.65
149.59
149.25
148.73
Trading strategy:
If the price breaks through 150.12, consider buying, the first target price is 150.65
If the price breaks through 149.59, consider selling, the first target price is 149.25

UJ 5 Star shortfor me this is a 5 star trade, UJ going up into a R1 resistance area @150.25 on par with the recent down trendline from the 1 hour and the overall trend. A 1 hour candle close above 150.31 would cancel this trade for me
