UJ 5 Star shortfor me this is a 5 star trade, UJ going up into a R1 resistance area @150.25 on par with the recent down trendline from the 1 hour and the overall trend. A 1 hour candle close above 150.31 would cancel this trade for me
USDJPY.1000.DUB trade ideas

USDJPY NEXT MOVESell after bearish candle stick pattern, buy after bullish candle stick pattern....
Best bullish pattern , engulfing candle or green hammer
Best bearish pattern , engulfing candle or red shooting star
NOTE: IF YOU CAN'T SEE ANY OF TOP PATTERN IN THE ZONE DO NOT ENTER
Stop lost before pattern
R/R %1/%3
Trade in 5 Min Timeframe, use signals for scalping

USDJPY Trending Lower - Will It Drop To 145.200?OANDA:USDJPY is currently trading within a descending channel, indicating a strong bearish structure. The price has broken below a key support zone and may now pull back for a potential retest. This level previously acted as support and could now serve as resistance, aligning with a possible bearish continuation.
If sellers confirm resistance at this zone, the price is likely to move downward toward the 145.200 target. However, a failure to reject this level could indicate a potential shift in momentum.
Traders should monitor for bearish confirmation signals, such as bearish engulfing candles, strong wicks rejecting the resistance zone, or increased selling volume, before considering short positions.
Let me know your thoughts or any additional insights you might have!

USDJPY READY FOR SELL OFF :)))As you can see we have fill all IMBALANCE, and we have this good H&S Pattern play out like a boss
That Chart no need introduction looks as simple as ABCD LOL
This week UJ looks like the one will give loads of opportunity

Usdjpy buy limit trade setup Usdjpy has broken structure and has pulled back to our 1hr decisional orderblock and has given a 15min internal ChOCh, best believe, we are all set to rally to the upside, buy limit set and hopefully Asian session drives prices a little lower to trigger our entry before the rally

USDJPY Sell Now.USDJPY is in bearish momentum previosuly there is small correction after which it is expected to move again with sellers wiill. accordingly TPs and SL is choosen.
USDJPY(Review & Speculations for the next day)Simple Chart Analysis. I will advice u wait for the BUY I talk about in the Video..ENJOY!! And Don't Struggle with a Simple Profit

Yen stabilizes after BoJ minutes hint at tighter policyThe Japanese yen has rebounded on Tuesday after sliding almost 1% a day earlier. In the European session, USD/JPY is trading at 150.11, down 0.39% on the day. The yen weakened to 150.94 in the Asian session, its lowest level since March 3.
The Bank of Japan raised rates at the January meeting for only the third time since the central bank started its tightening cycle in March 2024. At the meeting, the Bank raised rates by a quarter point to 0.5%, its highest level since the 2008 global financial crisis.
At the meeting, the BoJ revised upwards its inflation forecast as members have become more confident that rising wages will keep inflation sustainable close to the Bank's 2% target. The minutes noted that most members agreed that the likelihood of reaching the 2% target was rising.
The minutes reiterated that the BoJ plans to continue to tighten policy, provided that growth and inflation outlooks match the Bank's forecasts. The BoJ has telegraphed that it plans to continue rates but has left investors guessing about a timeline. The most likely dates for the next rate hike are June or July. The BoJ held rates last week, warning of uncertainty in the global outlook, particularly the impact of the new US administration's trade policy. The BoJ is keeping a close eye on the upside risk of inflation, due to the potential of a global trade war as well as rising wages.
Japan released BoJ core inflation, a key inflation indicator, earlier today. The February report came in at 2.2% y/y, unchanged from January and matching the forecast. BoJ core inflation remains at its highest level since March 2024.

USD/JPY 4H Analysis – Potential Bearish RetestThe USD/JPY pair has been in a clear downtrend, trading within a descending channel for an extended period. Recently, price action has broken above the channel, but it is now facing resistance around the 150.35 level.
Retest Zone: The pair is currently retesting the broken trendline, and if it fails to sustain above this level, a rejection could lead to further downside.
Bearish Expectation: If the price fails to reclaim 150.35, a move towards the 147.00 support zone is likely.
Confirmation: A strong bearish candle from this level could indicate a reversal, confirming the downward move.
Traders should watch for price action signals at the retest level before making decisions.

Bearish drop?USD/JPY is rising towards the resistance level which is a pullback resistance that lines up with the 50% Fibonacci retracement and could reverse from this level to our take profit.
Entry: 150.14
Why we like it:
There is a pullback resistance level that lines up with the 50% Fibonacci retracement.
Stop loss: 150.92
Why we like it:
There is a pullback resistance level.
Take profit: 148.97
Why we like it:
There is a pullback support that is slightly below the 78.6% Fibonacci retracement.
Enjoying your TradingView experience? Review us!
Please be advised that the information presented on TradingView is provided to Vantage (‘Vantage Global Limited’, ‘we’) by a third-party provider (‘Everest Fortune Group’). Please be reminded that you are solely responsible for the trading decisions on your account. There is a very high degree of risk involved in trading. Any information and/or content is intended entirely for research, educational and informational purposes only and does not constitute investment or consultation advice or investment strategy. The information is not tailored to the investment needs of any specific person and therefore does not involve a consideration of any of the investment objectives, financial situation or needs of any viewer that may receive it. Kindly also note that past performance is not a reliable indicator of future results. Actual results may differ materially from those anticipated in forward-looking or past performance statements. We assume no liability as to the accuracy or completeness of any of the information and/or content provided herein and the Company cannot be held responsible for any omission, mistake nor for any loss or damage including without limitation to any loss of profit which may arise from reliance on any information supplied by Everest Fortune Group.

USD/JPY Trend Today - Unfavorable for JPY🔔🔔🔔 USD/JPY news:
👉Private sector activity in Japan deteriorated in March, as the composite PMI dropped from a six-month high of 52.0 in February to 48.5, signaling a renewed decline in business activity. The services PMI fell to a three-year low of 49.5 from 53.7 in February, while the manufacturing PMI declined to a multi-year low of 48.5 from 52.0 in the previous month.
👉Meanwhile, Japan’s Finance Minister, Katsunobu Kato, warned that "Japan has not yet overcome deflation." He noted that rising prices were primarily driven by a weak yen and high commodity costs rather than a cycle of wage growth and consumer demand.
👉The Bank of Japan (BoJ) is unlikely to tighten its policy significantly beyond current levels, which poses a downside risk for the JPY. Swap markets continue to indicate a rate hike of less than 50 basis points over the next twelve months.
Personal analysis:
👉JPY is underperforming most major currencies, JPY is unlikely to gain traction over USD due to the impact of fundamental information. Therefore, in the short term, this pair will maintain its upward momentum
👉However, USD/JPY is approaching the strong resistance level of 151.00. Besides, RSI (1H) is entering the overbought zone, so there will be a technical pullback to create momentum for the main uptrend.
👉Analysis based on important resistance - support and Fibonacci levels combined with Pivot points and RSI to come up with a suitable strategy
Plan:
🔆 Price Zone Setup:
👉Sell USD/JPY news: 151.00 - 151.10
❌SL: 151.45 | ✅TP: 150.60 – 150.20
FM wishes you a successful trading day 💰💰💰

USDJPY Long BOJ Dilemma and FED USDJPY getting stronger, interest rates differences between 2 currencies, FED policy to hold the interest rates,and dilemma of BOJ....
3 approches;" TAKE PROFIT TARGETS: extend the take profit target higher only, if signs of continuatioon.

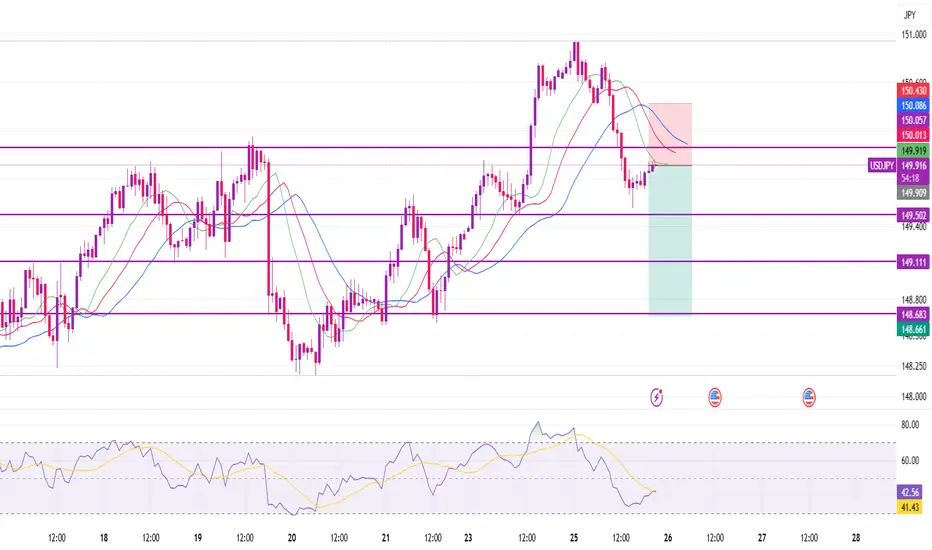
USD/JPY Pulls Back After Testing Channel ResistanceUSD/JPY has slipped to 149.67, down 0.66% on the day after stalling near the top of a rising channel. The pair failed to reclaim the 50- and 200-day SMAs, which remain tightly aligned near 151.7, now acting as resistance.
🔺 Price is still inside a short-term rising channel, but today's bearish candle suggests waning momentum.
📉 MACD remains in bearish territory, and while it’s improving, there’s no crossover yet.
📉 RSI at 49.06 hovers at the midpoint, showing a lack of conviction either way.
Key Levels:
Resistance: 151.00–151.75 (confluence of moving averages)
Support: 146.95 (61.8% Fib retracement), then 143.71 (78.6% Fib)
A break below the channel could signal a return to the broader downtrend, while a close above 151.75 would shift the short-term outlook bullish.
-MW

USDJPY Massive Short! SELL!
My dear friends,
USDJPY looks like it will make a good move, and here are the details:
The market is trading on 150.66 pivot level.
Bias - Bearish
Technical Indicators: Supper Trend generates a clear short signal while Pivot Point HL is currently determining the overall Bearish trend of the market.
Goal - 149.11
Recommended Stop Loss - 151.56
About Used Indicators:
Pivot points are a great way to identify areas of support and resistance, but they work best when combined with other kinds of technical analysis
Disclosure: I am part of Trade Nation's Influencer program and receive a monthly fee for using their TradingView charts in my analysis.
———————————
WISH YOU ALL LUCK


RARE head and shoulderCall me crazy, but a textbook head & shoulders like this is a rarity. Buyers should watch key demand zones—liquidity matters.

USDJPY R&S ANALYSIS IS READY Hello Guys Here Is Chart Of USDJPY in 1-H AT
Entry Limit: BUY Around 150.000
SUPPORT: 150.000 - 149.600
Target Will Be : 151.300
This analysis R&S the price respects the Support zone.And it went to Uptrend

usd/jpy 15 min price break out analysisUSD/JPY price break out analysis on the 15min TF.
Break-out trade on the 15min time frame. Waiting for our indication to form.

USD/JPY Trade Setup & Analysis – Bullish Reversal from 200 EMAThe 200 EMA (blue line) at 149.701 acts as a strong support level.
The 30 EMA (red line) at 150.458 represents a short-term trend guide.
Trade Setup:
Entry Point: Around 150.120 (near the 200 EMA).
Stop Loss: Below 149.496, protecting against downside risk.
Take Profit Levels:
TP1: 150.287
TP2: 150.533
TP3: 150.886
Final Target: 151.377
Strategy:
Buy Position: The expectation is for the price to bounce from the 200 EMA and move upwards toward the targets.
Risk-Reward: Favorable, as the trade has multiple profit-taking levels.


USDJPY; Heikin Ashi Trade IdeaOANDA:USDJPY
In this video, I’ll be sharing my analysis of USDJPY, using my unique Heikin Ashi strategy. I’ll walk you through the reasoning behind my trade setup and highlight key areas where I’m anticipating potential opportunities.
I’m always happy to receive any feedback.
Like, share and comment! ❤️
Thank you for watching my videos! 🙏

USD/JPY H4 | Falling to pullback supportUSD/JPY is falling towards a pullback support and could potentially bounce off this level to climb higher.
Buy entry is at 149.97 which is a pullback support that aligns with a confluence of Fibonacci levels i.e. the 23.6% and 38.2% retracements.
Stop loss is at 149.10 which is a level that lies underneath an overlap support and the 38.2% Fibonacci retracement.
Take profit is at 151.17 which is an overlap resistance.
High Risk Investment Warning
Trading Forex/CFDs on margin carries a high level of risk and may not be suitable for all investors. Leverage can work against you.
Stratos Markets Limited (www.fxcm.com):
CFDs are complex instruments and come with a high risk of losing money rapidly due to leverage. 63% of retail investor accounts lose money when trading CFDs with this provider. You should consider whether you understand how CFDs work and whether you can afford to take the high risk of losing your money.
Stratos Europe Ltd (www.fxcm.com):
CFDs are complex instruments and come with a high risk of losing money rapidly due to leverage. 63% of retail investor accounts lose money when trading CFDs with this provider. You should consider whether you understand how CFDs work and whether you can afford to take the high risk of losing your money.
Stratos Trading Pty. Limited (www.fxcm.com):
Trading FX/CFDs carries significant risks. FXCM AU (AFSL 309763), please read the Financial Services Guide, Product Disclosure Statement, Target Market Determination and Terms of Business at www.fxcm.com
Stratos Global LLC (www.fxcm.com):
Losses can exceed deposits.
Please be advised that the information presented on TradingView is provided to FXCM (‘Company’, ‘we’) by a third-party provider (‘TFA Global Pte Ltd’). Please be reminded that you are solely responsible for the trading decisions on your account. There is a very high degree of risk involved in trading. Any information and/or content is intended entirely for research, educational and informational purposes only and does not constitute investment or consultation advice or investment strategy. The information is not tailored to the investment needs of any specific person and therefore does not involve a consideration of any of the investment objectives, financial situation or needs of any viewer that may receive it. Kindly also note that past performance is not a reliable indicator of future results. Actual results may differ materially from those anticipated in forward-looking or past performance statements. We assume no liability as to the accuracy or completeness of any of the information and/or content provided herein and the Company cannot be held responsible for any omission, mistake nor for any loss or damage including without limitation to any loss of profit which may arise from reliance on any information supplied by TFA Global Pte Ltd.
The speaker(s) is neither an employee, agent nor representative of FXCM and is therefore acting independently. The opinions given are their own, constitute general market commentary, and do not constitute the opinion or advice of FXCM or any form of personal or investment advice. FXCM neither endorses nor guarantees offerings of third-party speakers, nor is FXCM responsible for the content, veracity or opinions of third-party speakers, presenters or participants.

EUR USD - Bias: Bearish - limit orderBias: Bearish
Market Structure and Reasoning:
The EUR/USD has been in an overall downtrend in recent days, forming successive lower highs and lower lows across multiple timeframes. The 4-hour chart shows a clear bearish momentum with price recently breaking below key support levels. On the 1-hour timeframe, we can observe a series of bearish candles with minimal retracement, indicating strong selling pressure. The 15-minute chart confirms this bearish structure with price trading below previous support zones.
Trading Setup:
The price is currently hovering around the 1.0788 level, which appears to be a weak support that has been tested multiple times. The overall structure suggests potential for continued downside movement.
Entry: 1.0795 (Limit Order)
Look to enter on a retracement to the 1.0795 level, which was previous support and may act as resistance on a retest.
Stop Loss: 1.0830
Place stop loss above the recent swing high, limiting risk to 35 pips.
Take Profit (TP1): 1.0760
First target at the recent low, providing a favorable risk-reward ratio.
Extended Take Profit (TP2): 1.0730
Second target at the psychological level which should provide stronger support.
Order Type: Limit Order
Wait for price to retrace to the entry level rather than chasing the current move.
Alternative Scenario:
If price breaks above 1.0830 with conviction, the bearish bias would be invalidated. In that case, wait for a potential shift in market structure before considering new positions.
