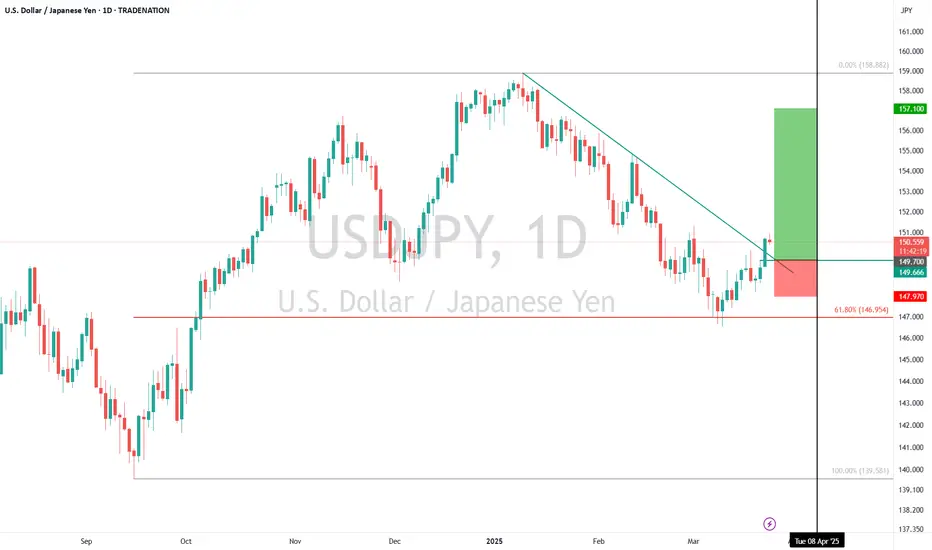
USDJPY Buy Setup – Breakout Confirmation & Seasonal TailwindTechnical: USDJPY has broken above a downtrend resistance line after finding support at the 61.8% Fibonacci retracement level at 146.95 . This breakout suggests the corrective phase may have ended, signaling potential for further upside. Pullbacks toward 149.70 (a retest of the broken trendline) present an attractive entry opportunity. Upside targets are 152.74 and 157.10 in the short to medium term. The setup is invalidated below 147.97 , with a break below 146.33 negating further bullish expectations.
Fundamental: Commercial selling of the Japanese Yen and renewed dollar purchases indicate a shift favoring USD over JPY, supporting the bullish technical outlook.
Seasonal: Over the past 25 years , USDJPY has risen 76% of the time between March 25 – April 8 , with an average gain of 1.04% .
Trade Idea:
Entry: On pullbacks toward 149.70
Stop Loss: 147.97 (or 146.33 for extended risk management)
Targets: 152.74 and 157.10
Disclosure: I am part of Trade Nation's Influencer program and receive a monthly fee for using their TradingView charts in my analysis.
USDJPY.1000.DUB trade ideas
Japan's Tariff Worries and BOJ Rate Hike HintsThe Japanese yen remained weak around 150.7 per dollar on Tuesday, near a three-week low, as the U.S. dollar gained strength. Trump's plan to impose tariffs on autos, pharmaceuticals, and other sectors raised concerns for Japan’s export-driven economy.
BOJ minutes from January showed officials remain open to future rate hikes depending on wage and inflation trends, with one member suggesting a possible increase to 1% in late fiscal 2025. Still, the BOJ kept rates steady at 0.5% last week, maintaining a cautious stance with global tensions.
Key resistance is at 151.70, with further levels at 152.70 and 154.00. Support stands at 147.00, followed by 145.80 and 143.00.

JPY/USD 4H Chart Analysis – Head & Shoulders BreakdownThis JPY/USD 4-hour chart showcases a Head & Shoulders (H&S) pattern, a well-known bearish reversal pattern signaling a potential downtrend after an extended bullish run. The breakdown of the neckline support and the trendline breakout are key confirmations of a shift in momentum, making this a high-probability trading setup.
📌 1️⃣ Understanding the Head & Shoulders Pattern
The Head & Shoulders pattern is a classic reversal structure that forms after a prolonged uptrend. It consists of three peaks:
Left Shoulder: The first peak forms as buyers push the price higher, followed by a pullback.
Head: The price rallies again, making a higher peak, but sellers start to gain strength, causing another pullback.
Right Shoulder: A lower high is formed as buying pressure weakens, signaling exhaustion of the uptrend.
This pattern is significant because it suggests that bullish momentum is fading and that a potential trend reversal is underway.
📌 2️⃣ Trendline Breakout – Bearish Confirmation
Before the formation of the Head & Shoulders, the market was in a strong uptrend, supported by a rising trendline (dashed black line).
The price respected this trendline multiple times, acting as dynamic support.
However, after the right shoulder formation, the price broke below the trendline, indicating that selling pressure is increasing.
A trendline breakout after a reversal pattern strengthens the bearish case, increasing the likelihood of further downside movement.
📌 3️⃣ Key Resistance & Support Levels
Understanding the key price levels is essential for determining trade entries, stop-loss placements, and target zones.
📍 Resistance Zone (Stop-Loss Area):
0.006776 is the recent high and a key resistance level where sellers previously stepped in.
If the price reclaims this level, the bearish thesis could be invalidated, making it a logical place to set a stop-loss.
This level also aligns with the Head of the pattern, further reinforcing it as a strong supply zone.
📍 Support Level (Neckline Zone):
The neckline (horizontal support zone) was previously holding as support but has now been broken.
If the price pulls back to this area and rejects it, it could serve as a strong entry point for short trades.
A confirmed retest of the neckline would validate the breakdown, increasing the likelihood of a further decline.
📍 Bearish Target (Profit-Taking Zone):
The price is projected to decline toward 0.006457, which is derived by measuring the height of the Head & Shoulders pattern and projecting it downward.
This level also coincides with historical support, making it a strong take-profit area.
If bearish momentum continues, further downside targets may come into play.
📌 4️⃣ Trading Plan – Execution Strategy
This setup provides a clear structure for planning a high-probability short trade.
✅ Entry Strategy:
Option 1 (Aggressive Entry): Enter a short trade immediately after the breakdown of the neckline.
Option 2 (Conservative Entry): Wait for a retest of the broken neckline as resistance before entering a short position.
🚀 Stop-Loss Placement:
Above 0.006776 (recent resistance & Head of the pattern).
Ensures protection from a potential false breakout.
🎯 Take-Profit Strategy:
First target: 0.006457 (measured move of the pattern).
Extended target: Lower psychological support if momentum continues downward.
📌 5️⃣ Market Sentiment & Additional Considerations
While this technical setup suggests a bearish outlook, traders should also consider:
🔸 Fundamental Factors: Economic data releases, interest rate decisions, and geopolitical events can impact market sentiment.
🔸 Volume Confirmation: A high-volume breakout strengthens the bearish bias, whereas weak volume may indicate a potential fake-out.
🔸 RSI & Momentum Indicators: Checking if the RSI is in overbought territory or showing bearish divergence can provide further confidence in the setup.
🔸 Psychological Levels: Traders should watch for price reactions near key round numbers, as these often act as support/resistance.
📌 6️⃣ Conclusion – Why This Setup is High Probability
This JPY/USD 4H chart presents a well-defined Head & Shoulders pattern, a classic reversal setup that indicates a shift from bullish to bearish momentum. The trendline breakout and neckline breach reinforce the bearish bias, making this a high-probability short trade opportunity.
💡 Key Takeaways:
✅ A confirmed trendline break + H&S pattern indicates a bearish reversal.
✅ Watch for a neckline retest as a potential short entry.
✅ Bearish target: 0.006457 with stop-loss above 0.006776.
✅ Consider fundamental factors & market sentiment for additional confirmation.
🔽 Overall Bias: Bearish 📉
#JPYUSD #ForexTrading #HeadAndShoulders #PriceAction #TradingSetup #TrendReversal

USD/JPY sort order idea. just copy and paste this and see the reUSD/JPY sort order idea. just copy and paste this and see the result.

USD/JPY increaseI believe that increase USD/JPY pair. Based on the analysis, you can enter a buy position on USD/JPY with a small risk margin!


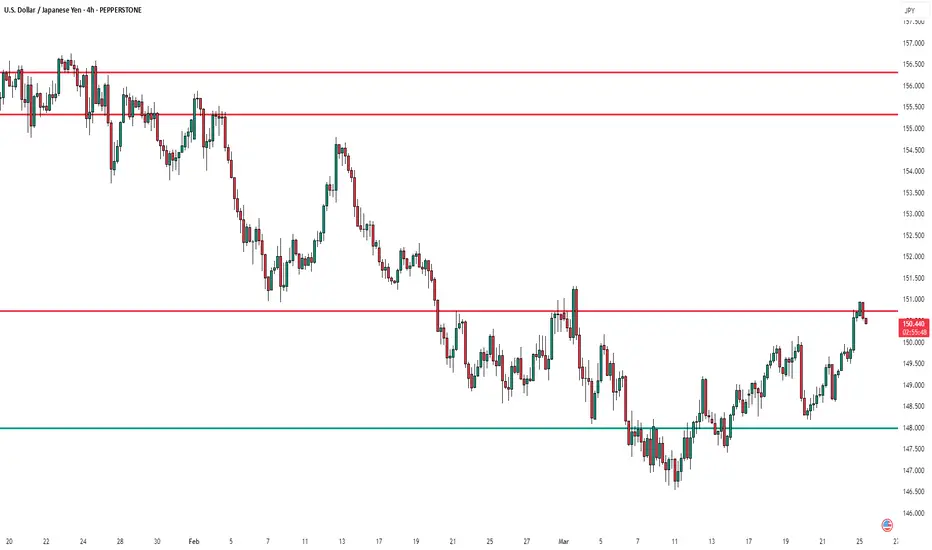
USD/JPY – Key Resistance Tested After Strong RallyThe USD/JPY pair has been in a steady uptrend after finding support near the 147.800 level, leading to a breakout above key levels. The price is currently testing a significant resistance zone around 150.500, where previous rejections occurred.
Key Levels to Watch:
📌 Resistance: 150.500 (current test), 155.500, 156.500
📌 Support: 147.800
If buyers sustain momentum above 150.500, we could see a move toward the 155.500 - 156.500 zone. However, rejection at this level could trigger a pullback toward 147.800 support.
Traders should monitor price action at this level to determine whether a breakout or rejection occurs.
What are your thoughts? Will USD/JPY break higher, or are we due for a pullback? 🚀📉
USDJPY Resistance ahead !!! Cool down.USDJPY is facing the resistance in the uptrend channel has reached higher high of the channel and will cool down today.

USDJPY Weekly UpdatePrice gave us a bullish channel on the 1H timeframe and has rejected on our resistance trendline thus gives a clear indication of where price might trend to from here.

USD/JPY (30M) Analysis – 25-03-2025📊 USD/JPY (30M) Analysis – 25-03-2025
📉 Current Price: 150.547
🟢 Demand Zones (Support):
149.851 - 149.955 – First potential reversal zone.
149.500 - 149.537 – Key support area.
🔴 Supply Zone (Resistance):
150.600 – Recent high acting as resistance.
📌 Market Outlook:
Price is rejecting the supply zone and showing signs of reversal.
Scenario 1: If price breaks below 150.500, expect a drop towards 149.851 (TP1) and 149.500 (TP2).
Scenario 2: If price holds above 150.500, bullish continuation may occur.
⚡ Trade Setup:
🔻 Sell Setup: If price breaks 150.500 with confirmation.
🎯 TP1: 149.851
🎯 TP2: 149.500
🛑 SL: Above 150.650
#FXFOREVER #FXF #USDJPY #Forex #SmartMoney #PriceAction

Fundamental Market Analysis for March 25, 2025 USDJPYThe Japanese yen (JPY) declined against its US counterpart for the fourth consecutive day, taking the USD/JPY pair to 151.000, or a three-week high, during Tuesday's Asian session. Sentiment regarding global risk is being fuelled by hopes that US President Donald Trump's so-called retaliatory tariffs will be narrower and less harsh than originally anticipated. In addition, optimism over a possible peace agreement between Russia and Ukraine, and reports that China is considering including services in a subsidy programme to boost consumption, have further bolstered investor confidence, undermining the safe-haven yen.
Meanwhile, minutes from the Bank of Japan's (BoJ) January meeting showed that policymakers discussed under what conditions the central bank should raise interest rates further. However, the minutes gave no clues as to the likely timing of the BoJ's next move and failed to make much of an impression on the JPY bulls. The Bank of Japan's hawkish outlook is at odds with the Federal Reserve's (Fed) forecast of two 25 basis point rate cuts before the end of this year. This could deter dollar bulls from making aggressive bets and support a low-yielding yen, which should limit the upside of USD/JPY.
Trade recommendation: BUY 151.000, SL 150.200, TP 152.150

USD/JPY TRENDLINE BREAK OUT BUY ZONETrade Setup Rationale
Entry Point: 149.500
Likely triggered by a bullish breakout above a descending trend line (resistance). Entry might be near the breakout level, assuming the price retests the trend line (now support).
Example: If the breakout occurs around 150.00, a pullback to the 150.00-151.00 zone could serve as the entry point.
Take Profit (TP) Targets
TP1: 152.60 (near prior resistance or a measured move).
TP2: 154.80 (extension of the bullish momentum, possibly a multi-month high).
Stop Loss (SL)
148.25 (placed below the trend line/swing low to protect against false breakouts).
Risk-Reward Considerations
Scenario: Entry at 150.00, SL at 148.25 (175 pips risk).
TP1 (152.60): +260 pips (1:1.5 risk-reward).
TP2 (154.80): +480 pips (1:2.7 risk-reward).
Note: Wider stops may suit swing traders, but ensure alignment with your strategy.
Key Factors to Validate
Trend Confirmation: Confirm bullish momentum with indicators (e.g., RSI > 50, MACD crossover).
Fundamentals: Monitor BoJ intervention risks or Fed policy shifts impacting USD/JPY.
Price Action: Watch for a clean breakout with volume.

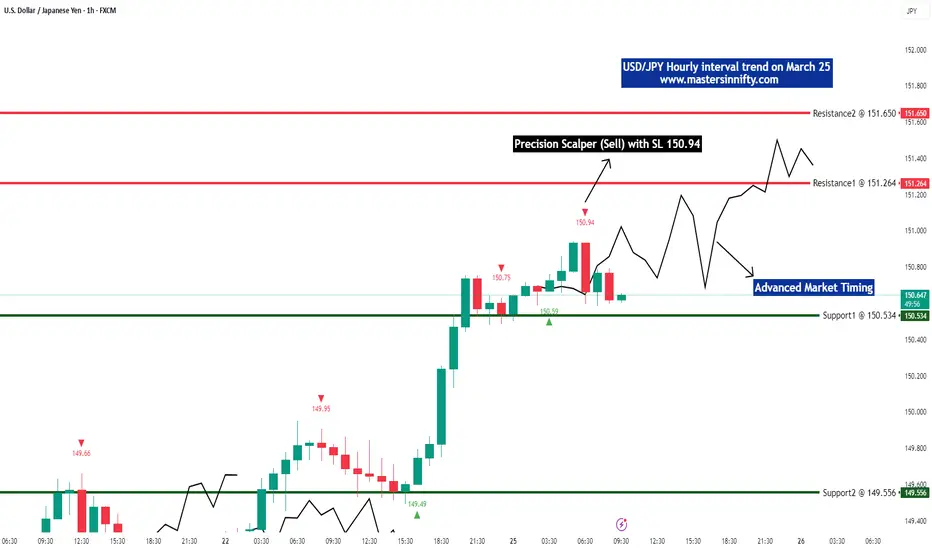
USD/JPY hourly trend on March 25thThis Forex pair is still bullish. Support at 150.534 and 149.556 and Resistance at 151.264 and 151.650. Our "Precision Scalper" indicator has confirmed Sell with a SL @ 150.94.
Elliott Wave View: USDJPY Rallying in Double ZigzagShort Term Elliott Wave view in USDJPY suggests that rally from 3.11.2025 low is in progress as a double zigzag structure. A double zigzag structure is a 7 swing double three Elliott Wave structure. There are 2 sets of ABC zigzag structure connected together, thus why the name is double zigzag. Up from 3.11.2025 low, wave A ended at 149.2 and wave B ended at 147.4. Wave C higher ended at 150.1 and this completed the first zigzag structure and end wave (W) in higher degree as the 45 minutes chart below illustrates. Pullback in wave (X) ended at 148.1 and pair has resumed higher in wave (Y).
Internal subdivision of wave (Y) is unfolding as another zigzag structure. Up from wave (X), wave ((i)) ended at 149.66 and wave ((ii)) pullback ended at 148.6. Up from there, pair is nesting higher in wave ((iii)). Wave (i) ended at 149.95 and wave (ii) pullback ended at 149.48. Wave (iii) higher ended at 150.94. Expect pullback in wave (iv) to find support for more upside. Near term, as far as pivot at 148.16 low stays intact, expect dips to find buyers in 3, 7, or 11 swing for further upside.

USD/JPY(20250325)Today's AnalysisToday's buying and selling boundaries:
150.25
Support and resistance levels:
151.62
151.11
150.78
149.73
149.40
148.89
Trading strategy:
If the price breaks through 150.78, consider buying, the first target price is 151.11
If the price breaks through 150.25, consider selling, the first target price is 149.73

USDJPY LongUSDJPY is now net long on the regression break.
I am considering my options and EAs to use on this pair.

Order Block @150.93 |Sell SignalPrice was in an overall bearish trend but not its retracing to mitigate an order block that created a break of structure. I'll wait for a bearish confirmation on a lower time frame for entry.

USDJPY LONGHi traders, watch as I forecast the structure and price of USDJPY
-1st impulse in motion
-Entries after pullback
-Bullish momentum
-154.000 reaction level
Please don't forget to share your insights, leave a like and follow me for more!


USDJPY THE BULLS ARE IN 500 PIPS TO BE MADE USD/JPY falls from near 150.00 after Japanese commentary
USD/JPY turns south after facing rejection just shy of 150.00 in the Asian session on Monday. The pair pares gains following the commentaries from Japanese Finance Minister Kato and BoJ policymaker Uchida. Hopes of the next BoJ meeting being the 'live one' and weaker US Dollar also cap the pair's upside.

USDJPY INVERTED HS PATTERN BREAKOUT 350 PIPS CAN BE EXPECTED
In the event that a head and shoulders pattern develops in USDJPY, please refrain from risking more than 2% of your capital investment. It is crucial to perform your own research before making any trading decisions. To ensure the pattern's accuracy, it is advisable to use the premium version of the TradingView Auto Chart Indicator, as the free version may not offer dependable indicators for this pattern. While the free version can be used to check the auto chart pattern, it may not display it correctly. Those with access to the premium version are invited to share their observations in the comments section.
Thank you All

BUY opportunities on USD JPYRR 1:1 - conservative
RR 1:2 - aggresive
Please do not trade as my analysis might be incorrect.
I encourage constructive feedback.
If you did trade, make sure the drawing is respected, don't use exact values as they might differ from a broker to another.
Explanations:
MIN - last minimum point
MAX - last maximum point
BOS - break of structure
SMS - shift in market structure
SL - stop loss
TP - take profit
RR - risk reward
OB - order block
OB (15) - order block (based on M15) timeframe

USDJPY Bullish Breakout!
HI,Traders !
USD-JPY was trading
Beneath the falling resistance
Line but now we are seeing a
Bullish breakout so we are
Now locally bullish biased
And we will be expecting a
Further bullish move up !
Comment and subscribe to help us grow !
