USD/JPY Bullish Outlook – Targeting Key Resistance at 150.155USD/JPY Technical Analysis – Bullish Outlook Toward Resistance
Chart Insights:
The price is currently in a recovery phase after a significant drop.
A Fair Value Gap (FVG) zone has been identified, suggesting a potential pullback before further movement.
The target point aligns with the resistance level around 150.155, which acts as a key supply zone.
Potential Scenario:
Price may retrace into the FVG zone around 148.704 – 148.956.
A bullish rebound from this level could drive price toward the resistance at 150.155.
If price reaches the resistance level, further rejection or continuation will depend on market conditions.
Key Levels:
Support Zone: 148.167 – 148.315
FVG Area: 148.704 – 148.956
Resistance Zone: 150.007 – 150.155 (Target area)
Conclusion:
The current structure suggests a bullish bias if price respects the FVG zone for a push higher. However, a break below the FVG could signal further downside movement.
USDJPY.1000.DUB trade ideas

USD/JPY Premium Trade Setup | High-Probability Short OpportunityKey Elements in the Chart:
Uptrend Channel: The price was moving inside an ascending channel but recently broke downward.
Resistance Zone: Marked near the 150.000 level, indicating a key rejection area where sellers are strong.
Sell Zone: A potential short-selling opportunity is identified around 149.300 after a breakdown from the channel.
Support Zone: Located around 148.500, where the price may find temporary buying interest.
Target: The final target for the bearish move is near 147.000, suggesting a further downside potential.
Trading Idea:
Bias: Bearish (selling opportunity after a trendline break)
Entry: Near 149.300 (confirmed rejection)
Target: 147.000
Risk Management: Stop-loss can be placed above the resistance area.
This setup suggests that USD/JPY may continue its downward move after failing to sustain the uptrend. Traders should watch for confirmation signals before entering.

Bearish reversal off pullback resistance?USD/JPY is rising towards the resistance level that is a pullback resistance and could reverse from this level to our take profit.
Entry: 149.68
Why we like it:
There is a pullback resistance level which is a pullback resistance.
Stop loss: 150.16
Why we like it:
There is a pullback resistance level that line sup wit the 138.2% Fibonacci extension.
Take profit: 148.96
Why we like it:
There is a pullback support level.
Enjoying your TradingView experience? Review us!
Please be advised that the information presented on TradingView is provided to Vantage (‘Vantage Global Limited’, ‘we’) by a third-party provider (‘Everest Fortune Group’). Please be reminded that you are solely responsible for the trading decisions on your account. There is a very high degree of risk involved in trading. Any information and/or content is intended entirely for research, educational and informational purposes only and does not constitute investment or consultation advice or investment strategy. The information is not tailored to the investment needs of any specific person and therefore does not involve a consideration of any of the investment objectives, financial situation or needs of any viewer that may receive it. Kindly also note that past performance is not a reliable indicator of future results. Actual results may differ materially from those anticipated in forward-looking or past performance statements. We assume no liability as to the accuracy or completeness of any of the information and/or content provided herein and the Company cannot be held responsible for any omission, mistake nor for any loss or damage including without limitation to any loss of profit which may arise from reliance on any information supplied by Everest Fortune Group.

USDJPY - Sell Trade SetupLooking to go short. Waiting for slight pullback to upside to then sell.
Leave a comment below, let me know what you think. Share with friends. Check out my profile for more awesome trade plans and setups
Trade Safe - Trade Well.
~Michael Harding CEO at LEFTURN

Idea for a set upUSD/JPY falls back as the US Dollar gains on the Fed’s support for a restrictive policy stance.
US President Trump’s tariff policies are expected to boost US inflation and weigh on economic growth.
Japan’s National CPI cooled down in February.
The USD/JPY pair gives up entire intraday gains after facing selling pressure around 149.60 and drops to near 148.60 during North American trading hours on Friday. The asset drops as the US Dollar (USD) gains, with the US Dollar Index (DXY) rising to near 104.00.
The Greenback attracts bids as the Federal Reserve (Fed) is unlikely to cut interest rates in the near term. On Wednesday, Fed Chair Jerome Powell stated that they are not in a hurry to cut interest rates amid “unusually elevated” uncertainty over the United States (US) economic outlook under the leadership of President Donald Trump. Powell also warned that Trump’s tariff policy tends to push growth lower and inflation higher.


It's time again for a retrace to the upsideWhen the USDJPY is in oversold conditions, it typically retraces to the upside.
Right now, it appears to be one of those moments, making a move to the upside very likely.

USDJPY TRADE SETUPWait for retest the key level and multiple wick rejection and bearish momemtum candle then take a trade for Sell otherwise skip this setup

USDJPY BUY SETUPThe USD/JPY daily chart shows a descending channel pattern, with price recently testing the lower boundary and rebounding. Key resistance levels are marked as TP1 (around 155.000), TP2 (approximately 162.327 - 165.941), and TP3 (near 178.490 - 178.635), indicating potential bullish targets. The price is currently hovering around 149.300, with a possible breakout above the channel signaling further upside movement. The marked support levels around 146.481 - 144.946 suggest a critical zone for risk management.
Risk Management Disclaimer:
Trading in financial markets involves significant risk and may not be suitable for all investors. The analysis provided is for informational purposes only and does not constitute financial advice. Past performance is not indicative of future results. Always conduct your own research, use proper risk management strategies, and consult with a professional financial advisor before making trading decisions. Never trade with money you cannot afford to lose.

Maybe...According to my analysis, we're very likely to see this.
What are your thoughts on this?
What are your thoughts on this?

USDJPY – Major Symmetrical Triangle Breakdown | Retest PlayUSDJPY has recently broken down from a large symmetrical triangle pattern visible on the 4H timeframe. After a prolonged uptrend that formed the triangle structure, price decisively broke below the lower support line, indicating a shift in momentum from bullish to bearish.
📊 Technical Breakdown
1. Symmetrical Triangle Breakdown
Price formed a classic symmetrical triangle pattern over several months.
A strong bearish breakout occurred from the lower trendline, signaling a potential reversal.
The projected measured move target from this breakdown points toward 141.526, representing a 6.5% decline.
2. Retest Zone
Price has pulled back to retest the broken triangle trendline from below.
This bearish retest setup is a textbook confirmation of resistance turning from previous support.
The current consolidation suggests the market is gathering liquidity before a potential next leg down.
3. Market Structure & Momentum
Lower highs and lower lows are now forming post-breakdown, confirming a bearish structure.
A clear rejection from the retest zone around the 151.500–152.000 level would further validate the short thesis.
🧠 Trade Idea
Entry Zone: On confirmation of rejection near the retest (~151.5 area)
Target : 141.526 (Measured move from triangle breakdown)
Stop Loss : Above the triangle high or above the recent swing (~153.00+)
Risk-Reward : High probability play based on pattern + structure shift
⚠️ Key Watch Levels
Resistance: 151.5–152.0 (triangle retest)
Support/Target: 141.5 (measured move)
Break above 153.0 will invalidate this bearish bias.

HERE IS USDJPY TRIANGLE PATTERNHello Guys Here Is Chart Of USDJPY in 4-H AT
Entry Level: SELL Around 148.800
Resistance: 149.300
Target Will Be : 146.800
This analysis assumes the price respects the Triangle Pattern.

DOLLAR/YEN LAST WEEK OF THE 1st 1/4The Bank of Japan (BOJ) raised its interest rate to 0.5% in March 2025, marking a significant policy shift.
This decision was made unanimously during the March 18-19, 2025, Monetary Policy Meeting.
It seems likely that this move reflects the BOJ's confidence in Japan's economic recovery and stable inflation around 2%.
The U.S. Dollar Index (DXY) as of March 21, 2025, is around 104.0880, showing stability.
It seems likely that the Bank of Japan's (BOJ) rate hike on March 19, 2025, had minimal impact, with the dollar slightly strengthening afterward.
Research suggests the dollar's strength is driven by U.S. economic growth and monetary policy differences, despite global rate changes.

USDJPY 1H#USDJPY 1H
Last week, the target of 150 was seen with high accuracy.
The analysis of the market is bearish with a target of 147.8
and will be analyzed if it consolidates above 149.4.
Beware of fake moves and market deception

Weekly FOREX Forecast Mar 24-28: Buy CAD, CHF, JPY vs USD!This is an outlook for the week of March 24 - 28th.
In this video, we will analyze the following FX markets:
USD Index
EUR
GBP
AUD
NZD
The USD Index is entering a Daily +FVG, which is nested in a Weekly +FVG. This is a bearish indication for the USD, which is a potential bullish situation for EURUSD, GBPUSD, AUDUSD and NZDUSD. This will be potentially bearish for the USDCAD, USDCHF, and USDJPY. Wait for the market structure shift going in the direction of your TP, and enter on the pullback.
Enjoy!
May profits be upon you.
Leave any questions or comments in the comment section.
I appreciate any feedback from my viewers!
Like and/or subscribe if you want more accurate analysis.
Thank you so much!
Disclaimer:
I do not provide personal investment advice and I am not a qualified licensed investment advisor.
All information found here, including any ideas, opinions, views, predictions, forecasts, commentaries, suggestions, expressed or implied herein, are for informational, entertainment or educational purposes only and should not be construed as personal investment advice. While the information provided is believed to be accurate, it may include errors or inaccuracies.
I will not and cannot be held liable for any actions you take as a result of anything you read here.
Conduct your own due diligence, or consult a licensed financial advisor or broker before making any and all investment decisions. Any investments, trades, speculations, or decisions made on the basis of any information found on this channel, expressed or implied herein, are committed at your own risk, financial or otherwise.

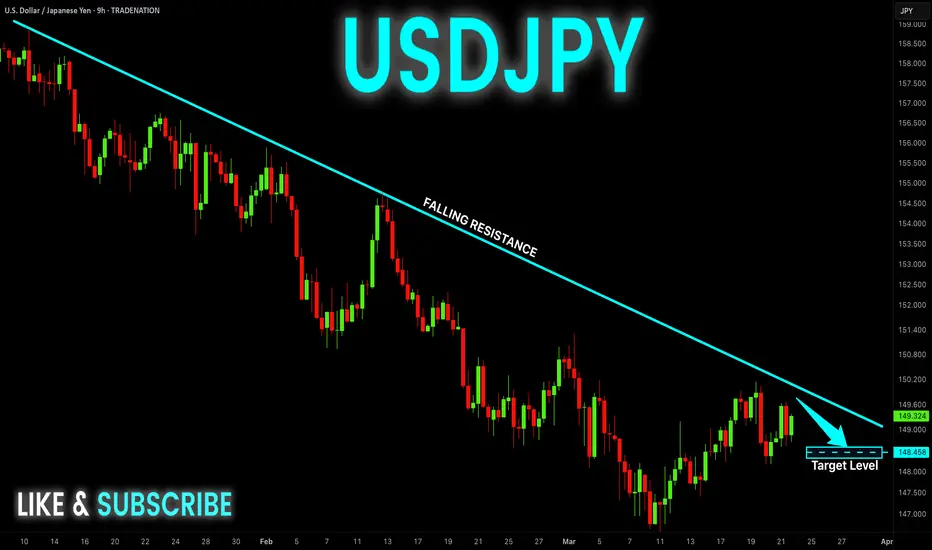
USD-JPY Move Down Ahead! Sell!
Hello,Traders!
USD-JPY is trading in a
Downtrend below the falling
Resistance line and the pair
Will soon hit the resistance
From where we will be
Expecting a further move down
Sell!
Comment and subscribe to help us grow!
Check out other forecasts below too!
Disclosure: I am part of Trade Nation's Influencer program and receive a monthly fee for using their TradingView charts in my analysis.
USDJPY 15 Minutes Time Frame look 1629SGT 21032025Closer look at how the USDJPY's entry setup look like.
1630SGT 21032025

JPY/USD Technical Analysis - Head & Shoulder Chart Bearish Move1️⃣ Chart Type & Timeframe:
Market: Japanese Yen (JPY) / U.S. Dollar (USD)
Timeframe: 1-hour chart (H1)
Platform: TradingView
This is an intraday chart used by traders to identify short-term price action and trend reversals.
2️⃣ Identifying the Key Chart Pattern – Head & Shoulders
The dominant pattern on this chart is the Head & Shoulders (H&S), a well-known bearish reversal signal that forms after an uptrend. Let’s break it down:
A. Formation of the Pattern
Left Shoulder: The price forms a peak, then retraces down to a support level.
Head: A higher peak is formed, followed by another decline, indicating buyers are losing control.
Right Shoulder: The price attempts another rise but fails to reach the previous high, showing bearish momentum is increasing.
B. Neckline & Trendline Support
The neckline acts as a key support level. A break below it confirms the bearish move.
The trendline, which has been supporting price action for a while, is also at risk of breaking.
3️⃣ Key Support & Resistance Levels
Resistance Level (0.006750 - 0.006819):
This is the previous high area where sellers are active. A stop-loss is placed above this level.
Support Level (0.006567 - 0.006468):
Key demand zones where buyers may step in. These are the take profit (TP) levels.
4️⃣ Price Action & Expected Movement
📉 Bearish Outlook – A potential breakdown from the neckline and trendline would confirm further downside.
If price breaks the trendline, a pullback to retest resistance is expected before dropping further.
Take Profit (TP) 1: 0.006567 – Minor support, possible bounce.
Take Profit (TP) 2: 0.006468 – Stronger support, deeper correction possible.
🚨 Stop Loss: Above 0.006819, just beyond the right shoulder and all-time high (ATH).
5️⃣ Trading Strategy & Execution
💡 Entry Strategy:
Sell Breakout Entry: Short the market when the neckline/trendline is broken with strong volume.
Retest Confirmation: Wait for a pullback to the broken trendline and enter when price rejects it.
📌 Risk Management:
Risk-to-Reward Ratio: 1:2 or higher for an optimal setup.
Use trailing stop-loss to secure profits if TP1 is hit.
6️⃣ Market Psychology & Smart Money Behavior
The Head & Shoulders pattern reflects buyer exhaustion and increased seller strength.
Smart money often enters after the breakdown when weak hands get stopped out.
Conclusion: Trade with Confidence!
This chart presents a high-probability bearish trading opportunity based on a textbook Head & Shoulders formation, support/resistance dynamics, and trendline analysis. A disciplined approach with risk management will ensure better execution.
📉 Final Verdict: Bearish Breakdown Expected – Sell the Retest!
🔥 Tags for TradingView Idea:
#JPYUSD #ForexTrading #HeadAndShoulders #TechnicalAnalysis #BearishReversal #SmartMoney #PriceAction #RiskManagement #TradingSetup #TrendlineBreak

USDJPY SELSExpecting price to take out the structural liquidity then sell off from the QMR supply block

A POSSIBLE HEAD & SHOULDER PATTERN IN FORMATION?Price seems to be in consolidation phase as a reversal pattern (head and shoulder ) is currently in formation. We’re likely to see the right shoulder pattern form in months coming. Keep a close watch as there could be a medium term sell in USDJPY this year .

USDJPYUSD/JPY Fundamental Analysis for Next Week
Based on recent developments and market sentiment, here’s a breakdown of key drivers and potential price action for USD/JPY in the coming week:
Key Drivers
Fed Policy and US Economic Data:
Fed Rate Cuts: Markets expect two Fed rate cuts in 2025, which could weaken the USD. However, the Fed’s cautious stance (e.g., Powell’s emphasis on “unusually elevated uncertainty”) may limit immediate USD declines.
US Leading Economic Index (LEI): A forecasted rise to -0.2% (from -0.3%) could signal stabilizing growth, supporting the USD.
BoJ Policy and Japanese Data:
BoJ Rate Hikes: The BoJ maintained rates at 0.5% but faces pressure to hike further if inflation persists. Hawkish rhetoric from Governor Ueda could strengthen the JPY.
Japanese Inflation: February’s core CPI rose 3.0% YoY, down from 3.2% in January, reducing urgency for immediate BoJ action.
Geopolitical and Trade Risks:
Trump’s Tariffs: Reciprocal tariffs on April 2 could slow global growth, boosting safe-haven demand for the JPY.
Ukraine Peace Talks: Optimism about US-Russia negotiations may ease risk aversion, pressuring JPY.
Yield Differentials:
Narrowing US-Japan Yield Spreads: The downward trajectory of US-Japan yield spreads (e.g., 10-year Treasuries vs. JGBs) supports a medium-term USD/JPY downtrend.
Bearish Case: A break below 148.471 could target 146.499 driven by JPY safe-haven demand or BoJ hawkishness.
Bullish Case: A rally above 150.1-149.496 might test 151.8, but faces resistance from narrowing yield spreads and Fed dovishness.
BoJ Policy Guidance: Any hints of delayed rate hikes may weaken JPY, supporting USD/JPY.
Tariff Implementation: Markets will monitor Trump’s April 2 tariff deadline for trade war escalation risks.
Conclusion
USD/JPY is likely to remain volatile, with bearish bias dominating due to:
JPY Safe-Haven Demand: Geopolitical risks and trade tensions.
Narrowing Yield Spreads: Reduced USD appeal as US-Japan rate differentials shrink.
BoJ Policy Uncertainty: Hawkish rhetoric vs. delayed action.

Oscillator from Williams and stochastic This custom oscillator is designed to provide dynamic support and resistance levels based on price action, the highest and lowest prices, and an exponential moving average (EMA). It calculates four different lines:
1. Price to Midline: This line shows the ratio of the current price to the midline (average of high and low prices).
2. High to Midline: This line represents the ratio of the highest price to the midline.
3. Low to Midline: This line represents the ratio of the lowest price to the midline.
4. EMA to Midline: This line tracks the ratio of the EMA (Exponential Moving Average) to the midline, providing a dynamic view of price action.
These four lines help identify key levels of overbought or oversold conditions, potential trend reversals, and dynamic support/resistance zones. The oscillator can be used to assess market strength and trend direction.
The period for calculating the high/low, as well as the EMA period, can be customized in the settings to adjust the sensitivity to market conditions.

Expect a Bearish Move from around 152.449 on USDJPY The USDJPY is approaching a premium level of price around 152.449.... which could be a Bearish sentiment and a opportunity for traders so therefore I'm going short when price gets to 152.449.
