USDJPY.1000.DUB trade ideas
JPY/USD Breakout from Falling Channel – Bullish Trading SetupOverview of the Chart:
The Japanese Yen (JPY) against the U.S. Dollar (USD) 1-hour chart showcases a well-defined market structure, transitioning from a downtrend within a falling channel to a breakout with bullish momentum. The chart highlights critical support and resistance levels, a confirmed breakout, and a forecasted price movement that could indicate further bullish continuation.
This analysis will break down the chart patterns, technical indicators, and potential trade setups, providing a professional outlook on price action behavior.
Technical Breakdown of the Chart
1. Falling Channel Pattern – Downtrend Phase
The price had been trading within a descending channel, marked by two parallel trendlines (blue lines), indicating a controlled downtrend.
A falling channel is a bullish reversal pattern, as it signals that bearish momentum is weakening.
Within the channel, price action consistently created lower highs and lower lows, adhering to the structure of the pattern.
The red dashed trendline inside the channel acted as a dynamic resistance, rejecting price movements multiple times before the breakout.
📌 Key Observation: The falling channel pattern suggests accumulation, where selling pressure gradually diminishes, paving the way for a bullish reversal.
2. Support Zone & Bullish Breakout
The price eventually reached a strong horizontal support level (highlighted blue zone at the bottom), which acted as a critical demand area.
This support level had previously led to strong rebounds, making it a significant zone for potential reversals.
Bullish breakout confirmation:
A strong bullish candle closed above the upper boundary of the channel, breaking the trendline resistance.
The breakout suggests a shift in market structure from a downtrend to an uptrend, as buyers regained control.
The price has now moved above the previous resistance, confirming the bullish momentum.
📌 Key Takeaway: The breakout is a strong signal that sellers have lost control, and a potential bullish trend could emerge.
3. Resistance Zone – Key Barrier for Buyers
The next area of interest is the resistance level (highlighted in a blue rectangular zone).
This level has historically acted as a strong supply zone, where price previously struggled to break through.
If the price manages to sustain above this level, it would confirm bullish continuation toward higher price targets.
📌 Technical View: If buyers break past this resistance, it could lead to a strong bullish rally, reinforcing the new uptrend.
4. Target Projection & Forecasted Price Movement
The chart outlines a forecasted bullish path using a zigzag projection (black lines). Here’s the expected price action:
Short-Term Movement:
Price might face temporary resistance near the blue resistance zone.
A minor pullback or consolidation in this area is expected before further movement.
Retest of Support:
If price pulls back, it could retest the broken channel resistance or the support zone.
A successful retest and bounce would validate the strength of the breakout.
Bullish Continuation:
If the resistance zone is broken, price is likely to continue toward the target level of 0.006842, a previous swing high.
This level acts as the final upside target based on historical resistance levels.
📌 Key Insight: The market structure suggests that price will follow a higher-high, higher-low pattern, which is characteristic of an uptrend.

USDJPYSell USDJPY
ENTRY : 0.58759
SL : 0.58755
TP : 0.58791
Stop loss only 4 PIPS. Take profit is 8 times greater than your risk.
Is it gonna work!?

Dollar Weakens Post-Fed, Lifting Yen Beyond 148.5The yen strengthened past 148.5 per dollar, rising for a second session as the dollar weakened after the Fed reaffirmed two rate cuts this year. Fed Chair Powell downplayed Trump’s tariffs as short-lived. The BoJ kept rates at 0.5% on Wednesday, adopting a cautious stance amid global risks, especially US tariffs. It also emphasized monitoring forex markets and their impact on the economy.
Key resistance is at 150.30, with further levels at 152.00 and 154.90. Support stands at 147.00, followed by 145.80 and 143.00.

USDJPYKey Levels:
Support Levels:
147.710 – First support zone (potential buy area).
147.230 – Stronger support level where price may react if it continues downward.
Resistance Levels:
149.500 – Key resistance level if the price reverses bullish.
Trade Setup:
A short position is anticipated with entry after a pullback towards a minor FVG.
Take Profit: Near 147.710 or deeper at 147.230.
Stop Loss: Likely above the broken trendline or at a key resistance zone (149.500).
A long position could be considered at 147.710 or 147.230 if price shows bullish signals.

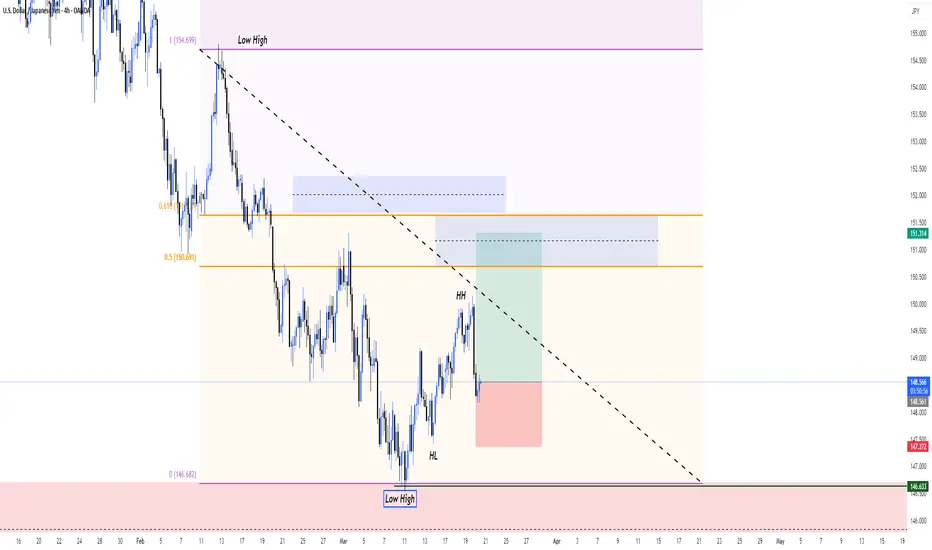
USDJPY SHORT - long term downtrend continuationThe white line on the chart is a path drawn from the daily chart, we have had a nice correction to the green line marked on the chart.
Expecting a retest of the level marked by the red line before a day trade short running down to the previous low created on March 11th.
If it breaks back in to the zone marked by the red and green lines, then I wouldn't take the trade but for now all signs show a continuation of the downward trend.

Fundamental Market Analysis for March 20, 2025 USDJPYThe Japanese yen (JPY) attracted buyers for the second consecutive day and strengthened to a new one-week high against its US counterpart during the Asian session on Thursday. Expectations that strong wage growth could boost consumer spending and contribute to higher inflation give the Bank of Japan (BoJ) room to raise interest rates further. This has led to a recent sharp narrowing of the rate differential between Japan and other countries, which continues to support the low-yielding yen.
In addition, uncertainty over US President Donald Trump's trade policy and its impact on the global economy, as well as geopolitical risks and the political crisis in Turkey, are contributing to inflows into the Yen. The US Dollar (USD), on the other hand, is struggling to gain meaningful momentum amid increased economic uncertainty amid US President Donald Trump's trade tariffs. This, in turn, is weighing on the USD/JPY pair and contributing to the intraday decline.
However, interest rate differentials, the Bank of Japan's loose monetary policy, the trade balance differential and global market sentiment put pressure on the Japanese yen. The further direction of the USD/JPY pair lies on the upside.
Trading recommendation: BUY 148.400, SL 147.600, TP 150.100

Charting the Path Forward: Key Levels to WatchPrevious Analysis: Successful Bullish Breakout
In our previous analysis, we identified a Falling Wedge pattern accompanied by bullish divergence, forecasting a breakout above 147.807. The price hit our target, confirming the bullish momentum and reaching key Fibonacci levels.
What’s Next:
Upon analyzing the chart, we observe that price has found support at 147.535 after a pullback during the American session. We anticipate the price to reach our first target, and after consolidation and a possible pullback, we expect to hit our second target near the upper line of the channel.
However, if the price declines from the first target and breaches support at 147.535, the next key support level is at 146.306.
Remember to follow your risk management strategies to protect your capital.

USDJPY BEARISH CHART ANALYSIS IN 1-HHello Guys Here Is Chart Of USDJPY in 1-H AT
Entry Level: SELL Around 149.800
Resistance: 150.100
Target Will Be : 148.500
If USDJPY breaks upper resistance level, Then It went to go up more and setup invalid

USD/JPY Trend Next Week - Continue Downtrend?🔔🔔🔔USD/JPY news:
🔆 Japan's largest labor union group, Rengo, secured an average wage increase of 5.46%, the highest since 1991, surpassing last year's initial figure of 5.28%. However, the raise fell short of expectations, as union members had sought a 6.09% increase. Given this outcome, the Bank of Japan is unlikely to tighten monetary policy beyond what the market has already priced in, which weighs on the yen. The swaps market continues to reflect expectations of less than 50 basis points of rate hikes over the next year.
🔆 On the other hand, the U.S. dollar remains under pressure following weak economic data, particularly the CPI and PPI reports, which have heightened concerns about a potential recession. This increases the likelihood that the Federal Reserve may cut interest rates sooner than previously expected at the end of the year. Additionally, growing uncertainty surrounding U.S. tax policies are adding further downside risks to the dollar.
Personal opinion:
🔆USD/JPY will maintain a downtrend in the near future after the previous basic economic news. Unless there is good news for the Dollar, then we will consider the possibility of a bullish reversal
🔆 Technically, USD/JPY is hitting a strong resistance zone at SMA100 and Pivot points, so it is likely to continue to decline next week.
🔆Analysis based on important resistance - support levels and Pivot points combined with SMA to come up with a suitable strategy
Resistance zone: 148.70 - 149.10 - 150.00
Support zone: 148.12 - 147.61 - 146.73
Plan:
🔆Price Zone Setup:
👉Buy USD/JPY 148.70 – 148.80
❌SL: 149.15 | ✅TP: 148.20 – 147.70 – 146.80
FM wishes you a successful trading day 💰💰💰
USDJPY SELLOANDA:USDJPY FOREXCOM:USDJPY FX:USDJPY PEPPERSTONE:USDJPY
THE overbought is rech ,and now we looking for sell

USDJPYUSDJPY
Completed " 12345 " Impulsive Waves and " A " Corrective Wave. Break of Structure and breakout the Lower Trend Line of the corrective patterns " Bullish Channel " in STF and LTF. Resisting from Demand Zone creating the Change in Characteristics

UJ 4star long Early EntryFirst Publish. UJ at support lvl 148.25. Long position opened 148.30 3/19/25 9pm CT trailing stop 17 pips. previous candle is an indecision candle following a recent short into support at 148.25 TP:148.91

USDJPY - Fake BreakdownHello Traders !
The USDJPY failed to break the support level (149.356 - 148.639).
Currently, The resistance line is broken !
So, I expect a bullish move📈
_______________
TARGET: 150.580🎯

Usdjpy short term bearishExpecting another leg lower, but if price unable to move down strongly and break channel, price will continue higher

USDJPY Breakout And Potential RetraceHey Traders, in today's trading session we are monitoring USDJPY for a selling opportunity around 149.300 zone, USDJPY was trading in an uptrend and successfully managed to break it out. Currently is in a correction phase in which it is approaching the retrace area at 149.300 support and resistance area.
Trade safe, Joe.

Order Block @149.84 |Sell SignalPrice is in an overall downtrend but it was in a short-term uptrend. It created a change of character which indicates an end of the short-term trade. No I'll wait for price to retrace and mitigate the order block that lead to the change of character. I'll wait for confirmation in order to enter a sell position.

Buying UsdJpyTrading Strategy:
Entry Point: Consider entering a buy position near the 147.993 support level.
Stop Loss: Place a stop loss just below the 147.740 level to manage risk in case the downtrend continues.
Take Profit: Target the 149.000 or 150.141 levels as potential resistance zones for profit-taking.
Risk Management:
1% of my capital

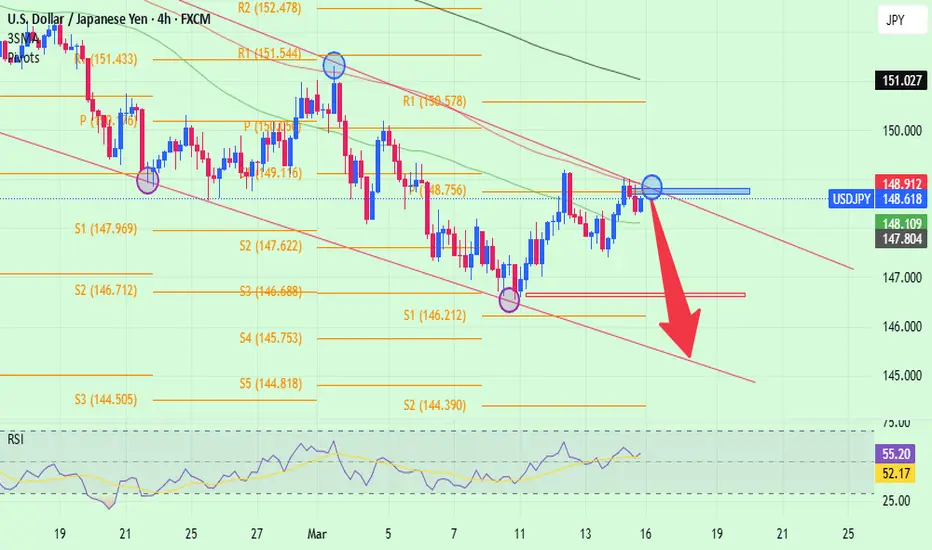
USDJPY → Resistance retest (wedge) before the Fed meetingFX:USDJPY is forming a correction to trend resistance as part of the dollar index consolidation. An interesting situation is forming which could be a continuation of the downtrend.
Fundamentally, today is an important day. The FED interest rate meeting is ahead. Traders are waiting, the dollar is consolidating at this time. Most likely the rate will remain unchanged, but in this key everyone is interested in Powell's comments on monetary policy and their future actions.
USDJPY at this time is forming a correction to the bearish trend resistance, before the news the currency pair may test the resistance conglomerate: a wedge, 0.79 fibo, or an orderblock located outside the channel
Resistance levels: 150.16, 150.95
Support levels: 148.92
False breakout of the resistance zone can provoke a fall, as well as breakdown of the support of the “wedge” with the subsequent consolidation of the price in the selling zone. The price may test the zone of interest at 147.6, 146.54.
Regards R. Linda!

My USDJPY short idea 19/3/2025Although Bank Of Japan held rates and sounded neutral-dovish I think the yen has a potential to strengthen against the USD since the FED is sounding dovish and is looking to cut rates twice this year. I think US economy will strengthen and USD will see some weakness.

Short Idea USDJPYwill be taking this short over extended. aiming for each of these zones to get swept. this is not financial advice. happy trading everyone
33

USD/JPY 4H – Short Setup at Upper Trend Channel Projection.USD/JPY 4H – Short Setup at Upper Trend Channel Projection
USD/JPY is currently trading within a well-defined descending channel. Price is approaching the upper trend channel projection, a key area derived from parallel structure analysis. While this level has not been tested multiple times, it aligns with the broader bearish trend, making it a potential rejection zone.
If price fails to close above this projection on the 4H timeframe, a short position will be executed with a stop-loss above the recent highs. The initial target is the previous lows at 146.60, while the extended target is the lower trend channel trendline.
Watching for confirmation before entry.

