USDJPY 1H HIT SUPPLY ZONE This 1h SUPPLY ZONE looks to hold nicely
I will wait for break of 149.36 will go in on retest (as seen on the chart)
My Target
TP 1 146.59
TP2 143.65
As usual will update as soon im in
Happy TUESDAY :)
USDJPY.1000.DUB trade ideas

USDJPY Price ActionHello Traders,
Due to USD weakness, this pair presents a potential short opportunity. We have a valid supply zone, strengthened by liquidity presence.
🔹 Trade Plan:
1️⃣ Wait for a liquidity sweep before entering.
2️⃣ Let the price tap into the supply zone.
3️⃣ Switch to a lower timeframe (5M or 15M) for precise entry confirmation.
4️⃣ Look for a Mitigation Block or Fair Value Gap (FVG) as an entry trigger.
⚠️ Risk Management is Key:
Always manage risk, avoid greed, and never trade blindly.
Stick to your plan, and let the market come to you.
Wishing you all the best & happy trading! 🚀📊 Thank you!

Geopolitical Analysis and Impacts on Currency Markets
Hello, my name is Andrea Russo and today I want to talk to you about how recent geopolitical news is impacting the Forex market, analyzing the main currency pairs and providing a detailed technical picture.
Current Geopolitical Context
This week, the geopolitical landscape has been characterized by a series of significant events. Among them, tensions between the United States and Russia have dominated the scene, with a phone call between Donald Trump and Vladimir Putin that has opened up the possibility of a negotiation in Ukraine. However, the situation on the ground remains critical, with Russian forces advancing in several Ukrainian regions2. Furthermore, uncertainty over gas supplies in Europe has led to significant volatility in energy markets, with the price of gas falling by 3%.
Impacts on the Forex Market
Geopolitical tensions have had a direct impact on the Forex market, influencing volatility and capital flows. For example:
EUR/USD: The pair has been showing a bearish trend, influenced by economic uncertainty in Europe and the strength of the dollar as a safe haven.
USD/JPY: The dollar has gained ground against the yen, thanks to the perception of economic stability in the United States.
GBP/USD: The British pound has been under pressure due to concerns about economic growth in the United Kingdom.
Technical Analysis
A technical analysis of the major currency pairs reveals the following trends:
EUR/USD: Technical indicators suggest a "sell" position, with key support at 1.0832 and resistance at 1.0862.
USD/JPY: The pair is showing "buy" signals, with an uptrend supported by resistance at 148.09.
GBP/USD: Indicators are mixed, with resistance at 1.2944 and support at 1.2920.
Conclusion
Geopolitical dynamics continue to play a crucial role in determining the movements of the Forex market. Investors should carefully monitor global developments and use technical tools to make informed decisions. The current volatility offers opportunities, but also requires careful risk management.
I hope this analysis has been useful to you in better understanding the connections between geopolitics and Forex. Stay tuned for more updates!

USDJPY EA MAN UPDATE > READ THE CHAPTIAN Key Observations:
Resistance Level: The price is testing a key resistance zone around 150.026, where selling pressure could emerge.
EMA Confluence: The price is currently above both the 30 EMA (149.639, red) and 200 EMA (149.339, blue), indicating an overall bullish trend.
Projected Bearish Move: A rejection from the resistance zone could lead to a pullback towards the 149.117 support level, aligning with the potential short-term bearish scenario.
If price fails to break above the resistance and starts forming lower highs, a move towards the target point at 149.117 could unfold.

USDJPY Tests Cup and Handle Formation Ahead of FOMCUSDJPY has formed a cup-and-handle pattern just below the 150 level. Today, the Bank of Japan kept interest rates steady at 0.50%. Wage negotiations so far indicate a 5.46% wage increase, which Governor Ueda described as "somewhat strong." Combined with rising food prices, the risk of further inflation has increased. Japan's inflation has remained above 2% since early 2022, and there’s no sign of that trend reversing anytime soon. In light of these factors, the BOJ is likely to consider a rate hike in May.
However, today’s market focus will shift to the FOMC. The Fed is expected to raise its inflation and unemployment forecasts while lowering its growth forecast due to the anticipated effects of new U.S. trade policies. These stagflationary pressures are likely to keep the Fed’s rates elevated for an extended period. If the dot plot shows only one rate cut this year (instead of two as projected in December), the dollar index may begin to recover.
The 150 level remains a key resistance for USDJPY. A confirmed breakout of the cup-and-handle pattern has the potential to push the pair towards the 153 level over the medium term. However, given the underlying fundamentals favoring BOJ rate hikes, any upward movement will likely be slower and more choppy, unless of course FOMC goes full hawkish.
On the downside, if the Fed is less hawkish than expected, 149 (and sliglty below)becomes the critical support to watch. A break below 149 would invalidate the bullish pattern and shift momentum to the downside for USDJPY.

JPY/USD – Bullish Breakout After Falling Wedge!Let's take a deep dive into the JPY/USD price action and technical setup on the daily chart. The market has presented us with a falling wedge breakout, a strong bullish reversal signal. This pattern indicates a potential shift from the previous downtrend into an uptrend.
1️⃣ Falling Wedge Pattern – Bullish Reversal Signal
The falling wedge is a classic bullish reversal pattern. It forms when price action makes lower highs and lower lows within two converging trendlines. The key characteristic of this pattern is the decreasing selling pressure, leading to a breakout to the upside.
We observed a clear breakout from the wedge, indicating bullish momentum.
Buyers have stepped in strongly, pushing prices above the resistance zone.
This signals a potential trend reversal from bearish to bullish.
2️⃣ Breakout Confirmation & Key Levels
Once the price broke above the wedge, it faced a crucial resistance zone (marked in blue on the chart). After breaking this level, it has now turned into support—a strong technical confirmation.
Resistance Turned Support: The previous resistance is now acting as support, giving further confidence in the bullish move.
Retest Expected: After breakouts, the price often comes back to retest support before continuing higher. If it holds, it’s a good entry opportunity.
3️⃣ Entry, Stop Loss & Take Profit Targets
Based on the technical setup, here’s how we can approach this trade:
🔹 Entry: Ideal entry is around the current support zone after a successful retest.
🔹 Stop Loss: Placed below the support level at 0.006574 to minimize risk.
🔹 Take Profit (TP): The target price is set at 0.007126, aligning with the previous swing high.
4️⃣ Trade Outlook & Expected Movement
If the price holds above support, we expect a bullish continuation towards the target.
A minor pullback is possible before the next move higher.
If the price breaks below the support zone, it may invalidate the bullish setup.
📌 Final Thoughts
This setup is a high-probability bullish trade, backed by the falling wedge breakout and retest of a key level. However, always manage risk properly and wait for confirmation before entering the trade.
What do you think? Do you see further upside, or is this a false breakout? Drop your thoughts below! 👇
#JPYUSD #ForexTrading #TechnicalAnalysis #TradingView #BullishBreakout #ChartPatterns

USDJPY analysis todayHello traders, this is a complete multiple timeframe analysis of this pair. We see could find significant trading opportunities as per analysis upon price action confirmation we may take this trade. Smash the like button if you find value in this analysis and drop a comment if you have any questions or let me know which pair to cover in my next analysis.

USD/JPY: Yen May Weaken Ahead of Central Bank MeetingsUSD/JPY: Yen May Weaken Ahead of Central Bank Meetings
The yen continues to move within a downward trend, but a correction is possible ahead of next week’s central bank meetings. The upward move could reach the upper boundary of the channel at 149.50.
#forex #trading #USDJPY #analysis #markets

USD/JPY Update - Fed IR Decision TodayHow I see it:
BIG PIVOT AREA - Key Confluence, Now Support @ 148.639
Pending Interest Rate Decision:
1) If key support holds - "LONG":
Higher TF Correction towards 156.000
2) If key support is breached (1D body close below):
"BIG SHORT" towards 140.000
Thank you for taking the time to study my analysis

UsdJpy buy continuation Taking Yesterday's low as Inducement my point of interest is 149.034. I'm anticipating price to retrace back to that zone before pushing toward.
Kindly boost if you find this insightful 🫴

USD/JPY BEST PLACE TO SELL FROM|SHORT
USD/JPY SIGNAL
Trade Direction: short
Entry Level: 149.497
Target Level: 146.249
Stop Loss: 151.651
RISK PROFILE
Risk level: medium
Suggested risk: 1%
Timeframe: 12h
Disclosure: I am part of Trade Nation's Influencer program and receive a monthly fee for using their TradingView charts in my analysis.
✅LIKE AND COMMENT MY IDEAS✅


USD/JPY double top pattern appears - sharp decline?🔔🔔🔔 USD/JPY news:
➡️The USD/JPY pair reached a two-week high of around 149.93 during the Asian session on Tuesday as renewed geopolitical concerns in the Middle East boosted demand for the safe-haven US dollar. However, further gains appear uncertain due to diverging expectations between the Bank of Japan (BoJ) and the Federal Reserve, as well as rising trade tensions.
➡️On Wednesday, the BoJ is widely anticipated to maintain its current interest rates. Inflationary momentum in Japan remains strong, especially after major corporations agreed to meet their unions' substantial wage demands last week. The extent to which this trend extends to smaller businesses in the coming months will be crucial in determining the potential for future rate hikes.
Personal opinion:
➡️This could be a corrective rally to gain momentum for a further strong downtrend. The BOJ's policy is expected to raise the policy rate while the Fed is expected to keep the federal funds rate unchanged.
➡️The double bottom pattern is gradually forming and so the downtrend is still there
Analysis:
➡️Based on price action combined with resistance - support levels and EMA to come up with a suitable strategy
Plan:
🔆 Price Zone Setup:
👉Sell USD/JPY 149.50 – 149.65
❌SL: 150.00 | ✅TP: 149.00 – 148.60 – 148.10
FM wishes you a successful trading day 💰💰💰
Looking at a potential BUYUSDJPY is breaking out a triangle pattern. Possible bullish movement towards 149.82ish area

19.03.25 Morning ForecastPairs on Watch -
FX:AUDJPY
OANDA:UK100GBP
FX:AUDCHF
FX:USDJPY
A short overview of the instruments I am looking at for today, multi-timeframe analysis down to what I will be looking at for an entry. Enjoy!


USDJPY SELL/SHORTBy utilizing Fibonacci retracement levels, historical patterns, , we can formulate a hypothesis that the market might follow a similar trajectory if bearish sentiment prevails.

Analysis of USD/JPY Chart**Analysis of USD/JPY Chart**
**Chart Pattern & Market Structure**
- The chart identifies a **triangle chart pattern**, which often signals a potential breakout.
- Price has been consolidating within this structure and recently **broke above the pattern**, indicating possible bullish momentum.
**Key Technical Levels**
- **Resistance Zone (~149.8 - 150.0):** Price is testing this area, which previously acted as a supply zone. A breakout above could open doors for higher levels.
- **Support Zone (~148.5 - 149.0):** If price retraces, this area could act as a strong demand zone.
- **EMA50 (~149.2):** Currently acting as a dynamic support, maintaining the bullish structure.
**Potential Price Movement**
- The chart suggests a possible pullback toward **support** before continuing higher toward the next resistance zone (~151.5 - 152.0).
- If price breaks below the **support zone**, the uptrend could weaken, leading to a bearish scenario.
**Trading Considerations**
- A **successful breakout above resistance** (~150) could push price towards **152.0**.
- A **rejection at resistance** might bring price back to **support (~148.5 - 149.0)** before another bullish attempt.
- Traders should watch for **confirmation signals** (candlestick patterns, volume spikes) before entering trades.

Bearish USDJPY Trade Idea"The current price action suggests a bearish scenario for usdjpy. After a period of consolidation price seems to be setting up for a downward move with key indicators indicating a possible trend reversal."

USDJPY likely go down Bearish WedgeUSDJPY is trending in channel pattern and has reached its higher low and it is expected to reverse trend from here to major support area.

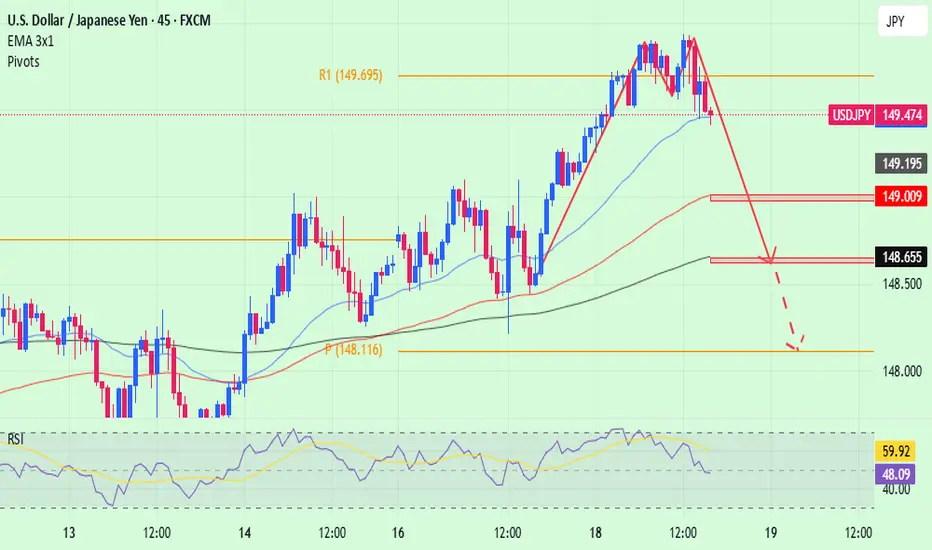
USD/JPY: Bear Wedge and Pin Candle Flash Warning SignsThe ducks may be lining up for a resumption of the USD/JPY downtrend.
Firstly, it remains in a defined falling channel. Secondly, Tuesday’s reversal delivered a bearish pin candle, often seen around market tops. Thirdly, the rebound from last week’s lows resembles a bear wedge pattern, warning of a potential downside break and resumption of the bear trend.
Momentum indicators aren’t fully on board, with RSI (14) and MACD trending higher, so the case for initiating shorts is not yet a slam dunk. But it should be on the watchlist.
A break of the bear wedge would put a retest of 148.65 on the radar, with a move beyond that level opening the door for a possible flush towards 147.10, where buyers were lurking last week. If the price were to keep pushing higher and break channel resistance, the bearish bias would be invalidated.
As covered in the attached analysis, when it comes to risks around rates guidance from the Fed and BOJ later today, this scribe sees those for the former skewed towards a slightly more dovish outcome than market pricing, and a more hawkish tone from the BOJ.
Good luck!
DS

USDJPY Scenario 19/03/2025English : According to our analysis, we anticipate a BEARISH scenario.
Morocan Darija : kanchofo d'apres l'analyse dyalna antsanaw HBOOT
ATENTION : I only share my ideas, not signals.

BOJ interest rates 3 march 2025the yen has been stronger against the usid amid US tarrif wars. forecasting the BOJ to maintain its zero interest rate policy like it mostly does
