USDJPY: Bullish move is IncomingThe market is currently at the Weekly support + with Daily breakout and pullback into our area of interest, look for buy in the yellow area and exit at the indicated Resistance. Trade safe!
USDJPY.1000.DUB trade ideas

UsdJpy bullish continuation I was patiently waiting for price at 147.842 last week but it didn't come to my point of interest.
Nothing spoil, I'll watch how price reacts at 148.033, that's my assumed poi for the bullish continuation. If price didn't respect that zone then I'll be expecting price at 147.842
My draw on Liquidity 🧲 is the current higher high 149.193.
Kindly boost if you find this insightful 🫴

SEll #USDJPYA support and resistance zone, on the 4hr combined with the longterm trend. At the moment, I am waiting for a break of structure on the 15min chart to sell.

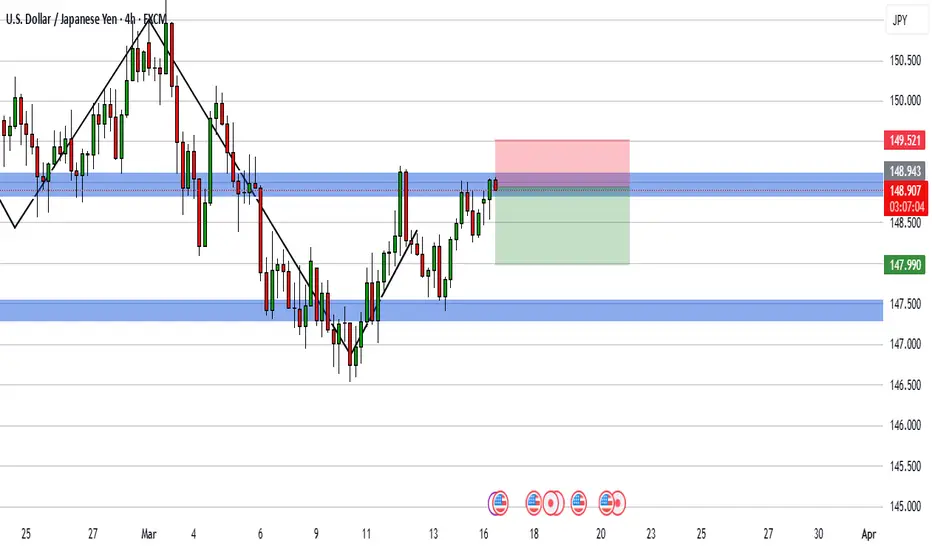
Long I opened two long positions for USDJPY pair:
My overall bias for USDJPY is bearish so I have been mainly shorting the pair but I saw a good set up wroth while to go long.
Trade set up:
Entry - 148.272 (black line in 4H chart)Target 1 - 149 (previous high and previous week mid price) - Green line in 4H chart)Target 2 - 149.82 (Green line in 4H chart)Stop loss- 147.38 (red line in 4H chart)
Reasons for this trade:
1) All momentum indicators have entered bull territory in 4H chart.
2) All daily momentum indicators are showing positive divergence.
3) All daily momentum indicators are still deep in the bear territory but have crossed to the upside, so it indicates the beginning of the potential corrective move to the upside.
4) The price has dropped to Fib 0.618 level and are boucing up to the upside in the daily chart

Fundamental Market Analysis for March 17, 2025 USDJPYThe Japanese yen (JPY) fluctuated between moderate gains and minor losses against its US counterpart during Monday's Asian session amid mixed fundamentals. Optimism driven by China's stimulus measures announced over the weekend is evident in the overall positive tone in Asian stock markets. This, in turn, is seen as a key factor undermining the safe-haven yen.
Nevertheless, a significant yen depreciation remains elusive amid diverging policy expectations between the Federal Reserve (Fed) and the Bank of Japan (BoJ). In addition, geopolitical risks and concerns over the economic impact of US President Donald Trump's tariffs are supporting the yen. In addition, bearish sentiment around the US Dollar (USD) should restrain the USD/JPY pair.
Traders may also refrain from aggressive directional bets and prefer to step aside ahead of this week's key central bank events - the Bank of Japan and Fed decisions on Wednesday. This calls for caution from the yen bears and positioning for a continuation of the recent rebound in the USD/JPY pair from the multi-month low around 146.550-146.500 reached last Tuesday.
Trading recommendation: BUY 148.900, SL 148.400, TP 150.100

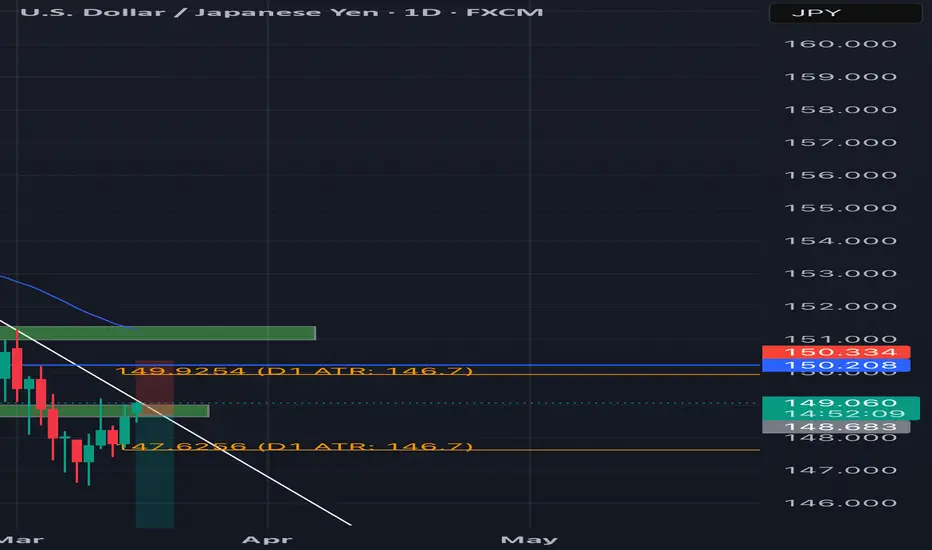
Dollar weakness and Yen strengthThe dollar has been getting weaker and weaker. Yen are looking to hike interest rates.
Downwards daily channel.
Strong daily resistance.
Strong fundamental backing to go short.
Price would have to go 200 pips which is more than its current daily ATR to get to the next strong daily support/resistance further up if this structure isn’t strong enough but I don’t feel dollar has the strength to get up there.
Once London and US market open I do believe we will see selling to the downside.
Potential longs on USDJPYUSDJPY has surged higher following the release of lower-than-expected CPI and PPI data over the past two days. The pair is currently heading into a resistance zone at the 149.2 level. If it manages to close above that level, then it could retest 150 and then eventually to 151.2.
For shorts, I would not be thinking about shorting it at the moment and would only consider it if it manages to close below 148.2 and fails to break above it.
Happy weekend and happy trading guys! Please do not forget to like and subscribe so that I can continue bringing more free analysis to you on a daily basis.


A POSSIBLE SELL SET UP ON USDJPYThe USDJPY pair is currently on a down trend on daily time frame . On one hand, it’s trading within a descending channel, indicating a strong bearish structure, with a potential target of 145.200 . The price has broken below a key support zone and may pull back for a potential retest.

USDJPY Scenario 17/03/2025English : According to our analysis, we anticipate a BEARISH scenario.
Morocan Darija : kanchofo d'apres l'analyse dyalna antsanaw HBOOT
ATENTION : I only share my ideas, not signals.

USDJPY Setup: SHORT on 200 EMA Rejection📉 Best Risk/Reward Setup: SHORT on 200 EMA Rejection
🔻 Entry: Sell in the 148.50 - 148.80 zone after rejecting the 200 EMA (⚪)
🎯 Take-Profit (TP1): 146.50 (RRR: 5:1)
🎯 Take-Profit (TP2): 145.00 (RRR: 9:1)
🛑 Stop-Loss (SL): 149.20
📊 Market Overview & Bias
🟥 Bearish Outlook (Macro Trend - Daily & 4H)
✅ USD/JPY remains in a clear downtrend, trading below the 200 EMA (⚪).
✅ Price has consistently rejected the 100 EMA (🟡) as resistance.
✅ Lower highs and lower lows are forming on the daily & 4H charts.
✅ If 146.50 breaks, next downside targets are 145.00 and 143.50.
🟩 Short-Term Bullish Retracement (1H & 30M)
🔹 USD/JPY has found temporary support at 146.50.
🔹 RSI shows bullish divergence, suggesting a possible short-term bounce.
🔹 If price breaks 148.00, we could see a move toward 149.00 – but this remains a counter-trend move within a larger downtrend.
📉 Why This Trade?
🔻 Major resistance at the 200 EMA (⚪) and previous swing highs.
🔻 The macro trend is bearish, so selling rallies is safer than counter-trend longs.
🔻 RSI may enter the overbought zone, signaling a sell opportunity.
🔻 If price struggles at 148.50, expect another bearish impulse.
⚠️ Trading carries a high level of risk, and past performance is not indicative of future results. Always manage your risk carefully and never trade with money you cannot afford to lose. This is for educational purposes only and not financial advice.
💬 Do you think USD/JPY will respect the 200 EMA or break through? Drop your thoughts below! 👇🔥

USDJPY ShortThe overall trend indicates a bearish price action. The pullback on the upper side is viewed as a seller's order block being filled, which will likely continue the bearish trend.
For a bullish scenario to unfold, the price must remain above 149.800 on a 4-hour closing basis; only then can a bullish trade be initiated.

Consolidation Below Key 150 Resistance Ahead of BOJ Meeting
The bearish scenario for this pair was thoroughly analyzed in the previous outlook, and as expected, the yen strengthened against the dollar. On the 4-hour timeframe, USDJPY is now testing the upper boundary of a drawn channel. Given the fundamental backdrop, a breakout above the channel could lead to further gains. However, failure to break the channel or the 150 resistance level could activate a bearish scenario.


Bearish reversal?USD/JPY is rising towards the resistance level which is an overlap resistance that aligns with the 61.8% Fibonacci retracement and the 127.2% Fibonacci extension and could reverse from this level to our take profit.
Entry: 149.44
Why we like it:
There is an overlap resistance level that aligns with the 61.8% Fibonacci retracement and the 127.2% Fibonacci extension.
Stop loss: 150.97
Why we like it:}
There is an overlap resistance level that is slightly above the 50% Fibonacci retracement.
Take profit: 147.54
Why we like it:
There is a pullback support level.
Enjoying your TradingView experience? Review us!
Please be advised that the information presented on TradingView is provided to Vantage (‘Vantage Global Limited’, ‘we’) by a third-party provider (‘Everest Fortune Group’). Please be reminded that you are solely responsible for the trading decisions on your account. There is a very high degree of risk involved in trading. Any information and/or content is intended entirely for research, educational and informational purposes only and does not constitute investment or consultation advice or investment strategy. The information is not tailored to the investment needs of any specific person and therefore does not involve a consideration of any of the investment objectives, financial situation or needs of any viewer that may receive it. Kindly also note that past performance is not a reliable indicator of future results. Actual results may differ materially from those anticipated in forward-looking or past performance statements. We assume no liability as to the accuracy or completeness of any of the information and/or content provided herein and the Company cannot be held responsible for any omission, mistake nor for any loss or damage including without limitation to any loss of profit which may arise from reliance on any information supplied by Everest Fortune Group.


Usdjpy buy setupLet's see that the SliQ is grabbed first before we hop in and aim at that high and chill

JPY/USD - Bearish Breakdown from Ascending Channel
📉 Market Structure:
The pair has been trending upwards inside a well-defined ascending channel. However, price is now testing the lower boundary of the channel, indicating a potential breakdown. A confirmed break below this support could trigger a bearish move.
🔍Key Levels:
Support Zone: 0.0068122 (Channel Support)
Current Price: 0.0067279
First Target: 0.0065703
Second Target: 0.0064390
📊 Trade Idea:
A confirmed break below the channel support could signal further downside.
If price rejects from this level and starts falling, a short opportunity may be considered targeting 0.0065703 and then 0.0064390.
Traders may look for bearish confirmation before entering short positions.
🚨Confirmation & Risk Management:
Bearish Confirmation: A strong break below 0.0068122 with volume.
Invalidation: A strong bounce from support and a move back inside the channel.
Risk Management: Stop-loss can be placed above 0.0068122 to protect against false breakouts.
This setup suggests a potential trend reversal if price fails to hold the channel support. Traders should watch for confirmation before executing trades.

USDJPY - Bullish pattern towards descending trendlineThe USD/JPY pair appears to be forming a potential reversal pattern after reaching a low around 146.50 in early March. Having bounced from this support level, the price is now hovering near 148.60 with indications of a larger corrective move ahead. Technical analysis suggests we are expecting a bigger correction in this area, with the price likely to test higher levels before encountering significant resistance. The initial price target will be the upper boundary of the blue box area (approximately 150.50-151.00), with potential to go toward the descending trendline that has been capping price action since January.
Disclosure: I am part of Trade Nation's Influencer program and receive a monthly fee for using their TradingView charts in my analysis.

USDJPY REVIEW $ UPDATESimple profit Analysis ...Exercise Patience on this Pair when u are not in trade ,get a clear structure and trade it.

usdjpyDXY confirmed this move what more do we want Theres a clear break and retest on the rectangle and trendline a double top has emerged 3rd touch on the trendline
