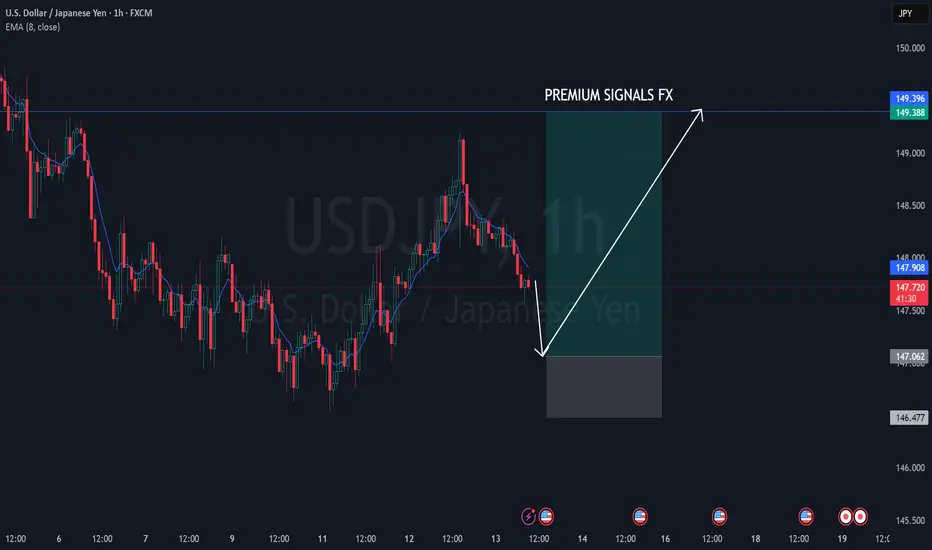
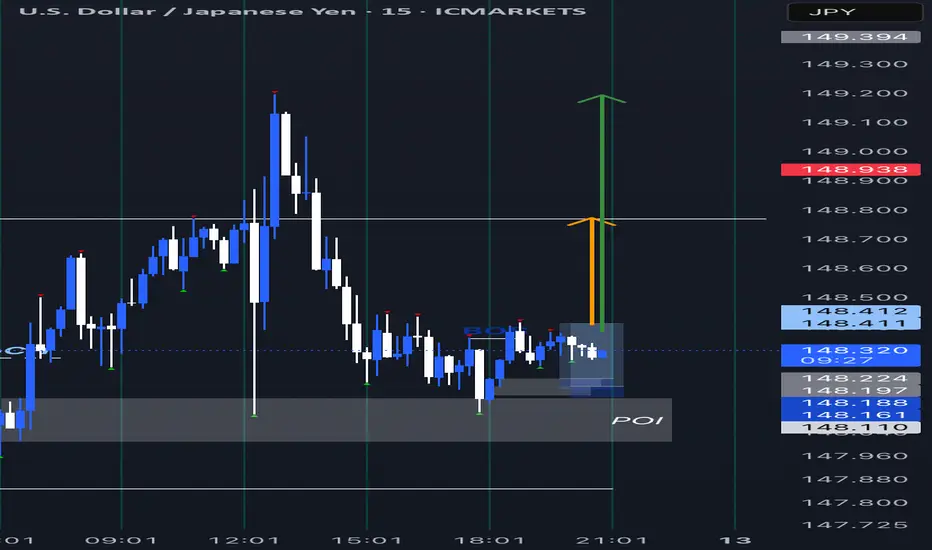
USDJPY UNFINISHED BUSINESS UPPER SIDE BFR WE GO DOWN AGAIN :)Im waiting this to play out on the 15m time frame
Will buy around 147.44-147.34 area (with good candle BULL Confirmation)
I have 2 Target for this 149.473 and 151.12 (151.12 will be good area to look for SELL)
I will update this once im in
Happy trading :)
USDJPY.1000.DUB trade ideas

USDJPY Analysis todayHello traders, this is a complete multiple timeframe analysis of this pair. We see could find significant trading opportunities as per analysis upon price action confirmation we may take this trade. Smash the like button if you find value in this analysis and drop a comment if you have any questions or let me know which pair to cover in my next analysis.

13.03.25 Morning ForecastPairs on Watch -
FX:USDJPY
FX:EURAUD
FX:GBPNZD
A short overview of the instruments I am looking at for today, multi-timeframe analysis down to what I will be looking at for an entry. Enjoy!

USDJPY Is Going Down! Short!
Please, check our technical outlook for USDJPY.
Time Frame: 4h
Current Trend: Bearish
Sentiment: Overbought (based on 7-period RSI)
Forecast: Bearish
The price is testing a key resistance 147.816.
Taking into consideration the current market trend & overbought RSI, chances will be high to see a bearish movement to the downside at least to 146.645 level.
P.S
The term oversold refers to a condition where an asset has traded lower in price and has the potential for a price bounce.
Overbought refers to market scenarios where the instrument is traded considerably higher than its fair value. Overvaluation is caused by market sentiments when there is positive news.
Disclosure: I am part of Trade Nation's Influencer program and receive a monthly fee for using their TradingView charts in my analysis.
Like and subscribe and comment my ideas if you enjoy them!

#USDJPY TRENDLINE BREAKUSDJPY broke through the downward momentum trendline on the 4h chart, however, due to to the unstable market at the moment, it may head a little lower to touch the support zone in the 146.100 area before reversing to the upside - depending on the strength of the US Dollar today.
I will be looking for a confirmation candle close on the 1h chart to enter my long trade and placing my stop-loss just below the support zone.
Remember to not rush into trades as the market is a little volatile and sensitive to economic news!

Yen Supported by BOJ TighteningThe Japanese yen stabilized around 148 per dollar on Wednesday, recovering after two days of declines as a weaker US dollar offset trade conflict concerns. Trump vowed more tariffs after the EU and Canada retaliated against his steel and aluminum duties, escalating tensions.
The yen remained supported by expectations of further BOJ rate hikes, driven by strong wage growth and inflation. Japanese companies approved significant wage increases for the third year, boosting consumer spending and giving the BOJ more flexibility for future hikes.
Key resistance is at 149.20, with further levels at 152.00 and 154.90. Support stands at 147.00, followed by 145.80 and 143.00.

USDJPY rebound until level 60% fibbonacci USDJPY Rebound from the 1h orderblock until level 60% fibbonacci on daily timeframe.
BUYGod First
Minimum Risk Maximum Reward
Action Backed Believe
# faith, strategy, and execution all in one #

USDJPY AMD ANALYSIS
WEEKLY
-mitigated a weekly fvg and respected expecting a retracement or correction to weekly buy side liquidity
DAILY
MARCH 12 CANDLE closed through above march 11 high expecting a bullish continuation for the day aligning
with the weekly outlook.
Ltf 1H
I want too see price trades below the 50% range of the 1h possibly purging the eql and testing the 1h order block for a buy at the lower tf 5 or 15mins

USDJPY Rejection from 4H Bearish Engulfing Sell ZoneUSDJPY: Rejection from 4H Bearish Engulfing Sell Zone
The USDJPY pair has encountered a rejection from the bearish engulfing sell zone on the 4-hour chart, indicating a potential reversal in the upward momentum.
Key Insights:
- The rejection from the bearish engulfing sell zone suggests a shift in market sentiment, favoring a downside move.
- We anticipate a decline towards the marked black lines, which coincide with key support levels.
Market Analysis:
The 4-hour chart indicates a clear rejection from the sell zone, with the bearish engulfing pattern suggesting a potential trend reversal. With this rejection, we expect sellers to regain control, driving the price towards the marked support levels.
Risk Management:
- Avoid getting stuck on the buy side, as the rejection from the sell zone increases the likelihood of a downside move.
- Consider adjusting stop-loss levels and position sizing to manage potential losses.
Stay informed and adapt to changing market conditions!

WAITING PATIENTLY FOR RETEST OF A DEMAND ZONERally base drop demand zone occurred, no we waiting for a retest of demand zone so the price can move up again.

USDJPY Intraday Trend Forecast for March 13, 2025The levels given in the chart may vary. The projection line will help us understand the probability of the move during the day. Use your own Technical Study for entries and exits.

Usdjpy analysis This chart represents a technical analysis of USD/JPY on the 1-hour timeframe from TradingView, outlining potential price movements based on key support and resistance levels.
Support Level: Marked around 147.175, this level is expected to act as a strong demand zone where buyers might step in if the price retraces.
Current Price: USD/JPY is trading around 148.262, showing signs of bullish momentum.
Potential Price Movement: The chart suggests a possible pullback toward the support level before resuming an uptrend.
First Target: Positioned at approximately 149.678, this is the next key resistance level where price action might encounter selling pressure.
Second Target: Identified near 151.002, indicating further bullish continuation if the first target is broken.
Outlook:
The analysis suggests a bullish bias, but a retracement to support may occur before a potential breakout. Traders may look for confirmation signals before entering positions. The volume profile on the right shows strong activity around these levels, reinforcing the importance of these key zones.

USDJPY 13.03.2025~+ Covering positions before the CPI release
~+ Trump: "period of transition" (recession fears)
~+ JP Labor union wage increase
- COT

USDJPY SELLBy utilizing Fibonacci retracement levels, historical patterns, , we can formulate a hypothesis that the market might follow a similar trajectory if bearish sentiment prevails.

USDJPY H4 I Bullish Bounce OffBased on the H4 chart analysis, we can see that the price is approaching our buy entry at 148.01, which is a pullback support that aligns close to the 50% Fibo retracement.
Our take profit will be at 148.94, which is a pullback resistance
The stop loss will be placed at 147.13, an overlap support.
High Risk Investment Warning
Trading Forex/CFDs on margin carries a high level of risk and may not be suitable for all investors. Leverage can work against you.
Stratos Markets Limited (fxcm.com/uk):
CFDs are complex instruments and come with a high risk of losing money rapidly due to leverage. 63% of retail investor accounts lose money when trading CFDs with this provider. You should consider whether you understand how CFDs work and whether you can afford to take the high risk of losing your money.
Stratos Europe Ltd (fxcm.com/eu):
CFDs are complex instruments and come with a high risk of losing money rapidly due to leverage. 63% of retail investor accounts lose money when trading CFDs with this provider. You should consider whether you understand how CFDs work and whether you can afford to take the high risk of losing your money.
Stratos Trading Pty. Limited (fxcm.com/au):
Trading FX/CFDs carries significant risks. FXCM AU (AFSL 309763), please read the Financial Services Guide, Product Disclosure Statement, Target Market Determination and Terms of Business at fxcm.com/au
Stratos Global LLC (fxcm.com/markets):
Losses can exceed deposits.
Please be advised that the information presented on TradingView is provided to FXCM (‘Company’, ‘we’) by a third-party provider (‘TFA Global Pte Ltd’). Please be reminded that you are solely responsible for the trading decisions on your account. There is a very high degree of risk involved in trading. Any information and/or content is intended entirely for research, educational and informational purposes only and does not constitute investment or consultation advice or investment strategy. The information is not tailored to the investment needs of any specific person and therefore does not involve a consideration of any of the investment objectives, financial situation or needs of any viewer that may receive it. Kindly also note that past performance is not a reliable indicator of future results. Actual results may differ materially from those anticipated in forward-looking or past performance statements. We assume no liability as to the accuracy or completeness of any of the information and/or content provided herein and the Company cannot be held responsible for any omission, mistake nor for any loss or damage including without limitation to any loss of profit which may arise from reliance on any information supplied by TFA Global Pte Ltd.
The speaker(s) is neither an employee, agent nor representative of FXCM and is therefore acting independently. The opinions given are their own, constitute general market commentary, and do not constitute the opinion or advice of FXCM or any form of personal or investment advice. FXCM neither endorses nor guarantees offerings of third-party speakers, nor is FXCM responsible for the content, veracity or opinions of third-party speakers, presenters or participants.

Bullish outlook on USDJPYUsdjpy is currently buliish, looking at taking a buy withing the yellow region

Bullish week!!! Happy long week!!
It's looking like a bullish week a great setup yesterday. And few more sniping and will see and
Entry:148.191
SL:148.054
TP:148.790

short nzd jpyif the market breach the below levels higher are the chances for the market to go down after the retest from the above support

USDJPY Take it or leave itUSDJPY - The price rejected today the last demand zone. Market this week in general until today it was slow. Price is possible to make a good bear move the last two days of the week. Today the news for USD was negative we also have high impact news for USD on 13/03/2025 i am expecting the price continue the bear trend on London session so i can find a good opportunity to sell the pair and wait the news if next news will be negative again we can make a good profit. Good luck on whatever you choose.

USDJPY TRADE IDEA : LONG | BUY (12/03)Price has been ever so bullish. Taking advantage of that opportunity.
RR: 5
N.B.: This is not financial advice. Trade safely and with caution.
A market reconsidering USD | FX ResearchFinancial markets can't get away from all things trade tariffs, and it's clear the unpredictability has been rattling sentiment. The unpredictability has also been behind a lot of the US dollar selling we've been seeing, particularly against the major currencies now viewed as alternative safe havens amidst the deterioration in confidence in the buck.
Meanwhile, the euro has been shining brightest as it also benefits from the new EU fiscal reform narrative. We have seen some weakness in the yen in recent sessions, presumably on worry over Japan's fate with respect to getting trade exemptions from the US.
Looking ahead, key standouts on Wednesday's calendar come from an ECB Lagarde speech, US inflation data, and the Bank of Canada policy decision.

