Japan's GDP revised downwards, yen swingsThe Japanese yen is showing movement in both directions today. In the North American session, USD/JPY is trading at 147.37, down 0.03% on the day.
Japan's GDP expanded 2.2% y/y in the fourth quarter of 2024, lower than the initial estimate of 2.8%. The revision was expected to stay largely unchanged but was pushed lower due to a decrease in inventories and consumption.
The GDP downward revision follows other soft data which points to weakness in Japan's economy. Household spending slumped 4.5% m/m in January. This was a sharp reversal from the 2.3% gain in December and missed the estimate of -1.9%. Annualized, household spending rose 0.8%, below the 2.7% in December and the market estimate of 3.6%. On Monday, the wage growth report indicated that real wages declined by 1.8% in January, after two months of growth.
How will the Bank of Japan react to the string of weak data? The annual wage negotiations are close to the end and the BoJ has urged companies and workers to reach a deal that significantly raises wages. This would boost growth and consumption and help keep inflation sustainable at the BoJ's 2% target.
The unions are asking for an average wage hike of 6%, up from 5.85% last year and the highest in more than 20 years. Last year's wage agreement led to the BoJ raising rates for the first time since 2007 and this year's wage deal could pave the way for another rate hike. The BoJ holds its next meeting on Mar. 19, five days after the wage settlement will be announced. The BoJ isn't expected to make a move next week but investors are circling April or May as potential rate-hike meetings.
There is resistance at 147.30 and 147.97
146.59 and 145.92 are the next support levels
USDJPY.1000.DUB trade ideas

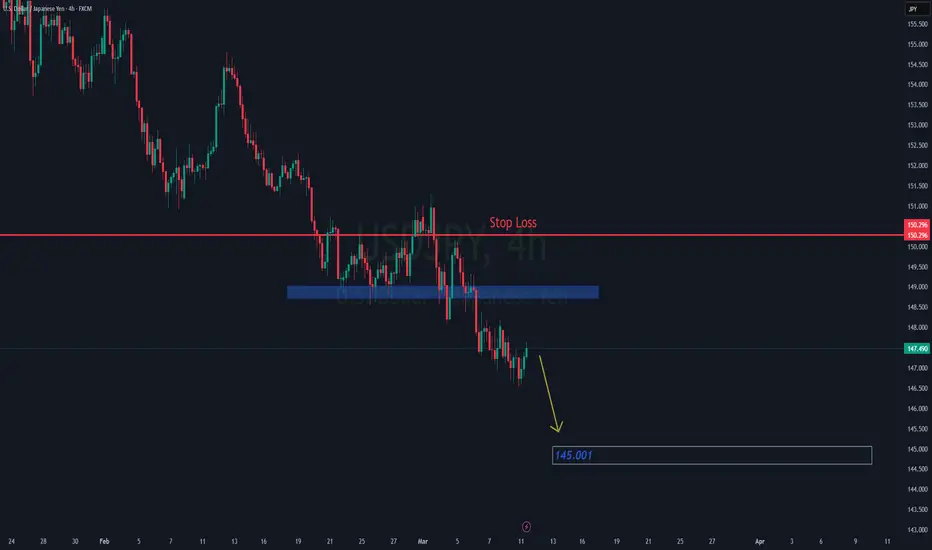
USDJPY Sell/Short IdeaUSDJPY appears to have retraced again and has been selling off for many weeks now. I expect further selling to next support.

Usdjpy play on risk aversion?Accordio to David Scutt, Market analyst, over the past 20 days, USD/JPY has logged correlation coefficients with yield spreads between U.S. and Japanese bonds—ranging from two to 10-year maturities—of between 0.76 and 0.82. While that’s similar to earlier this year, what stands out now is that it’s not just rate differentials USD/JPY has been closely tracking. Its correlation with market pricing for Fed rate cuts this year has strengthened to 0.82 over the same period.
Scutt saids that, combined with stronger relationships with riskier asset classes—such as Nasdaq 100 futures—and measures of expected market volatility like VIX futures, this suggests USD/JPY has increasingly become a play on risk aversion over the past month, coinciding with softening U.S. economic data and wobbles in U.S. stocks.
Technically, Jpy is still at bearish trend, were wed can soon begin a contracting triangle ( according to relativity Elliot theory) finish wave 5, and then begin a deep correction.
USDJPY Counter Trend Opportunities - Fxdollars - {11/03/2025}Educational Analysis says USDJPY may give countertrend opportunities from this range, according to my technical.
Broker - FXCM
So my analysis is based on a top-down approach from weekly to trend range to internal trend range.
The weekly trend range is long up to 170.000
Trading Range Approach is a long counter trend opportunity or pushback up to 155.000
The internal Trend Range Approach is a Long counter trend opportunity or pushback up to 150.000
or continue going down with an internal trading range or trading range up to 135.000
Let's see what this pair brings to the table for us in the future.
Please check the comment section to see how this turned out.
DISCLAIMER:-
This is not an entry signal. THIS IS ONLY EDUCATIONAL PURPOSE ANALYSIS.
I have no concerns with your profit and loss from this analysis.
I HAVE NO CONCERNS WITH YOUR PROFIT OR LOSS,
Happy Trading, Fx Dollars .

JPY has to devalue and lower interest ratesTrump calling Japan/China to not devalue it's currency anymore on 4th March

USD/JPY "The Gopher" Forex Market Bullish Heist Plan🌟Hi! Hola! Ola! Bonjour! Hallo! Marhaba!🌟
Dear Money Makers & Thieves, 🤑 💰🐱👤
Based on 🔥Thief Trading style technical and fundamental analysis🔥, here is our master plan to heist the USD/JPY "The Gopher" Forex market. Please adhere to the strategy I've outlined in the chart, which emphasizes long entry. Our aim is the high-risk Red Zone. Risky level, overbought market, consolidation, trend reversal, trap at the level where traders and bearish robbers are stronger. 🏆💸Book Profits wealthy and safe trade.💪🏆🎉
Entry 📈 : "The vault is wide open! Swipe the Bullish loot at any price - the heist is on!
however I advise to Place Buy stop orders above the Moving average (or) Place buy limit orders within a 15 or 30 minute timeframe most recent or swing, low or high level.
Stop Loss 🛑:
Thief SL placed at the recent / swing low level Using the 1H timeframe (148.600) swing trade basis.
SL is based on your risk of the trade, lot size and how many multiple orders you have to take.
Target 🎯: 152.300 (or) Escape Before the Target
🧲Scalpers, take note 👀 : only scalp on the Long side. If you have a lot of money, you can go straight away; if not, you can join swing traders and carry out the robbery plan. Use trailing SL to safeguard your money 💰.
📰🗞️Fundamental, Macro, COT, Sentimental Outlook:
USD/JPY "The Gopher" Forex Market is currently experiencing a bullish trend,., driven by several key factors.
🔰 Fundamental Analysis
- The Bank of Japan's (BOJ) monetary policy decisions significantly impact the yen's value. The BOJ's negative interest rate policy and quantitative easing program have contributed to the yen's depreciation.
- The US Federal Reserve's interest rate decisions also influence the USD/JPY exchange rate. Higher interest rates in the US can attract investors, causing the dollar to appreciate.
- Japan's trade balance and current account deficit can impact the yen's value. A large trade deficit can lead to a depreciation of the yen.
🔰 Macroeconomic Factors
- Inflation: Japan's inflation rate has been relatively low, which can impact the BOJ's monetary policy decisions.
- GDP Growth: Japan's GDP growth rate has been slow, which can impact the yen's value.
- Unemployment Rate: Japan's unemployment rate has been relatively low, which can impact the labor market and inflation.
🔰 COT Data
- Non-Commercial Traders: These traders, including hedge funds and individual investors, hold a significant portion of the USD/JPY futures market.
- Commercial Traders: These traders, including banks and other financial institutions, hold a smaller portion of the USD/JPY futures market.
🔰 Market Sentiment Analysis
- Bullish Sentiment: Some investors are bullish on the USD/JPY due to the interest rate differential between the US and Japan.
- Bearish Sentiment: Others are bearish due to concerns about Japan's economy and the potential for the BOJ to intervene in the currency market.
🔰 Positioning
- Long Positions: Some investors have taken long positions in the USD/JPY, betting on a continuation of the uptrend.
- Short Positions: Others have taken short positions, betting on a reversal of the uptrend.
🔰 Next Trend Move
- The USD/JPY may continue its uptrend if the interest rate differential between the US and Japan remains significant.
- However, if the BOJ intervenes in the currency market or if Japan's economy shows signs of improvement, the uptrend may reverse.
🔰 Overall Summary Outlook
The USD/JPY currency pair is influenced by a combination of fundamental, macroeconomic, and market sentiment factors. While some investors are bullish on the pair due to the interest rate differential, others are bearish due to concerns about Japan's economy. The next trend move will depend on various factors, including the BOJ's monetary policy decisions and Japan's economic performance.
⚠️Trading Alert : News Releases and Position Management 📰 🗞️ 🚫🚏
As a reminder, news releases can have a significant impact on market prices and volatility. To minimize potential losses and protect your running positions,
we recommend the following:
Avoid taking new trades during news releases
Use trailing stop-loss orders to protect your running positions and lock in profits
💖Supporting our robbery plan will enable us to effortlessly make and steal money 💰💵 Tell your friends, Colleagues and family to follow, like, and share. Boost the strength of our robbery team. Every day in this market make money with ease by using the Thief Trading Style.🏆💪🤝❤️🎉🚀
I'll see you soon with another heist plan, so stay tuned 🤑🐱👤🤗🤩

USDJPY Falling Wedge Breakout: 300 Pips Bullish Move AheadUSDJPY is currently trading at 147.50, having recently broken out of a falling wedge pattern, a strong bullish reversal signal. After the breakout, the pair has completed its retesting phase, confirming support at lower levels. With bullish momentum building, we now expect an upward move toward the 152.50 target, implying a 300 pips gain from current levels.
From a technical analysis perspective, the falling wedge is a well-known bullish continuation pattern, indicating that sellers have weakened and buyers are stepping in. Now that the retest is complete, the next key resistance levels to watch are 149.50 and 151.00, with 152.50 being the final target. Support levels are now formed at 146.50 and 145.80, where buyers could step in if any short-term pullback occurs.
On the fundamental side, USDJPY is influenced by Federal Reserve and Bank of Japan monetary policy differences. The Fed's hawkish stance and rising U.S. Treasury yields continue to support USD strength. Meanwhile, the Bank of Japan's ultra-loose policy keeps the yen weaker, allowing the bullish USDJPY momentum to continue. Additionally, risk sentiment and global economic trends favor the dollar as a safe-haven asset.
With the falling wedge breakout confirmed and fundamentals supporting further gains, USDJPY looks poised for a strong bullish rally. Traders should monitor volume and price action for confirmation, as a push above 149.50 could accelerate the move toward 152.50. This setup presents a great opportunity to capture a high-probability trade in the coming sessions.

T/R zonesThis idea is based on transient/recurrent zones
Very high probability (90%+) for the price to hit TP.
Probability was calculated on TF 15min.

USDJPY SELLPossible Sell here for USDJPY.
Waiting for current 30m candle close. If we get a strong Bearish Candle, will consider entering the trade.
If 30m candle closes with a Bullish momentum (long wick) or Bullish candle, the trade i dea is no longer valid.
Always manage your risk and best of luck! :)


USDJPY Short H4 UpdateRemember, successful trading relies on proper risk management and a disciplined approach. Use stop-losses to safeguard your assets and carefully plan each trade. Analysis is the key to making informed decisions. Stay updated and continue refining your strategies!
USDJPY SELL OPPORTUNITIES$Here’s a TradingView-style analysis for your USD/JPY chart:
---
📉 USD/JPY Analysis – H1 Timeframe
🔹 Trend: Bearish
🔹 Structure: Price is trading within a descending channel, showing lower highs and lower lows.
🔹 Key Resistance: 147.69 - 148.23
🔹 Potential Scenario:
Price is approaching a key resistance zone, which aligns with previous structure.
If price rejects this area, it could continue the bearish trend toward the 146.00 zone.
A breakout above 148.23 could invalidate the setup and signal bullish momentum.
💡 Watch for:
✔️ Bearish rejection candles at resistance
✔️ Breakout of the channel for confirmation
✔️ Increased volatility from news events
📊 What’s your bias for USD/JPY? Drop your comment below$$

USD/JPY H4 | Heading into an overlap resistanceUSD/JPY is rising towards an overlap resistance and could potentially reverse off this level to drop lower.
Sell entry is at 148.20 which is an overlap resistance that aligns with a confluence of Fibonacci levels i.e. the 23.6% and 38.2% retracements.
Stop loss is at 149.45 which is a level that sits above the 50.0% Fibonacci retracement and a swing-high resistance.
Take profit is at 146.53 which is a swing-low support.
High Risk Investment Warning
Trading Forex/CFDs on margin carries a high level of risk and may not be suitable for all investors. Leverage can work against you.
Stratos Markets Limited (www.fxcm.com):
CFDs are complex instruments and come with a high risk of losing money rapidly due to leverage. 63% of retail investor accounts lose money when trading CFDs with this provider. You should consider whether you understand how CFDs work and whether you can afford to take the high risk of losing your money.
Stratos Europe Ltd (www.fxcm.com):
CFDs are complex instruments and come with a high risk of losing money rapidly due to leverage. 63% of retail investor accounts lose money when trading CFDs with this provider. You should consider whether you understand how CFDs work and whether you can afford to take the high risk of losing your money.
Stratos Trading Pty. Limited (www.fxcm.com):
Trading FX/CFDs carries significant risks. FXCM AU (AFSL 309763), please read the Financial Services Guide, Product Disclosure Statement, Target Market Determination and Terms of Business at www.fxcm.com
Stratos Global LLC (www.fxcm.com):
Losses can exceed deposits.
Please be advised that the information presented on TradingView is provided to FXCM (‘Company’, ‘we’) by a third-party provider (‘TFA Global Pte Ltd’). Please be reminded that you are solely responsible for the trading decisions on your account. There is a very high degree of risk involved in trading. Any information and/or content is intended entirely for research, educational and informational purposes only and does not constitute investment or consultation advice or investment strategy. The information is not tailored to the investment needs of any specific person and therefore does not involve a consideration of any of the investment objectives, financial situation or needs of any viewer that may receive it. Kindly also note that past performance is not a reliable indicator of future results. Actual results may differ materially from those anticipated in forward-looking or past performance statements. We assume no liability as to the accuracy or completeness of any of the information and/or content provided herein and the Company cannot be held responsible for any omission, mistake nor for any loss or damage including without limitation to any loss of profit which may arise from reliance on any information supplied by TFA Global Pte Ltd.
The speaker(s) is neither an employee, agent nor representative of FXCM and is therefore acting independently. The opinions given are their own, constitute general market commentary, and do not constitute the opinion or advice of FXCM or any form of personal or investment advice. FXCM neither endorses nor guarantees offerings of third-party speakers, nor is FXCM responsible for the content, veracity or opinions of third-party speakers, presenters or participants.

USDJPY SELLMarket in downtrend. Entry opportunity here on a pullback following the major trend. Price rejected previous S/R.
I rate this 8/10 Sell entry setup as I like to follow the trend.
Manage your risk well!

Safe-Haven Yen Gains on Economic Risks, BOJ Policy UncertaintyThe yen rose to 147 per dollar, its strongest in five months, as US recession fears fueled safe-haven demand. Trump acknowledged economic risks, while Japan’s GDP growth was revised down to 2.2% from 2.8% due to weak consumption. The BOJ is expected to hold rates in March but may hike later this year. Finance Minister Kato warned of the real-world impact of FX volatility.
Key resistance is at 149.20, with further levels at 152.00 and 154.90. Support stands at 147.00, followed by 145.80 and 143.00.

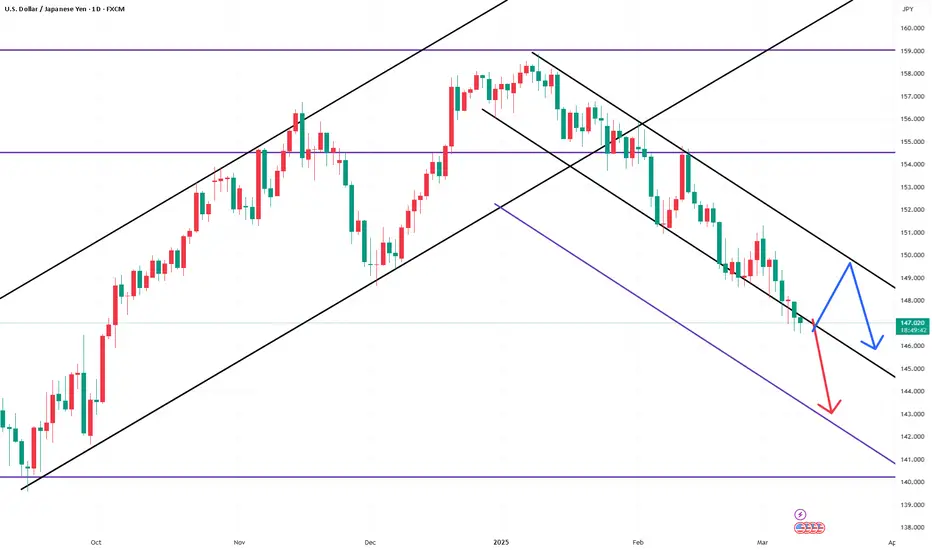
USDJPY bearish scenarioUSDJPY is on track to pull back to the 140.00 support zone. Last year, we received support twice in that zone and successfully returned to the bullish side. At the beginning of this year, the pair failed to break above the 160.00 level and retest the previous low. This triggered a bearish consolidation that is still current.

USD/JPY Upcoming Trend – Will It Continue Falling?🔔🔔🔔 USD/JPY news:
👉The Japanese Yen (JPY) maintains its upward momentum against a broadly weaker US Dollar (USD) during the early European session on Monday, driven by expectations of further interest rate hikes from the BoJ. Market participants are increasingly convinced that the BoJ will tighten its policy again, a sentiment reinforced by data released earlier today showing a 1.8% decline in real cash earnings due to persistent inflation. Additionally, strong wage growth from last year is expected to continue, further supporting the case for policy tightening. This has led to rising Japanese government bond (JGB) yields, narrowing the rate gap between Japan and other economies, which in turn strengthens the JPY.
👉Meanwhile, lingering concerns over the potential economic impact of US President Donald Trump's trade policies and a possible global trade war continue to boost the JPY's appeal as a safe-haven asset.
👉On the other hand, the USD remains under pressure, hovering near its lowest level since November, following Friday's weaker US jobs report. The disappointing data has fueled speculation that the Federal Reserve (Fed) will implement multiple rate cuts this year, further weakening the USD and weighing on the USD/JPY pair. Given this backdrop, the overall market sentiment favors JPY bulls, suggesting that the currency pair is likely to trend lower in the near term.
Personal opinion:
👉USD/JPY will continue to decline after disappointing economic data for the USD
👉Technically, in the short term, the USD is recovering slightly when it touches a strong support level - the lowest level since November 5, 2024. However, this upward recovery will not last long.
Analysis:
👉Based on important resistance - support zones combined with trend lines and SMA to come up with a suitable strategy
Plan:
🔆 Price Zone Setup:
👉Sell USD/JPY 147.40 - 147.50
❌SL: 147.90 | ✅TP: 147.00 – 146.60 – 146.20
FM wishes you a successful trading day 💰💰💰

#USDJPY PUSHING LOWERUSDJPY failed attempts to be break the strong downtrend and is heading towards the next support zone at $1.46 (TARGET 1).
There, we may get an attempt at a pullback before potentially heading even lower towards the next major support (TARGET 2).
Let's see how USDJPY reacts off target 1 first - will update once we reach this level.

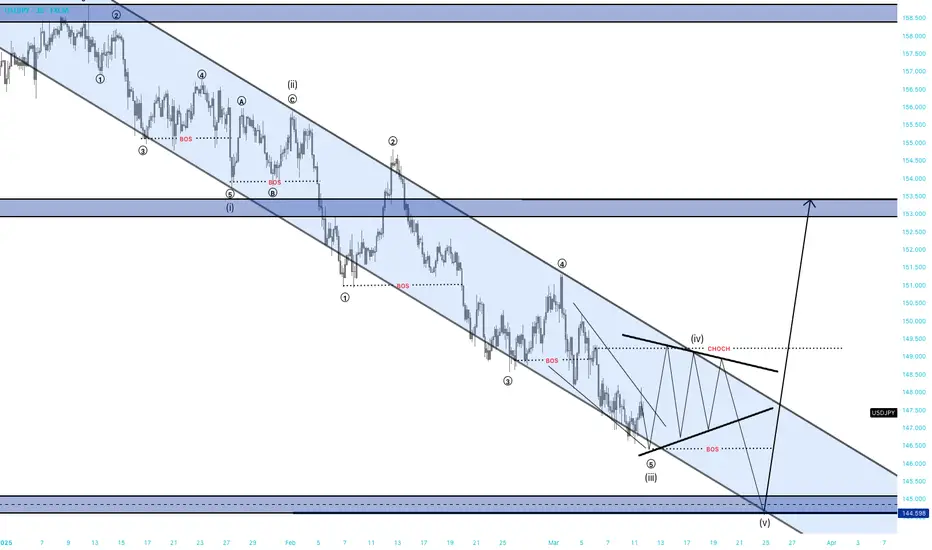
USDJPYUSDJPY ( U.S Dollar / Japanese Yen )
Key Points :
1. Elliot Waves
2. Bearish Channel
3. RSI - Divergence
4. Falling Wedge
5. Change of Characteristics

USDJPY InsightGreetings, Subscribers!
Please share your personal opinions in the comments. Don't forget to like and subscribe.
Key Points
- The Green Party has expressed opposition to easing the "debt limit" provision, which is being pursued by the Christian Democratic Union (CDU) and Christian Social Union (CSU) coalition along with the Social Democratic Party (SPD), following their victory in the German federal election.
- President Trump, in an interview with Fox News, was asked whether he expects a recession. While he stated that he does not anticipate a recession, he acknowledged that there could be a transitional period due to the imposition of tariffs, suggesting that he is not ruling out the possibility of an economic downturn.
- Japan's Q4 GDP grew by 0.6%, falling short of the market expectation of 0.7%, while household spending also saw a significant decline.
Key Economic Events This Week
+ March 12: U.S. February CPI, Bank of Canada interest rate decision
+ March 13: U.S. February PPI
+ March 14: Germany February CPI
USDJPY Chart Analysis
After breaking out of the upward trend, USDJPY has formed a short-term downtrend and appears to be extending its decline. If the trend continues, the price could drop significantly toward the 144 level. However, if a rebound succeeds at the current level, there is a high likelihood of a rise toward the 150 level.

SPY Stock Chart Fibonacci Analysis 031025Trading Idea
1) Find a FIBO slingshot
2) Check FIBO 61.80% level
3) Entry Point > 145.2/61.80%
Chart time frame: D
A) 15 min(1W-3M)
B) 1 hr(3M-6M)
C) 4 hr(6M-1year)
D) 1 day(1-3years)
Stock progress: C
A) Keep rising over 61.80% resistance
B) 61.80% resistance
C) 61.80% support
D) Hit the bottom
E) Hit the top
Stocks rise as they rise from support and fall from resistance. Our goal is to find a low support point and enter. It can be referred to as buying at the pullback point. The pullback point can be found with a Fibonacci extension of 61.80%. This is a step to find entry level. 1) Find a triangle (Fibonacci Speed Fan Line) that connects the high (resistance) and low (support) points of the stock in progress, where it is continuously expressed as a Slingshot, 2) and create a Fibonacci extension level for the first rising wave from the start point of slingshot pattern.
When the current price goes over 61.80% level , that can be a good entry point, especially if the SMA 100 and 200 curves are gathered together at 61.80%, it is a very good entry point.
As a great help, tradingview provides these Fibonacci speed fan lines and extension levels with ease. So if you use the Fibonacci fan line, the extension level, and the SMA 100/200 curve well, you can find an entry point for the stock market. At least you have to enter at this low point to avoid trading failure, and if you are skilled at entering this low point, with fibonacci6180 technique, your reading skill to chart will be greatly improved.
If you want to do day trading, please set the time frame to 5 minutes or 15 minutes, and you will see many of the low point of rising stocks.
If want to prefer long term range trading, you can set the time frame to 1 hr or 1 day.

