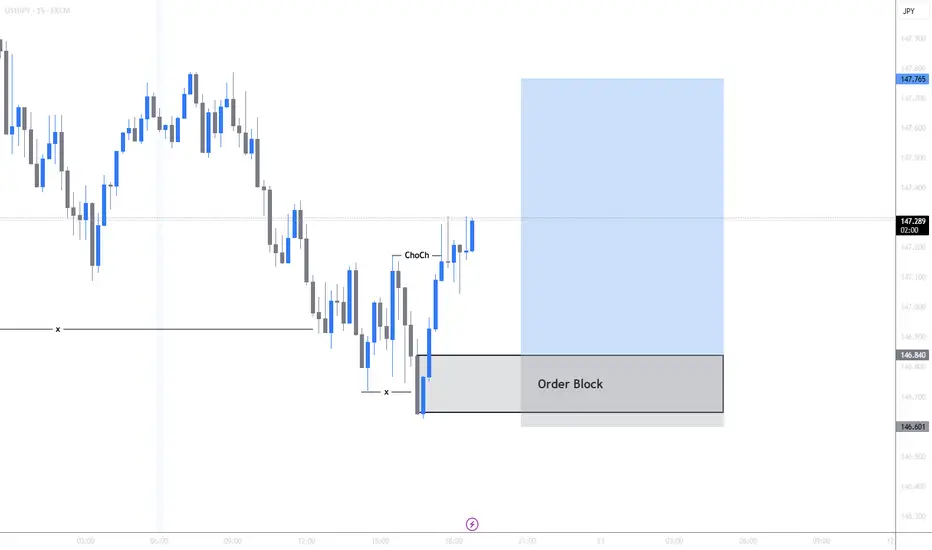
Order Block @146.84Price sweeps Friday's lows and creates a change of character so I'm going long when price comes back to tap the order block and targeting today's highs
USDJPY.1000.DUB trade ideas
USDJPY BUY?At current pice, the market seems to be struggling to go down as per last week Friday daily candle close.
Based on Daily and 4HR, the market seems to be forming a possible reversal pattern which could lead to a possible reversal.
We could see BUYERS coming in strong should the current level hold.
Disclaimer:
Please be advised that the information presented on TradingView is solely intended for educational and informational purposes only.The analysis provided is based on my own view of the market. Please be reminded that you are solely responsible for the trading decisions on your account.
High-Risk Warning
Trading in foreign exchange on margin entails high risk and is not suitable for all investors. Past performance does not guarantee future results. In this case, the high degree of leverage can act both against you and in your favor

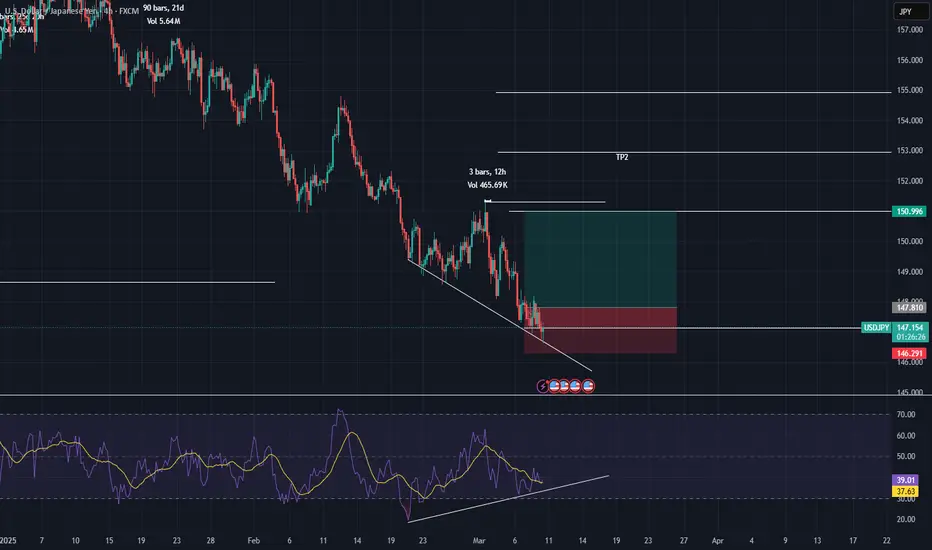
USDJPYI don't usually trade using the RSI strategy, but for some reason, I decided to take a look at it. What I found was a very strong divergence on the 4-hour timeframe, which has been developing over 72 candles—a significant number. Based on this, I expect this candle to be the reversal candle signaling an upward move toward the targets mentioned above.
Trade safely
USD/JPY Struggles as Key Fibonacci Support Comes into FocusUSD/JPY has extended its decline, now testing the 61.8% Fibonacci retracement level near 146.95, a key support zone. The pair remains under pressure after failing to reclaim 151.50, where the 38.2% retracement and the 200-day EMA converge.
Key Technical Observations:
Fibonacci Support Test: The 61.8% retracement level is being challenged, making this a critical decision point. A confirmed breakdown below 146.95 could open the door toward 143.70 (78.6% retracement).
Bearish EMAs: The 50-day EMA and 200-day EMA are sloping downward, reinforcing the bearish momentum.
Momentum Indicators:
RSI is approaching oversold levels, suggesting a short-term bounce could emerge. However, the broader trend remains weak.
MACD remains in negative territory, signaling continued downside pressure.
Key Levels to Watch:
Support: 146.95 (61.8% retracement), 143.70 (78.6% retracement).
Resistance: 149.20 (50% retracement) and 151.50 (200-day EMA & 38.2% retracement).
USD/JPY is at a critical juncture. Holding 146.95 could trigger a short-term rebound, but failure to do so would reinforce the bearish case, targeting the mid-143s. Bulls need to reclaim at least 149.20 to shift the structure back toward neutral.
-MW

USDJPY: Will Start Growing! Here is Why:
The price of USDJPY will most likely increase soon enough, due to the demand beginning to exceed supply which we can see by looking at the chart of the pair.
Disclosure: I am part of Trade Nation's Influencer program and receive a monthly fee for using their TradingView charts in my analysis.
❤️ Please, support our work with like & comment! ❤️

Surging yen hits 5-month high, wage data mixedThe Japanese yen has started the week with strong gains. In the European session, USD/JPY is trading at 147.07, down 0.766 on the day. Earlier, the yen strengthened to 146.72, its best level since Oct. 4, 2024.
Japan's wage data for January was mixed. Base pay for Japanese workers jumped by 3.1% y/y but more importantly, inflation-adjusted real wages declined by 1.8%. This follows two consecutive months of gains and signals that inflation has outpaced growth.
The wage report was released just days before the end of annual wage negotiations at Japan's largest companies. The largest labor union in Japan is demanding large wage hike of 6% and the Bank of Japan wants to see a strong rise in wages in order to keep inflation sustainable at the 2% level.
The BoJ has urged companies and workers to reach a deal that significantly raises wages. The central back meets next week and is widely expected to keep interest rates unchanged. Still, the Bank has signaled it plans to continue raising rates during the year.
In the US, nonfarm payrolls rose to 151 thousand in February, up from a downwardly revised 125 thousand in January but shy of the market estimate of 160 thousand. The unemployment rate rose to 4.1% from 4%. Wage growth eased to 0.3% m/m from a revised 0.4% in January, in line with expectations. Annualized, wages ticked higher to 4%, up from a revised 3.9% in January but below the market estimate of 4.1%.
The employment report was decent but the threat of US tariffs continues to cloud the economic outlook. If trade tensions escalate, the Federal Reserve may have to adjust its rate path, depending on how tariffs affect inflation and growth.
USD/JPY has pushed below support at 147.26 and is testing support t 147.26. Next is support at 1.46.48
148.51 and 148.98 are the next resistance lines

USDJPY Potential DownsidesHey Traders, in today's trading session we are monitoring USDJPY for a selling opportunity around 147.500 zone, USDJPY is trading in a downtrend and currently is in a correction phase in which it is approaching the trend at 147.500 support and resistance area.
Trade safe, Joe.


USDJPY LONG IDEAFor the intraday session I expect a jump to the upside, also GDP data is near the horizon, I expect that USJJPY will cover some of the pevious crashes. The 147.000 level area could be a nice entry zone. My trade setup is the follwing on the chart.

USD/JPY BULLS WILL DOMINATE THE MARKET|LONG
Hello, Friends!
USD/JPY downtrend evident from the last 1W red candle makes longs trades more risky, but the current set-up targeting 150.469 area still presents a good opportunity for us to buy the pair because the support line is nearby and the BB lower band is close which indicates the oversold state of the USD/JPY pair.
✅LIKE AND COMMENT MY IDEAS✅

Daily forecast- EURCHF- EURAUD - USDJPY 10/03/2025Daily forecast- EURCHF- EURAUD - USDJPY 10/03/2025

I'm buying USDJPYPardon me for not analyzing and showing you possible trade ideas for the new week. The main reason is... I trade what I see. Yes, I've a bias, I've expectations from the market but when i see otherwise, I trade. This helps me not to marry a bias and start forcing trades. Most of my trades are market orders with SL and TP, so you've to be following to see them on time.
Now to USDJPY, I think it will buy, the buy may be a retracement or more massive but let's take it one level at a time and see how it goes.
Ya gazie

10.03.25 Morning ForecastPairs on Watch -
FX:EURAUD
FX:USDJPY
A short overview of the instruments I am looking at for today, multi-timeframe analysis down to what I will be looking at for an entry. Enjoy!

JPY Market Analysis Update – Key Level at 148.000Market Overview:
📈 Strong JPY Performance:
Expectations of another BoJ rate hike have pushed the Japanese Yen to perform strongly in the Asia-Pacific region.
📊 Record Net Long Positions:
Non-commercial traders' net long yen futures surged to 96K contracts (up from 61K), setting a 30-year record according to CFTC data.
Technical Insights:
📉 Descending Channel & Reversal Setup:
While bearish pressure has been evident, momentum is showing signs of easing, hinting at a potential stabilization or near-term bounce. A reversal setup is identified in the 147.000/148.000 zone.
🎯 Key Level:
Next week, the crucial level is 148.000. Be prepared for a buy signal if prices break above, or a sell signal if they remain below this level.
Upcoming Catalysts:
⏰ Fed Policy Uncertainty:
With Fed Chair Jerome Powell indicating that rate cuts are not imminent, this policy uncertainty could favor the US Dollar in the coming week, influencing the JPY further.
Keep an eye on the Consumer Price Index, Producer Price Index, and Michigan Consumer Sentiment Index.
Stay Tuned:
I'll provide a detailed update at the beginning of next week. Follow along for more insights and actionable trading strategies!
Happy Trading!
Disclaimer:
Forex and other market trading involve high risk and may not be for everyone. This content is educational only—not financial advice. Always assess your situation and consult a professional before investing. Past performance doesn’t guarantee future results.

Could the price bounce from here?USD/JPY is reacting off the pivot and could bounce to the 1st resistance which acts as an overlap resistance.
Pivot: 146.90
1st Support: 144.74
1st Resistance: 149.28
Risk Warning:
Trading Forex and CFDs carries a high level of risk to your capital and you should only trade with money you can afford to lose. Trading Forex and CFDs may not be suitable for all investors, so please ensure that you fully understand the risks involved and seek independent advice if necessary.
Disclaimer:
The above opinions given constitute general market commentary, and do not constitute the opinion or advice of IC Markets or any form of personal or investment advice.
Any opinions, news, research, analyses, prices, other information, or links to third-party sites contained on this website are provided on an "as-is" basis, are intended only to be informative, is not an advice nor a recommendation, nor research, or a record of our trading prices, or an offer of, or solicitation for a transaction in any financial instrument and thus should not be treated as such. The information provided does not involve any specific investment objectives, financial situation and needs of any specific person who may receive it. Please be aware, that past performance is not a reliable indicator of future performance and/or results. Past Performance or Forward-looking scenarios based upon the reasonable beliefs of the third-party provider are not a guarantee of future performance. Actual results may differ materially from those anticipated in forward-looking or past performance statements. IC Markets makes no representation or warranty and assumes no liability as to the accuracy or completeness of the information provided, nor any loss arising from any investment based on a recommendation, forecast or any information supplied by any third-party.

USD/JPY - Key Breakout, Potential "SHORT"How I see it:
Pair broke through key confluence of support last week.
I need you to get the confluence: NOW RESISTANCE EXACTLY RIGHT.
Resistance Zone Coordinates:
Above = 148.960
Below = 148.023 -
Potential "SHORT" Targets -
TP 1 = 145.930
TP 2 = 144.530
Thank you for taking the time to study my analysis.

NFP can produce runners hereVery attractive long scalp zones
Fundamentals does not align with current level
NFP print good then we can have runners
information created and published doesn't constitute investment advice!
NOT financial advice

Usdjpy sell now down more opportunity for pattern of crazy 1. Alternative Scenario (Bullish Counter to Bearish Setup):
While the chart is heavily bearish, showing a breakdown area and targeting 144.110, price currently holds above 147, which could act as interim support.
If price fails to break below 146.500, a bullish retracement to 148.500–149.000 is possible before any further downside.
Watch for a false breakdown and reversal signals near 146.500–147.000.
2. Volume Analysis:
Note that recent volume spikes around breakdown attempts could suggest that buyers are still active, absorbing selling pressure.
If volume dries up on further breakdown attempts, momentum for the drop may weaken.
3. Hidden Bullish Divergence:
If RSI/MACD (if added) shows higher lows while price makes lower lows, hidden bullish divergence could hint at a potential bounce — invalidating the straight move to 144 for now.
4. Invalidation Levels:
The 147.800–148.200 zone may serve as a key resistance; if price reclaims this area, it could negate the bearish outlook.
Above 149.500, bears would be invalidated, and we might return to test the 150.100 resistance mentioned in your chart.
5. Fundamental Factors:
Any USD news catalyst (like CPI, NFP, or Fed decisions) might shift momentum abruptly. If USD strengthens, JPY pairs could reverse the expected bearish move

USDJPY scenario 10/03/2025English : According to our analysis, we anticipate a BEARISH scenario.
Morocan Darija : kanchofo d'apres l'analyse dyalna USDJPY antsanaw lhboot
ATENTION : I only share my ideas, not signals.

USDJPY in Bearish trend USDJPY in Bearish trend about to experience a trend reversal, RSI Bullish diversions can be seen, RR TP1- .75, TP1.5- .5, TP2- .25

USDJPY falling wedge will take another lower low or breakout ?USDJPY at important level will it shows breakout or follows the falling wedge pattern another round and then will break out ?
