USDJPY POTENTIAL LONG OPPORTUNITY (MEAN REVERSION TRADE)Alright hello awesome TradingView community! Hope you guys have had a fantastic weekend so far. I always love creating posts for you guys knowing that I have an awesome community of hungry and focused traders/investors potentially looking at this analysis and I really do hope you guys can pull some nuggets from this post! So let's dive in
OK so for USDJPY I am really looking for just a simple reversal (mean reversion) type of trade here. IF you guys look at USDJPY on a macro technical perspective it is coming off of multi-decade highs (YEN at multi-decade lows) and the USD has been moving lower against the JPY for a few months now. Fundamentally (which I am just building off of general bias) speaking I do see the YEN grabbing some strength with heavy optimism coming for the YEN. With that in mind when looking at price and my simplistic approach to trading I see prices coming down to a weekly/daily level of strong demand (previous buying area). AMAZING thing about the charts is it is a footprint/receipt of the bigger players and we can see they were buying at this zone before which as retail traders should leave us to believe they may be buying this zone again...ever heard of "history repeats itself?" It is true in the markets as well
SO when looking at this trade some technical confluences I have that helped me build this bias were:
1. Prices has been dropping for weeks/daily downtrend is overextended
2. Weekly/Daily RSI (relative strength index) is oversold on 4H,1D & 1W timeframes
3. Weekly/Daily previous buyer demand zone
4. Fib alignment confluence for reversal and target zones
ALRIGHT guys hope this all made sense nice and simple potential short term reversal setup on the USDJPY currency pair. IF you guys enjoyed this analysis please boost this post & follow my page for more highly accurate trade analysis & setups! Until next time...Cheers!
USDJPY.1000.DUB trade ideas


USD/JPY H1 Bullish Triangle Breakout - Upside Momentum AheadUSD/JPY has broken out of a bullish triangle pattern on the H1 timeframe, signaling potential upside continuation. Price action confirms a strong breakout above resistance, with momentum favoring further gains.
🔹 Key Levels:
✅ Resistance Turned Support: 148
✅ Next Resistance Target: 150
🔹 Trade Setup:
📈 Buy Entry: Above 148.1
🎯 Target 1: 148.6
🎯 Target 2: 150
🛑 Stop Loss: 147.8
📊 Technical Confirmation:
✔️ Breakout from bullish triangle pattern 📈
✔️ Increasing bullish momentum 🔥
✔️ Retest potential for a better entry 🎯
💡 Hashtags for SEO:
#USDJPY #ForexTrading #PriceAction #TechnicalAnalysis #ForexSignals #TradingSetup #BreakoutTrading #ForexStrategy #TradingView
This breakout could offer a strong risk-reward opportunity if momentum holds. Let me know your thoughts! 🚀📈

Bullish rebound?USD/JPY is falling towards the support level which is a pullback support that lines up with the 61.8% Fibonacci retracement and could bounce form this level to our take profit.
Entry: 146.95
Why we like it:
There is a pullback support level.
Stop loss: 143.76
Why we like it:
There is a pullback support level that is slightly below the 138.2% Fibonacci extension.
Take profit: 150.92
Why we like it:
There is an overlap resistance level that line sup with the 50% Fibonacci retracement.
Enjoying your TradingView experience? Review us!
Please be advised that the information presented on TradingView is provided to Vantage (‘Vantage Global Limited’, ‘we’) by a third-party provider (‘Everest Fortune Group’). Please be reminded that you are solely responsible for the trading decisions on your account. There is a very high degree of risk involved in trading. Any information and/or content is intended entirely for research, educational and informational purposes only and does not constitute investment or consultation advice or investment strategy. The information is not tailored to the investment needs of any specific person and therefore does not involve a consideration of any of the investment objectives, financial situation or needs of any viewer that may receive it. Kindly also note that past performance is not a reliable indicator of future results. Actual results may differ materially from those anticipated in forward-looking or past performance statements. We assume no liability as to the accuracy or completeness of any of the information and/or content provided herein and the Company cannot be held responsible for any omission, mistake nor for any loss or damage including without limitation to any loss of profit which may arise from reliance on any information supplied by Everest Fortune Group.

USDJPY longIt seems that USDJPY can fall to 145.112 to 144.050 and then start an upward movement to 151.357, from which it can be limited to a loss of 141.668 and a long trade can be made for a target of 151.357.


XAUUSD and USDJPY Top-down analysisHello traders, this is a complete multiple timeframe analysis of this pair. We see could find significant trading opportunities as per analysis upon price action confirmation we may take this trade. Smash the like button if you find value in this analysis and drop a comment if you have any questions or let me know which pair to cover in my next analysis.

USDJPY - Bigger correction on the daily timeframeUSD/JPY's daily chart indicates we're expecting a larger correction in the near term, followed by a likely continuation of the downtrend toward the blue box target area (143.50-146.00). After reaching peaks near 162.00 in July 2024 and 158.00 in December 2024/January 2025, the pair has established a series of lower highs, creating a clear downtrend pattern. Currently trading around 148.05, the price sits at a critical juncture, with the projected path suggesting a temporary bounce (as illustrated by the zigzag line) before bearish momentum likely resumes. This outlook is supported by the consistent lower highs since mid-2024, the price's position near a historical support/resistance level, February's failed attempt to sustain prices above 150, and the overall downward momentum that has dominated since December 2024.
Disclosure: I am part of Trade Nation's Influencer program and receive a monthly fee for using their TradingView charts in my analysis.

This idea should be clear to everyone about this tradeSoo you just have to watch out for the main reason to trade this

This trade will sail throughWhy this trade will sail through is because the trading section that is required for this things to happen is going on now which is what is needed for a trade to happen

USDJPY SETUPThis analysis is Invalid when Price stays bullish to break Above the high 151.305.Perfect setup for some good profit..Don't struggles with a Simple profit.
POSSIBLE SELL SETUP ON USDJPYHey traders!
USDJPY is displaying a clear downtrend on the daily timeframe. Key observations:
• Broke below the 151.083 zone
• Retested the zone once
• Currently facing rejection around 146.983
Let's patiently wait for market opening and observe if we get a double top (M pattern) aligned with our trend line. If confirmed, we'll look to take a sell position.
Stay vigilant, and let's trade wisely!

USDJPY Weekly FOREX Forecast: March 10 - 14th In this video, we will analyze USDJPY and JPY Futures. We'll determine the bias for the upcoming week, and look for the best potential setups.
After a long period of weakness in the YEN, the last couple of months have shown a turnaround. By several metrics, the BOJ has the country's economy finding its footing, and looking up. This is reflecting in its currency. It a time of uncertainty, the YEN will and has been outperforming the USD, as investors look to it as the safe haven of choice. This is likely to continue in the next week or so.
Enjoy!
May profits be upon you.
Leave any questions or comments in the comment section.
I appreciate any feedback from my viewers!
Like and/or subscribe if you want more accurate analysis.
Thank you so much!
Disclaimer:
I do not provide personal investment advice and I am not a qualified licensed investment advisor.
All information found here, including any ideas, opinions, views, predictions, forecasts, commentaries, suggestions, expressed or implied herein, are for informational, entertainment or educational purposes only and should not be construed as personal investment advice. While the information provided is believed to be accurate, it may include errors or inaccuracies.
I will not and cannot be held liable for any actions you take as a result of anything you read here.
Conduct your own due diligence, or consult a licensed financial advisor or broker before making any and all investment decisions. Any investments, trades, speculations, or decisions made on the basis of any information found on this channel, expressed or implied herein, are committed at your own risk, financial or otherwise.


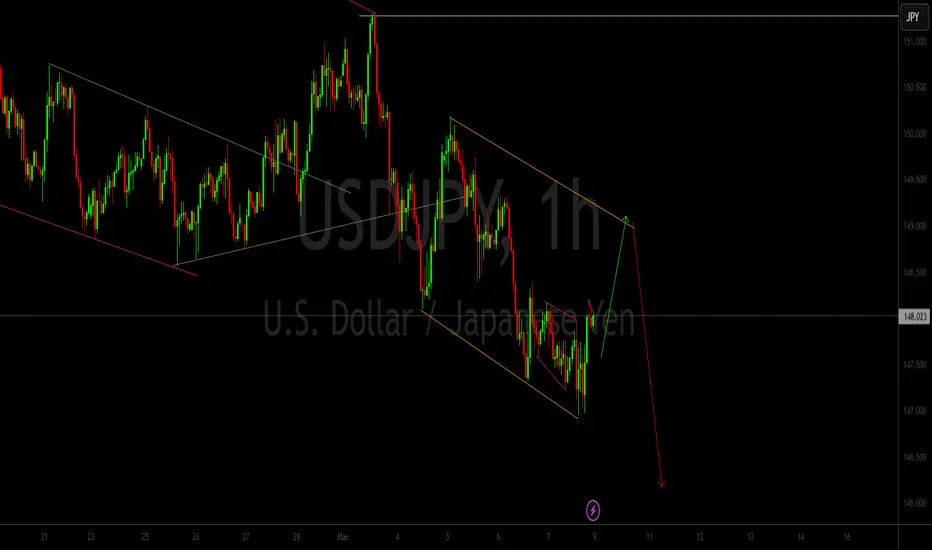
USDJPY bearish setupUJ broke the support level and now retesting it. I'm seeing this as an optimal level for a sell, SL just slightly above the resistance 148.7(you can go wider) with optimal target 142.26 also here R:R of your choice. Stronger confirmation is below 147.2 you can wait for candle to close that level before entering the trade.
Candles above the resistance would invalidate this setup

