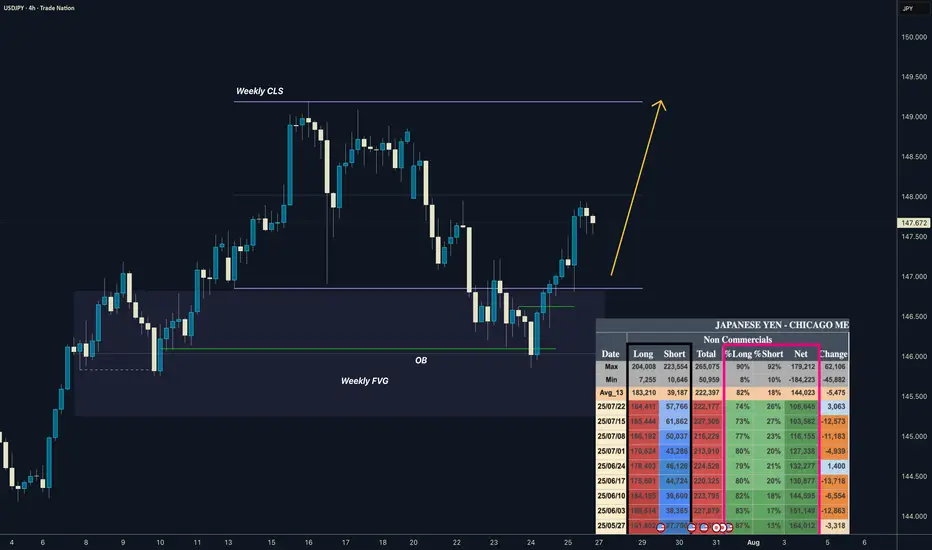
USDJPY I Weekly CLS I Model 1 / 2 I COT Bullish ASFYo Market Warriors ⚔️
Fresh Crypto Analysis— if you’ve been riding with me, you already know:
🎯My system is 100% mechanical. No emotions. No trend lines. No subjective guessing. Working all timeframes. Just precision, structure, and sniper entries.
🧠 What’s CLS?
It’s the real smart money. The i
About U.S. Dollar / Japanese Yen
Also known as trading the “gopher” the USDJPY pair is one of the most traded pairs in the world. The value of these currencies when compared to each other is affected by the interest rate differential between the Federal Reserve and the Bank of Japan.
Related pairs
USD/JPY Rejection Trade: Short from ResistanceUSD/JPY 1H Short Setup
Price entered a key resistance zone near 148.700–148.850 and formed a rejection. A short position is triggered with a stop loss above the resistance and target at 147.856 support. Bearish momentum expected.

USDJPY Short Setup: Trend Reversal Confirmation in ProgressAfter waiting patiently for nearly two weeks, price action on USDJPY is finally beginning to align with bearish expectations. The current setup shows signs of exhaustion in the bullish momentum, with a rejection near the 147.80–148.00 zone — a key area of interest.
🔍 Entry thesis:
Price is reactin

USD/JPY on the 1D timeframeBased on the chart I provided for USD/JPY on the 1D timeframe, here is the target analysis:
📉 Downtrend Analysis:
The chart is showing a descending channel, indicating a bearish trend.
Price has been respecting the upper and lower bounds of the channel.
Two target zones are marked with labels “T

USDJPY: Bullish Move From Support Ahead! 🇺🇸🇯🇵
I think that there is a high chance that USDJPY will continue growing
next week.
A bullish breakout of a resistance line of a flag pattern that occurred
after a test of a key support provides a strong bullish signal.
Goal - 148.7
❤️Please, support my work with like, thank you!❤️
I am part

Lingrid | USDJPY Potential Channel Breakout. LongFX:USDJPY is retesting the breakout zone after reclaiming support from a prior swap area near 146.9. Price action has broken above a downward trendline and is forming a bullish retest structure. As long as USDJPY holds above 146.920 zone, the setup favors a continuation toward the resistance barri

USDJPY 30Min Engaged (Buy & Sell Reversal Entry's Detected )Time Frame: 30-Minute Warfare
Entry Protocol: Only after volume-verified breakout
🩸Bullish Reversal - 148.350
🩸Bearish Reversal - 148.370
➗ Hanzo Protocol: Volume-Tiered Entry Authority
➕ Zone Activated: Dynamic market pressure detected.
The level isn’t just price — it’s a memory of where they mo

Lingrid | USDJPY Possible Strong Bullish RallyThe price perfectly fulfilled my previous idea . FX:USDJPY is trading within an upward channel after forming a higher low near the 147.50 zone, bouncing from the support trendline. Price action suggests a bullish structure continuation toward the 150.95 resistance, especially if the recent consol

USDJPY Potential UpsidesHey Traders, in today's trading session we are monitoring USDJPY for a buying opportunity around 147.800 zone, USDJPY is trading in an uptrend and currently is in a correction phase in which it is approaching the trend at 147.800 support and resistance area.
Trade safe, Joe.

Key Observations 1. Rectangle + Double Top (“Top 2”) Formation (left side):
• Price ranged between ~147.5 and ~149.5.
• A double top inside the rectangle signaled resistance and potential reversal.
• Breakdown from the rectangle zone occurred, confirming bearish momentum.
2. Rising Wedge Pattern (right side, gr

See all ideas
Summarizing what the indicators are suggesting.
Oscillators
Neutral
SellBuy
Strong sellStrong buy
Strong sellSellNeutralBuyStrong buy
Oscillators
Neutral
SellBuy
Strong sellStrong buy
Strong sellSellNeutralBuyStrong buy
Summary
Neutral
SellBuy
Strong sellStrong buy
Strong sellSellNeutralBuyStrong buy
Summary
Neutral
SellBuy
Strong sellStrong buy
Strong sellSellNeutralBuyStrong buy
Summary
Neutral
SellBuy
Strong sellStrong buy
Strong sellSellNeutralBuyStrong buy
Moving Averages
Neutral
SellBuy
Strong sellStrong buy
Strong sellSellNeutralBuyStrong buy
Moving Averages
Neutral
SellBuy
Strong sellStrong buy
Strong sellSellNeutralBuyStrong buy
Displays a symbol's price movements over previous years to identify recurring trends.