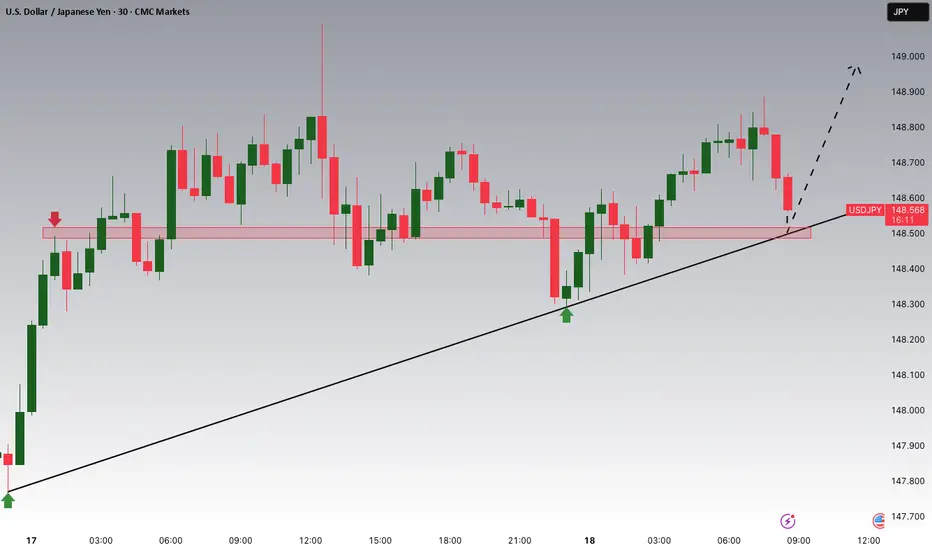
USD/JPY - Triangle Pattern (18.07.2025)The USD/JPY pair on the M30 timeframe presents a Potential Buying Opportunity due to a recent Formation of a Triangle Pattern. This suggests a shift in momentum towards the upside and a higher likelihood of further advances in the coming hours.
Possible Long Trade:
Entry: Consider Entering A Long Position around Trendline Of The Pattern.
Target Levels:
1st Resistance – 149.93
2nd Resistance – 150.65
🎁 Please hit the like button and
🎁 Leave a comment to support for My Post !
Your likes and comments are incredibly motivating and will encourage me to share more analysis with you.
Best Regards, KABHI_TA_TRADING
Thank you.
Disclosure: I am part of Trade Nation's Influencer program and receive a monthly fee for using their TradingView charts in my analysis.
USDJPY trade ideas

USDJPY Potential UpsidesHey Traders, in today's trading session we are monitoring USDJPY for a buying opportunity around 148.500 zone, USDJPY for a buying opportunity around 148.500 zone, USDJPY is trading in an uptrend and currently is in a correction phase in which it is approaching the trend at 148.500 support and resistance area.
Trade safe, Joe.
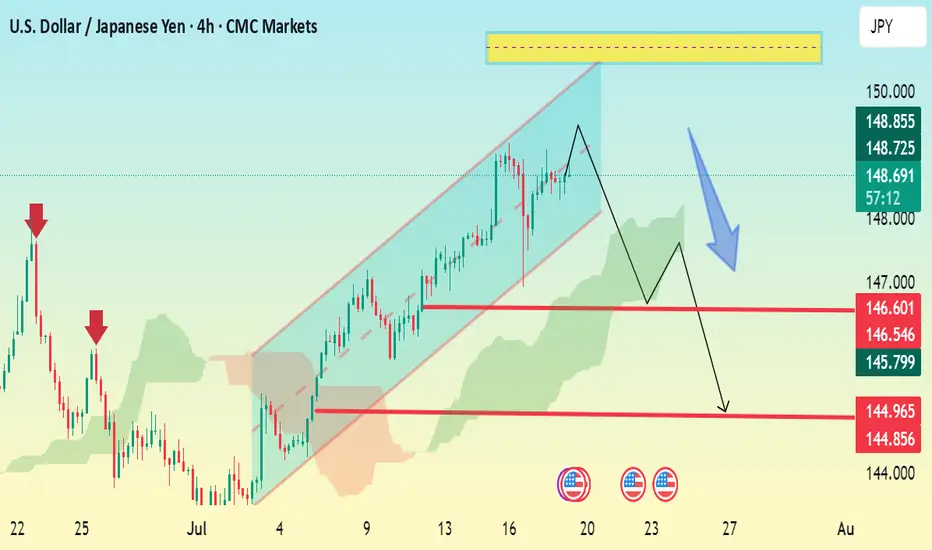
USD/JPY 4H Bearish Setup – Channel Breakdown ExpectedThe chart shows USD/JPY in a rising channel with a projected bearish reversal setup forming. Here’s a breakdown:
🔹 Current Price: 148.83
🔹 Pattern Observed:
The pair is trading inside a rising channel.
A potential double top or lower high formation near the top of the channel suggests weakening bullish momentum.
Price may break down through the channel support.
🔻 Bearish Scenario (as shown by the blue arrow):
1. Initial drop expected to the support zone around:
146.60 – 146.54
Minor consolidation possible at this level.
2. If broken, next target zone is:
144.96 – 144.85
🔑 Key Levels:
Resistance Zone: 149.80–150.00 (highlighted in yellow)
Support Levels:
First: 146.60
Second: 144.96
✅ Bearish Confirmation:
A 4H candle close below 146.60 would confirm the bearish move.
Watch Ichimoku cloud — if price breaks and closes below the cloud, it will strengthen the downtrend.
USD/JPY Is Ready Move Will Be Fly USD/JPY 30-min chart shows a potential buy setup from the 146.18 support zone, targeting 148.10 with stop loss at 145.82. Price is expected to rise through resistance levels at 147.00 and 147.70.

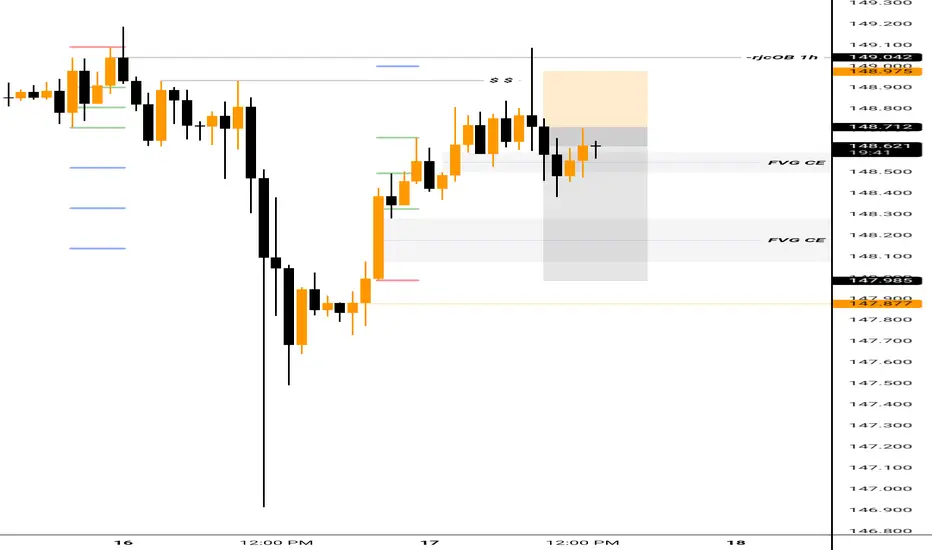
USDJPY 30Min Engaged ( Bearish Entry Detected )————-
➕ Objective: Precision Volume Execution
Time Frame: 30-Minute Warfare
Entry Protocol: Only after volume-verified breakout
🩸 Bearish From now Price :148.750
➗ Hanzo Protocol: Volume-Tiered Entry Authority
➕ Zone Activated: Dynamic market pressure detected.
The level isn’t just price — it’s a memory of where they moved size.
Volume is rising beneath the surface — not noise, but preparation.
🔥 Tactical Note:
We wait for the energy signature — when volume betrays intention.
The trap gets set. The weak follow. We execute.
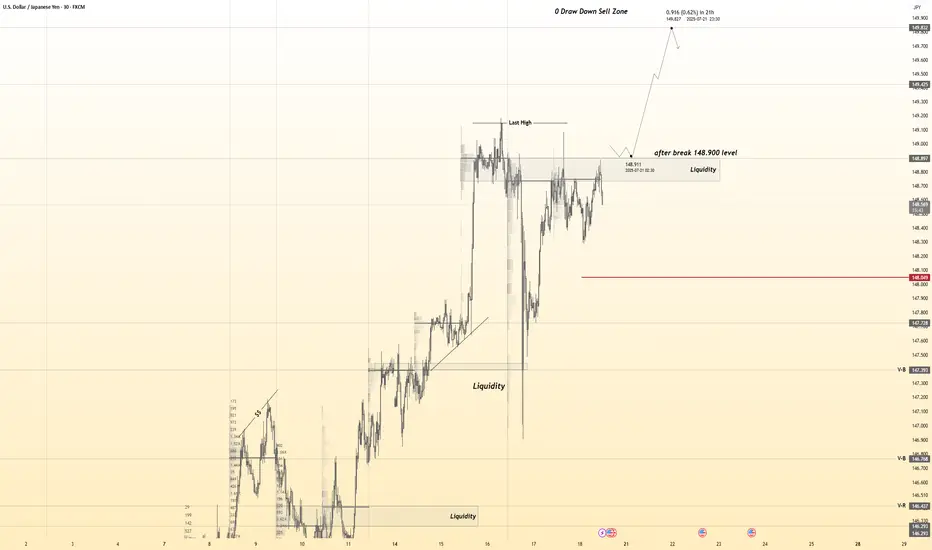
USDJPY 30Min Engaged ( Bullish After Breakout Entry Detected )————-
➕ Objective: Precision Volume Execution
Time Frame: 30-Minute Warfare
Entry Protocol: Only after volume-verified breakout
🩸 Bullish After Break : 148.900
➗ Hanzo Protocol: Volume-Tiered Entry Authority
➕ Zone Activated: Dynamic market pressure detected.
The level isn’t just price — it’s a memory of where they moved size.
Volume is rising beneath the surface — not noise, but preparation.
🔥 Tactical Note:
We wait for the energy signature — when volume betrays intention.
The trap gets set. The weak follow. We execute.
USDJPY Falling Fast Bearish Momentum or Reversal Zone?USDJPY has dropped significantly and is now trading around 147.730, nearing a key historical support zone near 147.20 – 147.00.
This area previously acted as a strong demand zone and may trigger a bounce or a breakdown depending on market sentiment.
🔹 Technical Overview (4H Chart):
• Current Price: 147.73
• Support Zone: 147.20 – 147.00
• Resistance: 149.00
• Breakdown Target: 145.80
• Possible Bounce Target: 148.80 – 149.30
📊 Bias:
I'm watching this zone closely.
• If price holds above 147.00 with bullish candle – Long Setup toward 149.00
• If price breaks below 147.00 and closes on 4H – Short Setup toward 145.80
⚠️ Use tight SL below support zone if buying.

USDJPY 30Min Engaged ( Bullish Entry Detected )————-
➕ Objective: Precision Volume Execution
Time Frame: 30-Minute Warfare
Entry Protocol: Only after volume-verified breakout
🩸 Bullish From now Price : 147.450
➗ Hanzo Protocol: Volume-Tiered Entry Authority
➕ Zone Activated: Dynamic market pressure detected.
The level isn’t just price — it’s a memory of where they moved size.
Volume is rising beneath the surface — not noise, but preparation.
🔥 Tactical Note:
We wait for the energy signature — when volume betrays intention.
The trap gets set. The weak follow. We execute.

USDJPY 30Min Engaged ( Buy & Sell Reversal Entry's Detected )————-
➕ Objective: Precision Volume Execution
Time Frame: 30-Minute Warfare
Entry Protocol: Only after volume-verified breakout
🩸 Bullish Reversal : 146.450
🩸 Bearish Reversal : 147.350
➗ Hanzo Protocol: Volume-Tiered Entry Authority
➕ Zone Activated: Dynamic market pressure detected.
The level isn’t just price — it’s a memory of where they moved size.
Volume is rising beneath the surface — not noise, but preparation.
🔥 Tactical Note:
We wait for the energy signature — when volume betrays intention.
The trap gets set. The weak follow. We execute.

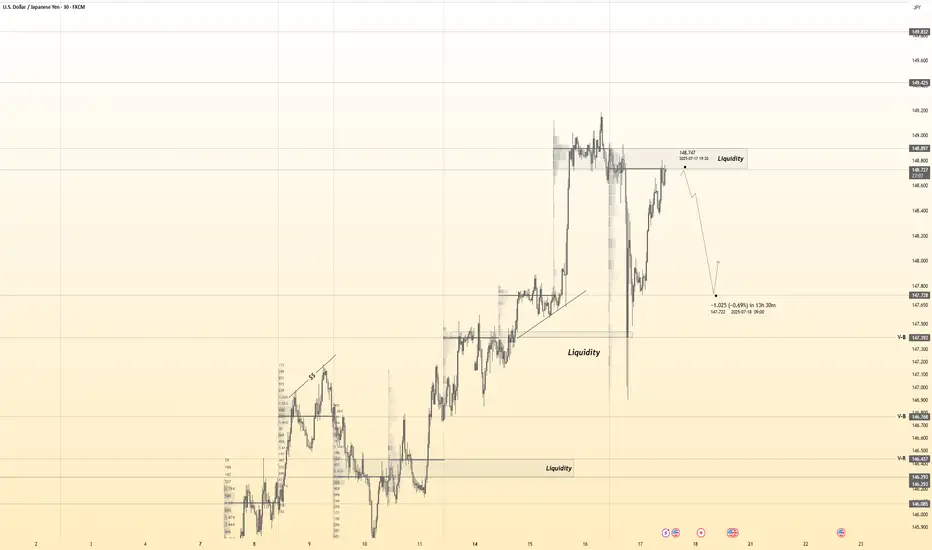
USDJPY → Hunting for liquidity before the fallFX:USDJPY is changing its local trend and succumbing to global pressure. The market is seeing a change in price movement following the decline in the dollar index...
The trend has broken and the price movement has turned bearish. The fall in the dollar index is allowing the Japanese yen to strengthen, which is generally negative for the currency pair. The decline may continue after a slight correction.
Fundamentally, the dollar is correcting amid uncertainty due to the tariff war, as well as expectations of interest rate cuts.
Resistance levels: 147.20, 147.89
Support levels: 145.85, 145.23
As part of the correction, the price may test the liquidity zone of 147.7 or 0.7f. A false breakout and consolidation of the price in the selling zone may trigger a further decline in both the short and medium term.
Best regards, R. Linda!

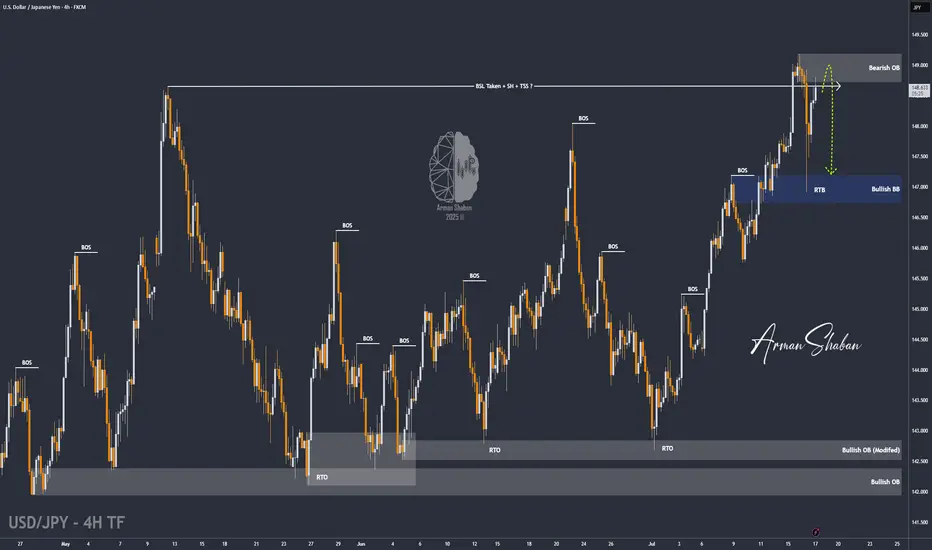
USD/JPY : Get Ready for another Fall ! (READ THE CAPTION)By analyzing the USDJPY chart on the 4-hour timeframe, we can see that after our last daily timeframe analysis, the price started its rally from the 144 zone and, as expected, hit all three targets at 145.5, 147.35, and 148.65, delivering over 500 pips in returns — even reaching as high as 149.2! Once the price broke above 148.65 and swept the liquidity above this level, it faced selling pressure and dropped to 146.9. Currently trading around 148.65, if USDJPY manages to hold below the supply zone between 148.65 and 149.2, we can expect further downside movement. This analysis will be updated with your support!
THE DAILY ANALYSIS :
Please support me with your likes and comments to motivate me to share more analysis with you and share your opinion about the possible trend of this chart with me !
Best Regards , Arman Shaban
USDJPY Is Very Bearish! Sell!
Please, check our technical outlook for USDJPY.
Time Frame: 3h
Current Trend: Bearish
Sentiment: Overbought (based on 7-period RSI)
Forecast: Bearish
The market is trading around a solid horizontal structure 148.811.
The above observations make me that the market will inevitably achieve 147.818 level.
P.S
We determine oversold/overbought condition with RSI indicator.
When it drops below 30 - the market is considered to be oversold.
When it bounces above 70 - the market is considered to be overbought.
Disclosure: I am part of Trade Nation's Influencer program and receive a monthly fee for using their TradingView charts in my analysis.
Like and subscribe and comment my ideas if you enjoy them!

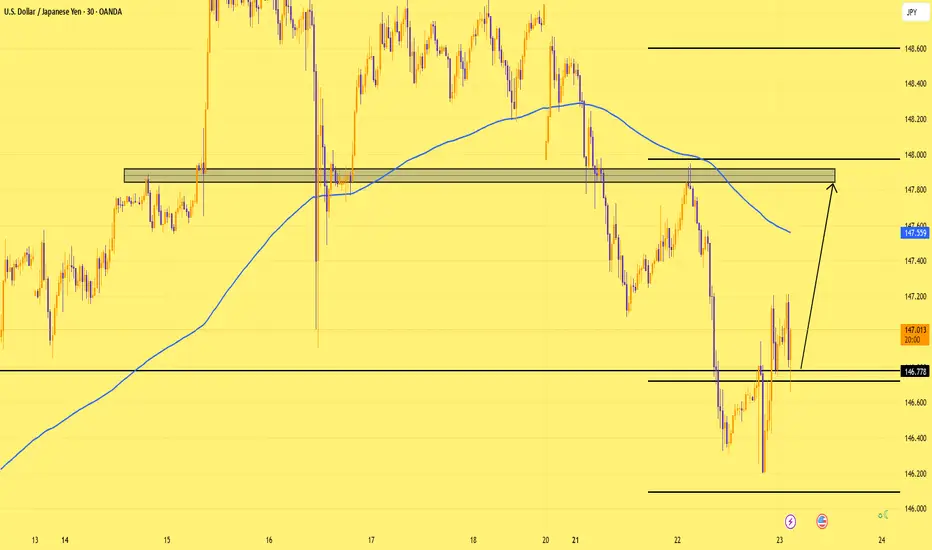
USDJPY: Back to the Shelf Before Lift-Off?Price might drop a little at the open, but I don’t expect it to go far.
Support is around 146.77—if it holds, we could see a move back up toward 147.80.
USDJPY - BEARISH MOVE !Hello Traders !
The USDJPY failed to create a new higher high!
The price broke the support line!
So, I expect a bearish move📉
__________________
TARGET: 146.300🎯

USDJPY Ascending channel bullish strong from support 📊USDJPY Analysis – 4H Timeframe
USDJPY is giving full respect to the bullish ascending channel, maintaining higher highs and higher lows with clean structure
📍 Key Support Zone:
Strong buying interest seen near 147.200 — potential long opportunity from this zone
Watching for bullish confirmation or entry setups at this level
🎯 Next Target / Supply Zone:
🔹149.000 – marked as the next resistance / supply zone where price may react or slow down
Bullish Order Block (OB) sits deeper at 143.000 – a strong area of interest if price pulls back further
🧠Stay patient and let price action lead — clean structure, smart levels, and risk-managed entries
What’s your take on USDJPY right now? Drop your thoughts
#usdjpy

#USDJPY: Swing Buy Almost +2000 Pips! Dear Traders,
The USDJPY currency pair appears to be in an accumulation phase at the moment, as evidenced by the lack of significant price movement throughout the current week. Several factors contribute to this trend.
Firstly, several significant economic events are scheduled for this week, particularly tomorrow and Friday. These developments will have substantial implications for the future trajectory of the USDJPY pair. Consequently, there’s a possibility that the price may experience a decline before initiating a bullish trend. We’ve recently seen a strong bullish candle, which suggests a strong bullish move in the coming weeks. Additionally, the strong USD could continue rising, while the JPY is dropping.
Secondly, there are two primary areas where the price could reverse its course. The extent to which the USD reacts to the economic data will indicate potential reversal zones.
It’s crucial to conduct your own analysis before making any financial decisions. This chart should be used solely for educational purposes and does not guarantee any specific outcome.
Regarding the stop loss, as this is a swing trade, it’s advisable to employ a larger stop loss if the price reaches entry zones. The take profit level can be determined based on your entry type and analysis.
We wish you the best of luck in your trading endeavours and emphasise the importance of trading safely.
Please share this analysis with others through likes, comments, and social media platforms. If you have any questions or require further assistance, don’t hesitate to comment below. We’re here to provide support.
Team Setupsfx_
❤️🚀

USDJPY (daily update) 23/07happy trading everyone, here is the daily usdjpy video update. hope this helps happy trading as always

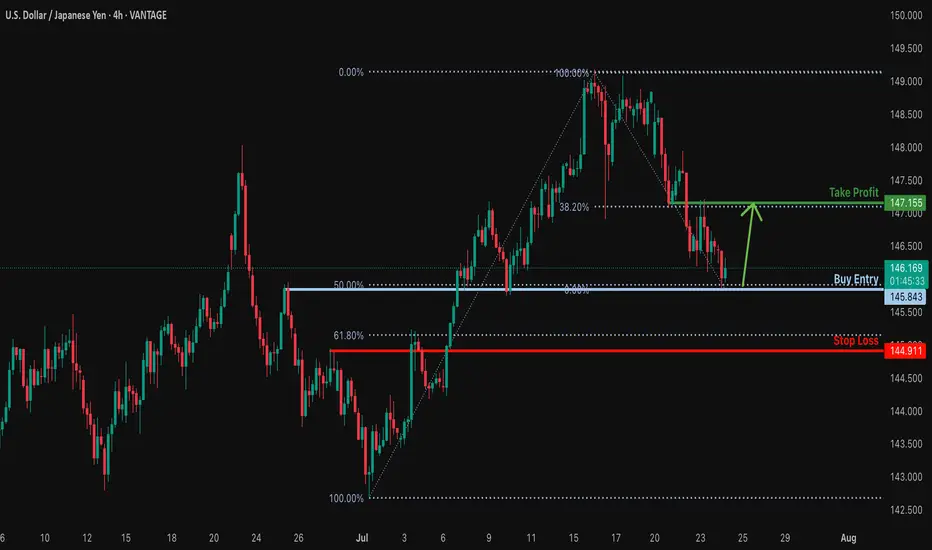
Bullish reversal?USD/JPY is falling towards the support level, which is an overlap support that aligns with the 50% Fibonacci retracement and could bounce from this level to our take profit.
Entry: 145.84
Why we like it:
There is an overlap support that aligns with the 50% Fibonacci retracement.
Stop loss: 144.91
Why we like it:
There is a pullback support that is slightly below the 61.8% Fibonacci retracement.
Take profit: 147.15
Why we like it:
There is an overlap resistance that lines up with the 38.2% Fibonacci retracement.
Enjoying your TradingView experience? Review us!
Please be advised that the information presented on TradingView is provided to Vantage (‘Vantage Global Limited’, ‘we’) by a third-party provider (‘Everest Fortune Group’). Please be reminded that you are solely responsible for the trading decisions on your account. There is a very high degree of risk involved in trading. Any information and/or content is intended entirely for research, educational and informational purposes only and does not constitute investment or consultation advice or investment strategy. The information is not tailored to the investment needs of any specific person and therefore does not involve a consideration of any of the investment objectives, financial situation or needs of any viewer that may receive it. Kindly also note that past performance is not a reliable indicator of future results. Actual results may differ materially from those anticipated in forward-looking or past performance statements. We assume no liability as to the accuracy or completeness of any of the information and/or content provided herein and the Company cannot be held responsible for any omission, mistake nor for any loss or damage including without limitation to any loss of profit which may arise from reliance on any information supplied by Everest Fortune Group.
USDJPY 30Min Engaged ( Bullish Entry Detected )————-
➕ Objective: Precision Volume Execution
Time Frame: 30-Minute Warfare
Entry Protocol: Only after volume-verified breakout
🩸 Bullish From now Price : 146.500
➗ Hanzo Protocol: Volume-Tiered Entry Authority
➕ Zone Activated: Dynamic market pressure detected.
The level isn’t just price — it’s a memory of where they moved size.
Volume is rising beneath the surface — not noise, but preparation.
🔥 Tactical Note:
We wait for the energy signature — when volume betrays intention.
The trap gets set. The weak follow. We execute.

USDJPY (daily analysus) 24/07hi everyone the daily analysis video is up little early today before the daily candle close so this analysis might change is closes differently, but as is we are still bearish.
as always happy trading and have a great day

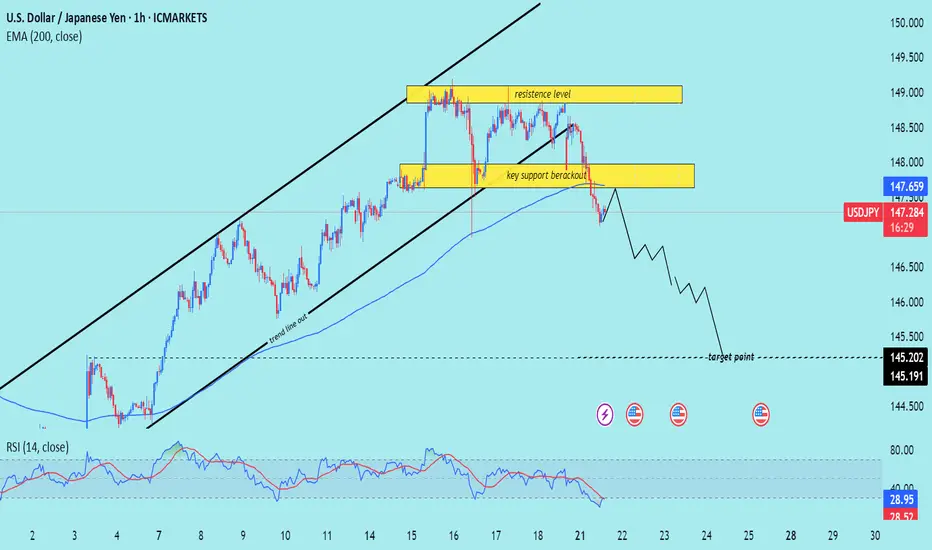
USD/JPY) bearish Trend Read The captionSMC Trading point update
Technical analysis of USD/JPY on the 1-hour timeframe, signaling a potential drop toward the 145.200 – 145.191 target zone. Here's the detailed breakdown:
---
Technical Analysis – USD/JPY (1H)
1. Rising Channel Breakdown
Price has broken below an ascending channel, confirming a trend line breakout and signaling a trend shift from bullish to bearish.
The trend line cut and rejection from the upper resistance zone support the bearish reversal.
2. Key Support Breakout
A crucial horizontal support zone around 147.80–148.00 was broken.
The break-and-retest of this area (yellow box) acts as a confirmation of bearish momentum continuation.
3. Bearish Momentum Below EMA
Price is trading below the 200 EMA (147.659) — a strong signal of downward bias on this timeframe.
The EMA has flipped from dynamic support to resistance.
4. RSI Oversold but Bearish
RSI is at 29.41, in oversold territory, which may hint at a short-term bounce.
However, the broader structure suggests more downside potential before a deeper retracement.
5. Target Projection
Projected target zone is between 145.200–145.191, aligning with previous structure lows and likely liquidity zone.
Mr SMC Trading point
Summary
Bias: Bearish
Current Price: 147.307
Key Resistance: 147.80–148.60 zone
Structure: Rising channel break + key support breakout
200 EMA: Above price (bearish signal)
RSI: 29.41 – oversold but momentum remains bearish
Target: 145.200–145.191
Please support boost 🚀 this analysis)
USDJPY Bearish Breakout!
HI,Traders !
#USD-JPY was trading along
The rising support line but
Now we are seeing a bearish
Breakout so we are bearish
Biased and we will be expecting
A further bearish move down !
Comment and subscribe to help us grow !
