USD/JPY Bullish Reversal Trade Setup – Key Support Test at 145.2Entry Point: 145.273 (highlighted in blue)
Stop Loss: ~144.817–145.260 (purple zone)
Target Point (TP): 148.133 (upper resistance zone)
📉 Recent Price Action:
Price peaked near 148.05 before reversing sharply and breaking the trendline.
The market is currently testing the support zone (near the 145.273 entry level).
Moving averages (red = short-term, blue = long-term) show a crossover to the downside, suggesting short-term bearish momentum.
📈 Trade Setup:
Strategy Type: Long (Buy) Setup
Risk/Reward: Favorable, approximately 1:2+
Entry Zone: The current price is close to the entry level at 145.273, making this a timely area to watch for a bounce or confirmation.
⚠️ Risk Factors:
If price breaks below 144.817, the setup becomes invalid.
Short-term momentum is still bearish; confirmation (like a bullish engulfing candle or support hold) is important before entering.
✅ Confirmation Triggers for Entry:
Strong bullish candlestick pattern near entry zone.
RSI or MACD bullish divergence (not shown but useful to check).
Volume spike on bounce from support.
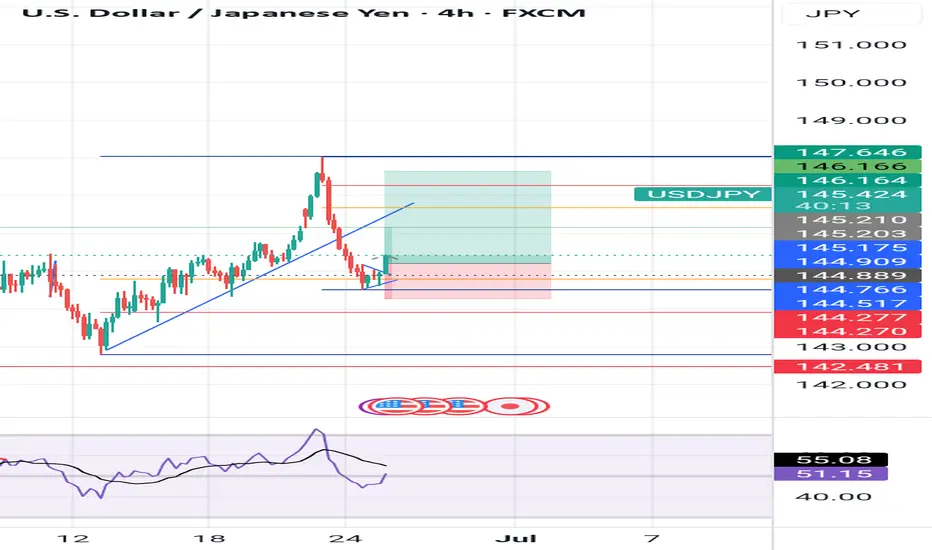
USDJPY trade ideas

Trading Recommendations and Analysis for USDJPYThe technical picture on Monday may shape future developments in the medium term. The week began a gap up, followed by the formation of a long upper shadow. The daily close occurred exactly at the support level of 146.11 thereby closing the gap.
Today's trading also opened exactly at the same level, and the candle is already black in the early hours of trading. This defines Monday's movement as false, thus creating a strong bearish signal, with a potential breakdown of the 143.45 support and a subsequent decline toward the MACD line, which coincides with the target level of 141.70. The Marlin oscillator has turned downward. its return to negative territory will add additional pressure on the price.
In the H4 timeframe, the price has consolidated below the 146.11 level, making it easier to settle below the MACD line eventually.
A break below 145.48 -the June 11 high-will serve as confirmation. The Marlin oscillator appears to be fixed in bearish territory and has joined the new downward movement.

USDJPY h4 strongly bullish opportunity Dip into/under support (~144.5)
2. Trap and reverse hard
3. Break above 148 with momentum
4. Stretch target → 149.50–150.20

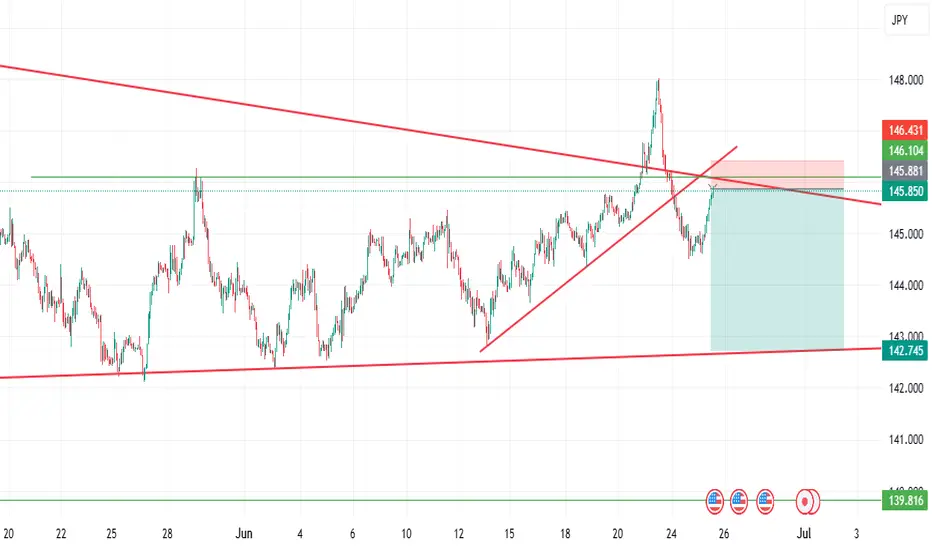
USD/JPY.2h chart patternI'm provided for USD/JPY on the 2-hour timeframe, here is a detailed breakdown and target analysis:
---
🔍 Technical Analysis Summary
Pair: USD/JPY
Timeframe: 2H
Current Price: ~144.98
Trend: Bearish
Breakdown Confirmation: Price broke structure support and the ascending trendline.
Indicators: Price is below the Ichimoku cloud, confirming bearish momentum.
---
🎯 Identified Targets (Based on Your Chart)
1st Target Level (Nearest Support Zone):
Price Level: Around 143.50
This is the first horizontal red line marked as a "Target" on your chart.
Likely to act as a short-term support level.
2nd Target Level (Major Support):
Price Level: Around 142.00
This is the second and lower red line marked on your chart.
Strong historical support zone based on previous consolidation.
---
✅ Final Target Levels
Target # Price Level Description
Target 1 143.50 Initial support; take partial profit here
Target 2 142.00 Major target; potential reversal/support zone
---
Would you like a suggested stop-loss level or entry refinement based on candlestick confirmation or indicators (like RSI or volume)?

USDJPY H2 Best Level to SHORT/HOLD TP +100/+200 pips🏆USDJPY H2 Market Update H2 chart
📊 Technical Outlook
🔸trading in well defined range
🔸trading near range highs now
🔸range highs set 148.40/148.80
🔸range lows set at 140.80/141.40
🔸strategy: SHORT SELL from resistance
🔸SL 60 pips TP1 +100 pips TP2 +200 pips
🔸swing trade setup for patient traders
🌍 FX Market Snapshot — June 2025
🇪🇺 EUR/USD (~1.1500)
Euro climbs near 1.15 as eurozone inflation cools and ECB turns more dovish.
Stable German sentiment provides support, but softer CPI could limit gains.
🔑 Support: 1.1445 | Resistance: 1.1550
🇬🇧 GBP/USD (~1.3435)
Pound slips toward 1.34 after recent highs, as UK data remains mixed.
Manufacturing picks up, but falling inflation boosts BoE rate cut bets.
🔑 Support: 1.3400–1.3420 | Resistance: 1.3500
🇺🇸 DXY (US Dollar Index, ~99.14)
Dollar edges higher as investors seek safety amid geopolitical tensions.
Mixed US economic signals; eyes on upcoming job data.
🔑 Support: 98.80 | Resistance: 100.00
🇯🇵 USD/JPY (~147.4)
Dollar rallies above 147 as yen weakens; BOJ stays ultra-loose.
Oil price spikes add extra pressure on JPY.
🔑 Support: 145.0 | Resistance: 148.5
📊 Quick View
Pair Rate Support Resistance Key Theme
🇪🇺 EUR/USD ~1.1500 1.1445 1.1550 Dovish ECB, soft CPI
🇬🇧 GBP/USD ~1.3435 1.3400–1.3420 1.3500 Mixed UK data
🇯🇵 USD/JPY ~147.4 145.0 148.5 Yen weakness
🇺🇸 DXY ~99.14 98.80 100.00 Geopolitical risks

USDJPY: Up to +2000 Pips Move! Stay Tuned USDJPY has been accumulating for a long time, and we are confident that the price will enter the distribution phase. This phase will be extremely bullish, leading the price to new record highs and potentially surpassing 160. We wish you the best in trading and have a great week ahead.
Like and comment for more!
Team Setupsfx_
❤️🚀

USDJPY Potential DownsidesHey Traders, in today's trading session we are monitoring USDJPY for a selling opportunity around 146.700 zone, USDJPY is trading in a downtrend and currently is in a correction phase in which it is approaching the trend at 146.700 support and resistance area.
Trade safe, Joe.

USD/JPY Bullish Reversal AnalysisUSD/JPY Bullish Reversal Analysis 📈💹
🔍 Technical Overview:
The chart illustrates a strong bullish reversal pattern forming on USD/JPY after price reacted from a key support zone at 144.600. This level has held firm multiple times, marked by green arrows, signaling strong buying interest.
📐 Chart Patterns & Structure:
✅ A bullish harmonic pattern (possibly a bullish Bat or Gartley) is completing near the 144.600 zone.
🔄 Multiple rejection wicks and bullish engulfing patterns indicate a potential upside reversal.
🔵 Descending trendlines have been broken, confirming momentum shift.
🔁 Previous resistance turned support (near 145.000) is acting as a possible launchpad for the next move.
🎯 Upside Target:
The projected move targets the resistance zone at 147.698, aligning with previous highs and a significant supply area.
If price breaks above 145.900 convincingly, continuation toward this resistance is expected.
🔻 Downside Risk:
A break below 144.600 would invalidate the bullish setup and expose price to the lower support range near 142.000–143.000.
📊 Conclusion:
USD/JPY is showing signs of bullish reversal from a strong demand zone. If price sustains above 145.000 and breaks the minor consolidation, the pair could rally toward 147.698 🎯.
Bias: Bullish ✅
Support: 144.600
Resistance: 147.698

Lingrid | USDJPY Breakout Could Trigger Strong Bullish RallyFX:USDJPY is approaching a retest of the 144.20–144.30 support band after rebounding from a wedge breakdown and reclaiming structure within a broader ascending formation. Price remains under the downward trendline, but a successful bounce here could fuel another push toward 146. A higher low above 144.20 would confirm bullish intent.
📈 Key Levels
Buy zone: 144.20–144.40
Sell trigger: breakdown below 144.00
Target: 146.00
Buy trigger: breakout and hold above 145.00
💡 Risks
Rejection at the downward trendline limits upside potential
Failure to hold the 144.20 base could reverse the bullish structure
JPY strength from macro news could suppress breakout attempts
Traders, if you liked this idea or if you have your own opinion about it, write in the comments. I will be glad 👩💻

USD/JPY breakthrough & long position? (novice analysis) #techFrom what I've seen so far, USD/JPY has the momentum to try to break through 146.093 and is heading towards 146-147.
The price could make a pullback around the first key level before breaking through, if not, I would anticipate the price making a retracement after breaking through
Hi, I'm not good at trading, and I'm still learning. I explore trading alone myself and also use online free sources to improve. If somewhere mistakes please notify me
Thank you.

USDJPY: Classic Bearish PatternThe USDJPY has developed a significant head and shoulders pattern on the 4-hour time frame.
We see a confirmed breach of the neckline and an intraday candle closing below it.
The pair is likely to keep falling, with the next target at 143.05.

USDJPY is about to be bearish after a long retracement From the chart, you will see that usdjpy is about to sell for a long time.
Reasons;
1] Hanging man in daily timeframe
2] Trendline violation
USDJPY Ascending channel breakdown ahead selling strong📉 USDJPY Breaks Down!
Strong sell-off from the key supply zone at 145.500 – the ascending channel has been broken on the 1H timeframe, signaling momentum shift.
🎯 Technical Targets:
🔹 1st Target: 144.000 – key demand zone
🔹 2nd Target: 143.000 – strong support level
Bearish pressure is building — price action confirms the shift. Eyes on lower zones as sellers take control. 📊
🔔 Like, Follow, and Comment your thoughts!
💬 Join us for more timely market updates and clean setups!
#USDJPY #ForexAnalysis #TechnicalTrading #PriceAction #FXSetup #LiviaTrades 😜

OANDA:USDJPY Buy SetupUSDJPY Buy Setup – Bullish Structure & Daily Rebound
USDJPY is showing signs of renewed bullish momentum after rejecting a significant daily low. Price action on the 1-hour timeframe has confirmed the formation of a higher low, followed by a clean break above a key daily support level—now turned support once again. This shift in market structure indicates a potential continuation of the uptrend, supported by higher highs and higher lows on the intraday chart.
Technical Highlights:
Strong rejection from a daily low zone
Bullish structure confirmed on the 1H timeframe
Price reclaiming a key support level and holding above it
Momentum suggests potential continuation toward higher targets
Trade Setup:
Entry: 145.110
Stop Loss: 144.754
Target Levels:
Take Profit 1: 145.709
Take Profit 2: 146.747
Take Profit 3: 148.014
This setup offers a favorable risk-to-reward ratio within a well-defined bullish context. Wait for a solid candle confirmation if not already entered, and always manage your risk according to your trading plan.
Drop your thoughts or questions in the comments, and if you found this valuable, hit boost and follow for more structured trade ideas. Wishing you precision and profits!

USDJPY Trading StrategyUSDJPY is looking to break the resistance zone of 147,000. The current bullish force of USDJPY is too strong, so jumping in to catch the top at the present time will be quite risky. If you want a SELL signal, you must wait for the confirmation of the sellers jumping into the market by the confirmation of the red closing m30 candle.
There will be a beautiful SELL signal if the h4 candle shrinks its wick below 147,000. If it closes above the SELL point, you must wait for 148,100, or if you want to BUY, wait for the retest and create a beautiful bullish wave in the small time frame.
On the other hand, if the currency pair declines back to the support zone of 146,000 and 145,200, it will give us a long-term BUY signal.
Support 146,000-145,200
Resistance 117,100-148,100

USD JPY --->>> SHORT!Sell on dollar against yen. Analysis based on the daily chart. Entry based on the hourly time frame.

USDJPY H4 Golden zone The USDJPY pair has finally reached the H4 golden Zone. M15 previous highs under threat. Are we bullish for the day

USD/JPY Long Trade Setup – Key Support Rebound Targeting 148.674Entry Point:
Price: 143.373
The chart suggests initiating a long (buy) position at this level, which is just slightly below the current market price.
Stop Loss:
Price: 141.707
Positioned below a strong support zone. This level protects the trade from excessive downside risk if the price breaks down.
Target Point:
Price: 148.674
The target is clearly defined, indicating a potential gain of approximately 5.991 points, or 4.20% from the entry.
🟪 Support/Resistance Zones
The purple boxes indicate demand (support) and supply (resistance) zones.
The lower zone (entry/stop area) shows a historically significant support range that has been tested multiple times (indicated with orange circles).
The upper purple zone marks the take-profit area, which coincides with previous resistance.
📊 Moving Averages
Blue Line: 200 EMA (Exponential Moving Average) – acting as dynamic resistance.
Red Line: 50 EMA – price is currently trading below it, indicating bearish short-term pressure but potential for reversal.
🧠 Trade Idea Summary
Bias: Bullish (long position)
Risk-Reward Ratio: Favorable
Risk: ~1.67 points (from 143.373 to 141.707)
Reward: ~5.3 points (from 143.373 to 148.674)
Approx. R:R = 1:3.17
Validation: The setup relies on the price holding the key support zone and bouncing higher, targeting the next major resistance.
⚠️ Considerations
Monitor for bullish candlestick patterns near the entry zone.
Keep an eye on macroeconomic news (like BoJ or Fed updates) that could cause volatility in USD/JPY.
Confirm momentum shift with RSI or MACD if using indicators.


Looking for an immediate rebalance on USDJPY daily chartLooking for an immediate rebalance on USDJPY daily chart

USD/JPY) Bearish reversal analysis Read The captionSMC trading point update
Technical analysis of USD/JPY 3-hour chart suggests a bearish reversal setup, based on smart money concepts (SMC), resistance rejection, and price action structure. Here's a full breakdown:
Technical Breakdown – USD/JPY
Big Resistance Zone (~145.800–146.300):
Price has tapped into a major resistance zone (yellow box) twice (highlighted with red arrows).
Both rejections indicate strong seller interest.
The latest candle structure shows clear rejection wick, signaling weakness at resistance.
---
Bearish Bias Confirmation:
Bearish structure forming after the second rejection.
Break of the rising trendline could accelerate selling pressure.
A measured move projection (-2.58%) aligns the downside target with the support level at ~142.144.
---
Support Zone (~141.800–142.400):
Marked as the likely target zone.
Historically acted as a strong bounce area (visible from late May to early June).
Completion of ABC bearish structure aligns here.
---
Indicators & Tools:
200 EMA (144.419): Price currently slightly above it — watching for a close below to strengthen bearish view.
RSI (14): Shows signs of bearish divergence and cooling off from overbought (was above 70 previously).
Volume spike during the rejection suggests institutional selling.
Mr SMC Trading point
---
Forecast Summary:
Bias: Bearish toward 142.144
Entry Idea: Look for confirmation of breakdown below trendline (~145.00)
Invalidation: Strong bullish close above 146.300 would break this idea.
---
Please support boost 🚀 this analysis)

USDJPY is about to sell down for long timeFrom the chart, you can see that usdjpy is about to sell for a long time.
Reason;
1, Third trendline touch
2, double top
3, small ascending channel
