USDJPY Correction Complete, Is the Bullish Trend Back in play?After pulling back from the recent high near 149.17, USDJPY has shown signs of strength again, rebounding off the confluence support at the ascending trendline. The bullish narrative is supported by a hawkish FOMC tone and news that a U.S. federal court temporarily blocked Trump-era tariffs. The pair now awaits upcoming U.S. economic data for further directional clarity.
🔍 Technical Outlook – Structure & Momentum
✅ Primary trend: Bullish
✅ Correction phase: Completed near CP zone and trendline
✅ Key structural areas: FVG Zone, CP Zone, and trendline remain intact
Price has responded positively from the CP Zone + OBS Buy Zone around 147.438, aligning with the uptrend line. As long as this structure holds, buyers may push the market toward the next resistance zones.
🧭 Trade Scenarios
🔸 Bullish Bias (preferred scenario):
As long as price holds above 147.438, we expect continuation toward the FVG zone, with immediate targets at the GAP + OBS Sell Zone (148.703) and extended potential to the Buy-side Liquidity zone at 149.122.
A clean breakout above 149.122 opens the door to Fibonacci extensions: 149.72 and 150.05.
🔹 Bearish Scenario (if invalidated):
If price breaks below 147.438 and loses the trendline, we may see a deeper drop toward the Liquidity Buy Zone at 146.825, where strong buying interest is expected to re-enter the market.
⚠️ Macro Risk Drivers
Hawkish FOMC minutes continue to support USD strength
Paused trade tariffs reduce political headwinds, improving risk sentiment
Upcoming U.S. economic data could trigger sharp intraday moves → watch closely
📌 Key Price Zones
Liquidity Buy Zone 146.825 Major long re-entry zone
CP + OBS Buy Zone 147.438 Current active support
FVG Zone 148.20 – 148.68 Intraday bullish target
GAP + OBS Sell Zone 148.703 Short-term resistance
Buy-side Liquidity Zone 149.122 Final bullish objective
💬 Structure remains bullish unless the trendline breaks. Stay patient, wait for confirmations at key zones, and follow your plan with disciplined risk management.
USDJPY trade ideas

Japan's coalition loses majority, yen higherThe Japanese yen has started the week with strong gains. In the European session, USD/JPY is trading at 147.71, down 0.07% on the day.
Japanese Prime Minister Ishiba's ruling coalition failed to win a majority in the election for the upper house of parliament on Sunday. The result is a humiliating blow to Ishiba, as the government lost its majority in the lower house in October.
The stinging defeat could be the end of the road for Ishiba. The Prime Minister has declared he will remain in office, but there is bound to be pressure from within the coalition for Ishiba to resign.
The election result was not a surprise, as voters were expected to punish the government at the ballot box due to the high cost of food and falling incomes. The price of rice, a staple food, has soared 100% in a year, causing a full-blown crisis for the government, which has resorted to selling stockpiled rice from national reserves to the public.
The election has greatly weakened Ishiba's standing, which is bad news as Japan is locked in intense trade talks with the US. President Trump has warned that he will impose 25% tariffs on Japanese goods if a deal isn't reached by August 1. Japan is particularly concerned about its automobile industry, the driver of its export-reliant economy.
The Bank of Japan meets on July 31 and is widely expected to continue its wait-and-see stance on rate policy. The BoJ has been an outlier among major central banks as it looks to normalize policy and raise interest rates. However, with the economic turbulence and uncertainty due to President Trump's erratic tariff policy, the Bank has stayed on the sidelines and hasn't raised rates since January. Japan releases Tokyo Core CPI on Friday, the last tier-1 event before the rate meeting.
There is resistance at 148.39 and 149.08
147.95 and 147.70 are the next support levels
USDJPY short position 22/07/2025English : According to our analysis, we anticipate a bearish scenario.
Morocan Darija : kanchofo d'apres l'analyse dyalna antsanaw hboot
ATENTION : I only share my ideas, not signals

USDJPY Analysis : Trendline Breakout, Liquidity Trap & MMC Zone🔍 Full Technical Breakdown:
In today’s USDJPY 2H chart, the market is unfolding exactly as per Mirror Market Concepts (MMC). We’ve identified a clean trendline breakout, and now price is reacting between the Central Zone (50%) and the Next Reversal Zone, where liquidity is expected to be filled. Let's break down each zone and movement to understand how price is being manipulated and where we can take action.
🔵 1. Trendline Confirmation – The First Sign of Strength
The trendline was tested multiple times from the top, acting as resistance. But recently, price broke above this line with strength, signaling a potential bullish reversal. You've rightly marked it as "Trendline Confirmation" — this is where structure shifted from bearish to bullish.
This is a classic MMC principle — breakout above manipulated resistance, followed by a pullback for re-entry.
The breakout wasn’t just a wick; it had body strength, indicating real buyer presence.
Now, price is pulling back to retest the trendline from above, a typical MMC behavior before continuing upward.
⚖️ 2. Central Zone – The 50% Trap
This zone represents the midpoint of the last major impulsive move. It's where most traders get confused, and institutions re-balance their entries.
You've highlighted: “It Can Reverse From Its 50% Zone” – and that’s accurate.
According to MMC, this is where smart money traps late sellers, takes liquidity, and initiates the next bullish leg.
If price holds above the 147.200–147.500 zone, we could see buyers stepping in aggressively.
🟩 3. Liquidity Fill – Next Reversal Zone
If price doesn’t hold the Central Zone, we don’t panic — this is where MMC becomes powerful.
Beneath current structure lies liquidity — previous stop hunts and unfilled orders.
That area is your Next Reversal Zone around 146.200–146.400.
It’s a liquidity trap — market might dip there just to manipulate emotional traders, then reverse with force.
This is exactly where you’ve written “Liquidity Will Fill” — meaning smart money might fill orders there before moving up.
🧭 Possible Price Paths:
🔼 Bullish Scenario (High Probability):
Trendline retest holds as support.
Price bounces from the 50% Central Zone.
Targets: 148.800 – 149.200 (previous highs and clean breakout zone).
Confirmation: Bullish engulfing candle or strong wick rejection at Central Zone.
🔽 Bearish Trap Scenario (MMC-Based):
Price dips below Central Zone into liquidity zone.
Traps sellers and triggers stop-losses.
Reverses sharply from Next Reversal Zone (Liquidity Zone).
This is where smart money positions themselves for the real move up.
🧠 MMC Insight:
This structure is textbook MMC – clean manipulation zones, false breakout traps, and a trending bias powered by smart liquidity plays.
Trendline breakout = initial intent
Central zone = confusion zone
Liquidity trap = entry for smart money
📢 The goal is not to predict, but to react with precision when the market reveals its hand.
🕒 Timeframe: 2H
📌 Strategy: Mirror Market Concepts (MMC) | Trendline + Liquidity + Midpoint Trap
📈 Bias: Bullish, but waiting for confirmation at either Central or Liquidity Zone
🔍 Sentiment: Cautiously Optimistic

146.6 gap hike. With all of the other pairs basically closing their gap against JPY, the only one left is usd!

USDJPY InsightHello to all our subscribers!
Please feel free to share your personal opinions in the comments. Don’t forget to hit the boost and subscribe buttons!
Key Points
- There were speculations that the Liberal Democratic Party’s election defeat in Japan could lead to Prime Minister Ishiba’s resignation. However, Ishiba announced that he will remain in office, easing concerns and reducing political risk.
- U.S. Treasury Secretary Scott Bessent stated that negotiations are progressing swiftly but emphasized there is no rush to reach a deal. Meanwhile, U.S. Commerce Secretary Howard Lutnick commented that reciprocal tariffs will proceed as scheduled, although negotiations can still continue.
- With the FOMC meeting scheduled for July 31, attention is focused on Fed Chair Powell’s speech on July 22, which is expected to provide clues about the future path of monetary policy.
Key Economic Events This Week
+ July 22: Fed Chair Powell’s speech
+ July 24: ECB interest rate decision
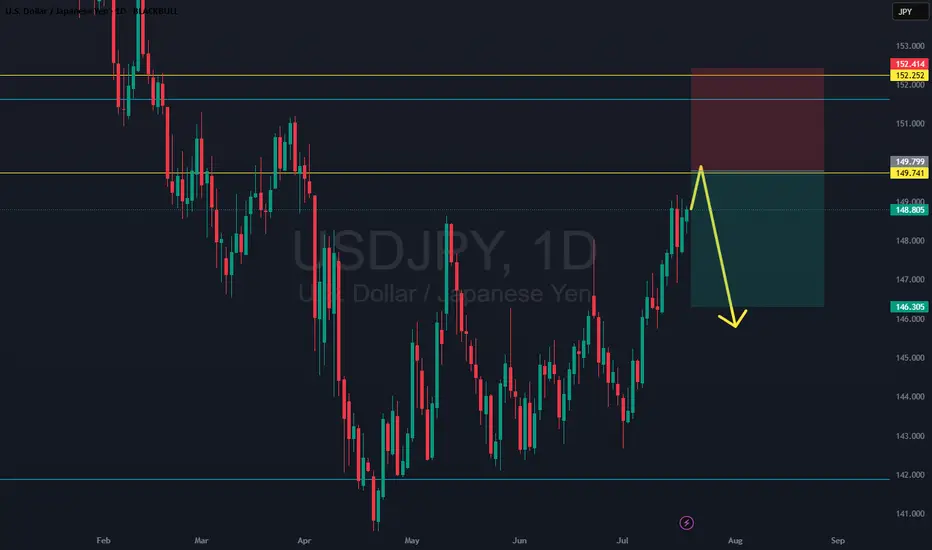
USDJPY Chart Analysis
After breaking above the 148 level and extending gains to the 149 level, the pair quickly reversed and pulled back to the 147 level. Currently, a further decline toward the 146 level appears likely, with strong support expected there. If confirmed, a rebound toward the 151 level is highly probable. However, if price action deviates from expectations, we will promptly revise our strategy.

USDJPY - Bullish Bias, In OB ZonePair: USDJPY (UJ)
Bias: Bullish
HTF Overview: Bullish structure remains intact — price currently pushing upward, respecting higher timeframe flow.
Current Zone: Price is now sitting within the 30M OB, showing potential strength but no LTF confirmation yet.
LTF Confirmation: Still in analysis mode — sitting on hands, waiting for clean reaction on 5M or 1M before considering entries.
Entry Zone: 30M OB being monitored closely — ideal setup would include inducement and clear shift before entry.
Targets: Next 1H high remains the first target — extended targets to be trailed if momentum builds.
Mindset Note: Analysis first, execution second. Discipline is the edge — no rush until LTF gives the green light.
Bless Trading!

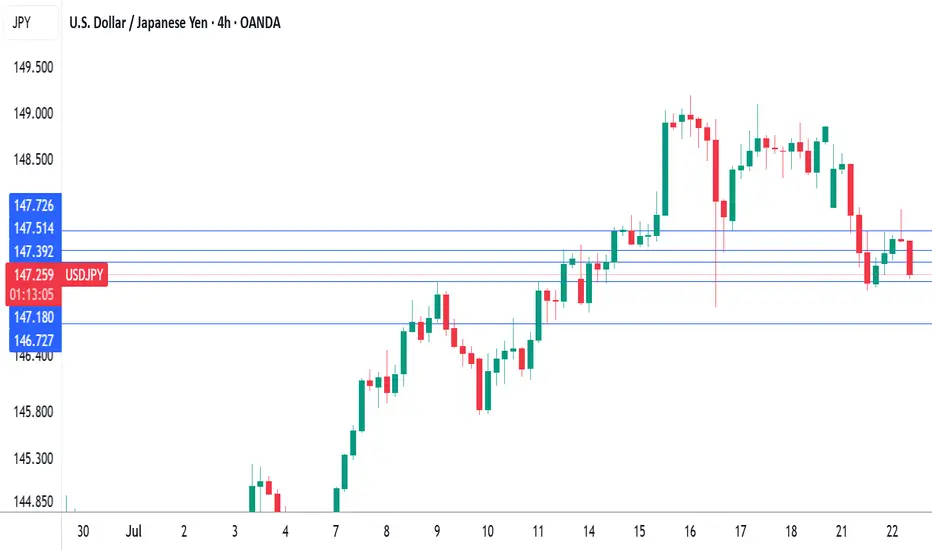
USDJPY - M15 Downtrend with Supply Zone RetestThe USD/JPY market currently exhibits a downtrend with price rebounding slightly from recent lows. The key focus is the Lower Time Frame (LTF) Supply Zone around 148.2, which acts as a strong resistance level.
The trading plan anticipates the price to rise into this LTF Supply Zone, where selling pressure is expected to resume, leading to a continuation of the downward trend. The ultimate target is near the previous strong low around 146.8, representing a potential demand zone and support level.
This plan suggests watching for price action signals such as rejection wicks or bearish candlestick patterns within the supply zone to confirm entries for short positions. Managing risk involves placing stop losses just above the supply zone to protect against unexpected breakouts.

USDJPY TREND REVERSAL TRADELooking at 4h chart, our short term bearish channel has been broken indicating a possible reversal. Waiting for this sell setup to trigger. Let me know your thoughts.

USD/JPY Drops as Market Awaits Powell's RemarksIn today’s trading session, the USD/JPY pair is showing renewed weakness, currently trading around 147.76 — down more than 0.68% from the previous session. The decline is driven by falling U.S. Treasury yields and cautious investor sentiment ahead of an upcoming speech by Federal Reserve Chair Jerome Powell, which is weighing on the U.S. dollar.
From a technical perspective, USD/JPY has broken its short-term uptrend and is approaching a key support level at 147.60. If this level fails to hold, the bearish momentum could extend further.

USDJPY (Weekly analysis) 22/07hi everyone please see the weekly analysis i did not do one yesterday as it was a bank holiday in JPY. happy trading everyone


Japan's coalition loses majority, yen higherThe Japanese yen has started the week with strong gains. In the European session, USD/JPY is trading at 147.71, down 0.73% on the day.
Japanese Prime Minister Ishiba's ruling coalition failed to win a majority in the election for the
upper house of parliament on Sunday. The result is a humiliating blow to Ishiba, as the government lost its majority in the lower house in October. The stinging defeat could be the end of the road for Ishiba. The Prime Minister has declared he will remain in office, but there is bound to be pressure from within the coalition for Ishiba to resign.
The election result was not a surprise, as voters were expected to punish the government at the ballot box due to the high cost of food and falling incomes. The price of rice, a staple food, has soared 100% in a year, causing a full-blown crisis for the government, which has resorted to selling stockpiled rice from national reserves to the public.
The election has greatly weakened Ishiba's standing, which is bad news as Japan is locked in intense trade talks with the US. President Trump has warned that he will impose 25% tariffs on Japanese goods if a deal isn't reached by August 1. Japan is particularly concerned about its automobile industry, the driver of its export-reliant economy.
The Bank of Japan meets on July 31 and is widely expected to continue its wait-and-see stance on rate policy. The BoJ has been an outlier among major central banks as it looks to normalize policy and raise interest rates. However, with the economic turbulence and uncertainty due to President Trump's erratic tariff policy, the Bank has stayed on the sidelines and hasn't raised rates since January. Japan releases Tokyo Core CPI on Friday, the last tier-1 event before the rate meeting.

USDJPY Is Very Bullish! Buy!
Here is our detailed technical review for USDJPY.
Time Frame: 1D
Current Trend: Bullish
Sentiment: Oversold (based on 7-period RSI)
Forecast: Bullish
The market is approaching a significant support area 144.493.
The underlined horizontal cluster clearly indicates a highly probable bullish movement with target 148.651 level.
P.S
Overbought describes a period of time where there has been a significant and consistent upward move in price over a period of time without much pullback.
Disclosure: I am part of Trade Nation's Influencer program and receive a monthly fee for using their TradingView charts in my analysis.
Like and subscribe and comment my ideas if you enjoy them!

USDJPY SELL
USD/JPY
Editorial Tools Latest
USD/JPY Forecast and News
share
Join
NEW
Japanese Yen hangs near multi-month low against USD ahead of Japan election on Sunday
The Japanese Yen drifts lower against its American counterpart for the second straight day on Friday and remains within striking distance of an over three-month low touched earlier this week. Investors now seem convinced that the Bank of Japan (BoJ) would forgo raising interest rates this year amid worries about the economic fallout from higher US tariffs
From a technical perspective, the USD/JPY pair showed some resilience below the 100-hour Simple Moving Average (SMA) earlier this week, and the subsequent move up favors bullish traders. Moreover, oscillators are holding comfortably in positive territory and are still away from being in the overbought zone. However, the overnight failure to build on the momentum beyond the 149.00 mark warrants some caution. Hence, it will be prudent to wait for some follow-through buying beyond the 149.15-149.20 region, or a multi-month peak, before positioning for a move towards reclaiming the 150.00 psychological mark.
On the flip side, the 148.20-148.25 region, or the 100-hour SMA, could offer immediate support ahead of the 148.00 mark. Some follow-through selling, leading to a slide below the 147.70 area, could make the USD/JPY pair vulnerable to accelerate the fall towards testing sub-147.00 levels. Acceptance below the latter might shift the bias in favor of bearish trades and drag spot prices to the 146.60 intermediate support en route to the 146.20 area, the 146.00 mark, and the 100-day SMA, currently pegged near the 145.80 region
1 SUPPORT147.642
2 SUPPORT 147.311
3 SUPPORT 146917
1 RESISTANCE 148.206
2 RESISTANCE 147.972

0721 Impact of Japanese Senate Elections on Yen Exchange Rate Hello traders,
1. I spent the entire weekend following the Japanese Senate elections, as they will determine the fluctuations of the world's largest financing currency—the yen exchange rate.
★ The results are out, and we are currently in scenario two— the ruling coalition suffered a crushing defeat + Shigeru Ishiba refuses to resign. However, senior figures within the Liberal Democratic Party, such as Taro Aso, have publicly stated that they intend to demand Prime Minister Ishiba's resignation for accountability, increasing the pressure on Ishiba to step down. This means we might see "scenario three"—the USD/JPY exchange rate could potentially break through the 151-155 range.
★ Is this the worst-case scenario? Of course not. The worst-case scenario would be if the "far-right party" that campaigned on the slogan "Japan First" achieved a landslide victory in this election. The most notable winner is a marginal far-right party known as the "Reform Party."
The Reform Party originated from a YouTube channel during the pandemic, which spread conspiracy theories about vaccines and "global elite conspiracies." NHK estimates that the Reform Party will win up to 22 seats, whereas three years ago, they had only 1 seat in the Senate and currently have only 3 seats in the House of Representatives.
✔ Let's take a look at this big winner's political proposals—stricter immigration restrictions + opposition to globalism + opposition to radical gender policies + reassessment of decarbonization and vaccine policies + massive tax cuts + increased social welfare spending. This means Japan may implement more "radical tax cuts" combined with aggressive economic stimulus through quantitative easing, leading to a more severe depreciation of the yen, increasing the likelihood of the USD/JPY exchange rate rising to the 160 range.
★ What are the risks of a sharp depreciation of the yen?
For Asia, the depreciation of the yen typically drags down other Asian currencies collectively, especially under U.S. tariff pressures, where Asian currencies are already under devaluation pressure. A strong depreciation of the yen would mean Japan is taking other Asian countries along with it off a cliff. We need to pay attention to the "passive" depreciation of the renminbi.
Asia will feel the pain, but Europe and the U.S. will also suffer. Theoretically, if the USD/JPY exchange rate surges (indicating a sharp depreciation of the yen), it is very advantageous for arbitrage trading with leverage (because the yen becomes cheaper). However, when the yen experiences a severe depreciation, the situation changes.
Let me give you a classic example: After Shinzo Abe returned to power at the end of 2012, he launched the "three arrows" economic policy: unlimited quantitative easing monetary policy + fiscal stimulus + structural reform = artificially lowering the yen exchange rate to stimulate exports (the clear goal was to increase the USD/JPY exchange rate) = rapid depreciation of the yen (from 80 in 2012 to 125 in 2015).
So what happened then? — A large number of Japanese institutions sold off U.S. bonds, European bonds, and REITs to cash out. The reason is simple:
✔ Japanese financial institutions (such as GPIF, insurance companies, and banks) hold a large amount of dollar/euro assets. When the yen depreciates, the yen-denominated market value of these foreign currency assets skyrockets. Selling off overseas assets is equivalent to cashing out foreign exchange gains in advance.
✔ The proportion of foreign currency assets is too high → must rebalance. Due to the yen depreciation, a large institution that originally allocated 20% of its total assets to foreign currency assets might see that proportion swell to 30% or 40%. This triggers asset allocation restrictions within pension and insurance funds (ALM principles), necessitating the sale of overseas assets and reallocation to yen-denominated assets.
✔ The yen depreciation phase is usually accompanied by an expansion of the U.S.-Japan interest rate differential. If Japanese institutions hedge their dollar assets, the hedging costs become very high (the costs of hedging through FX swaps and forwards rise), so they must also sell off some assets to reduce exposure. Therefore, in 2013, there was a collective sell-off of U.S. and European bonds.
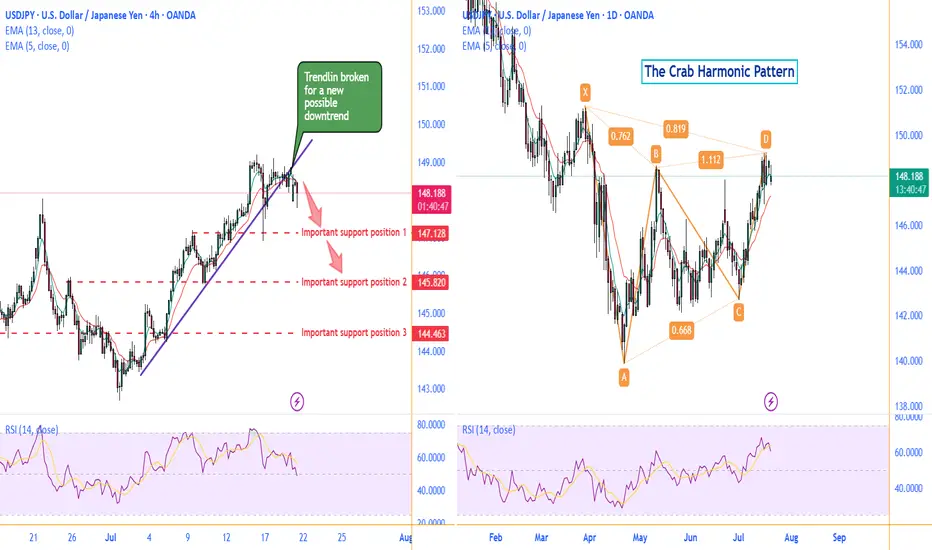
Technically:
Daily chart, there is a possible Crab Harmonic Pattern.
The Crab Harmonic Pattern
From the chart, we can see:
The upward move from A to B is labeled as 0.762, which falls within the Fibonacci ratio range of 0.618-0.786 for the A-B leg of the Crab pattern.
The downward move from B to C is labeled as 0.668, which also falls within the Fibonacci ratio range of 0.382-0.886 for the B-C leg of the Crab pattern.
The upward move from C to D is labeled as 1.112, which corresponds to the Fibonacci ratio range of 1.13-1.272 for the C-D leg of the Crab pattern.
Based on these Fibonacci ratio relationships, we can identify this price action pattern as a typical Crab harmonic pattern. This type of pattern often suggests that the price may be about to reverse.
On the left 4H chart, the broken trendline is suggesting a new possible downtrend to begin .
Make a good use of those support positions, sellers of UJ could find a great trade deal.
Follow me to get more update on UJ.
GOOD LUCK!
LESS IS MORE!
USDJPY: Range-on-Range SetupUSDJPY remains in a broader uptrend but has recently stalled after breaking out of multiple ranges. This setup targets a short-term move as price attempts to test the top of a lower timeframe range—likely the daily. We're trading within nested ranges here, looking to catch a small piece of the move before higher timeframe resistance steps in.
USDJPY - Bullish Structure in Play• Pair: USDJPY (UJ) • Bias: Bullish • HTF Overview (4H): • Clean external break to the upside confirms bull control heading into the new week. • Structure shift is undeniable — market bias is now favoring continued strength.
• MTF Refinement (30M): • Zoomed in to the 30M and identified internal liquidity (SSL) taken out. • Strong mitigation of internal OB followed. • Still in analysis mode — no trades taken yet.
• LTF Confirmation (5M): • Waiting on a refined CHoCH (marked by green lines at highs). • Once that prints and rules align, I’ll shift into trader mode for the execution.
• Entry Zone: • 30M OB mitigation + LTF (5M) CHoCH confirmation.
• Mindset Note: • Patience is the play. No guessing, no hesitation — just clean reads and precision strikes. • Analysis first, execution second. That’s the system.
Bless Trading!

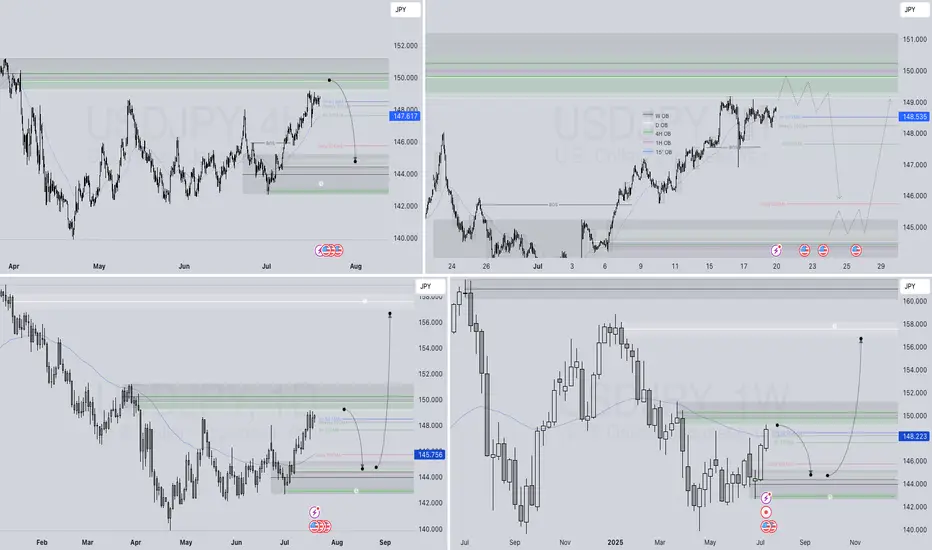
USDJPY – WEEKLY FORECAST Q3 | W30 | Y25📊 USDJPY – WEEKLY FORECAST
Q3 | W30 | Y25
Weekly Forecast 🔍📅
Here’s a short diagnosis of the current chart setup 🧠📈
Higher time frame order blocks have been identified — these are our patient points of interest 🎯🧭.
It’s crucial to wait for a confirmed break of structure 🧱✅ before forming a directional bias.
This keeps us disciplined and aligned with what price action is truly telling us.
📈 Risk Management Protocols
🔑 Core principles:
Max 1% risk per trade
Only execute at pre-identified levels
Use alerts, not emotion
Stick to your RR plan — minimum 1:2
🧠 You’re not paid for how many trades you take, you’re paid for how well you manage risk.
🧠 Weekly FRGNT Insight
"Trade what the market gives, not what your ego wants."
Stay mechanical. Stay focused. Let the probabilities work.
FRGNT FOREX ANALYSIS 📊

CARRY TRADE RISK IT IS SHOWING CRACKSThe chart posted in my work on TSXV:USS yen I have NOT CHANGED THE WAVE STRUCTURE AT ALL take notice of my statement CRASH COMING

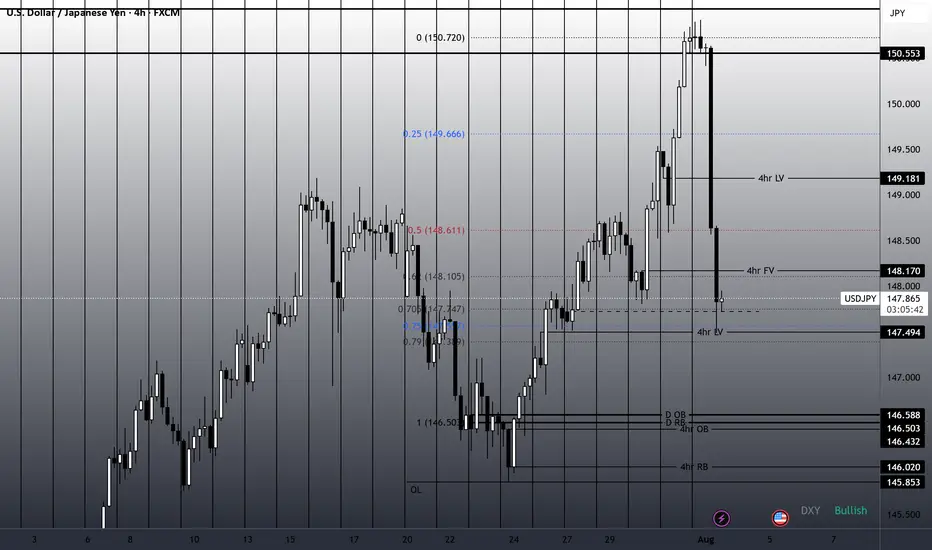
304-PIP Move on USDJPY in One Day - Trading NFP ProfitablyOn August 1st, USDJPY experienced a massive 304-pip drop after a strong impulse into the daily order block. From there, the daily order block was respected, and the retracement was induced by the USD Non-Farm Payrolls news release, leading to a sharp move down to a four-hour liquidity void, hitting the 75% Fibonacci retracement level.
This move highlights the precision of combining institutional levels with news catalysts, capturing a significant move in a short timeframe.
This is Outlier Trading Folks.
USD/JPYThis is a trade setup for USD/JPY, based on volume and trend analysis.
Entry Price: 150.360
Stop-Loss (SL): 150.740
Take-Profit (TP): 149.963
The trade is intended to be executed instantly at the mentioned price, in alignment with both volume behavior and the current trend direction.
Disclaimer: This setup is shared purely for backtesting purposes and to document trade ideas. It is not financial advice. Always perform your own analysis before making any trading decisions.
