USDJPYDate:
July 22,2025
Session:
Tokyo and London session
Pair:
USDJPY
Bias:
Long
1. Clean liquidity pool left unswept from last week's NYC Open (Thursday).
Took this trade earlier today but looks like price wanted to consolidate in the liquid pool its currently in. I still hold the same idea and think the sweep will definitely take place sometime this week. Now looks like the perfect time to enter. If Asia session cant get it done its up to London and New York session.
Entry:147.534
Stop Loss:147.215
Target:148.768
RR:3.89
USDJPY trade ideas


USDJPYUSDJPY showing short-term bearish momentum due to potential pullback and risk-off sentiment, but the long-term outlook remains bullish supported by U.S.–Japan rate differentials and BoJ's dovish stance.


USDJPY ShortPrice in currently on a downtrend on the 4H timeframe. Price formed an orderblock on the 15 min timeframe and a FVG on the 15 min timeframe after the orderblock had formed. Stoploss is at 147.580 and take profit is at 147.160

USD/JPY probable move Target 1 waiting for confirmationWaiting for confirmation on candles and Real Volume 5min or 15min (power of Real Volume)-without real volume I am like a blind man in a dense forest :)
Tools:
- real volume (proper interpretation)
- Fibonacci expansion ABC (an additional, new goal every day)
- Fibonacci retracement (combined with the real volume, it shows me the real probable movement for the next hours and days)
- volume support and resistance levels (confirmation of the price recovery level)
- oversold/overbought index (focusing on 1H and 4H something is already overvalued or undervalued)
- candlestick patterns (my entry point for 5 minutes or 15 minutes candlestick formations confirmed by particularly increasing volume).

Yen Holds Firm as Ishiba Stays in OfficeThe yen hovered around 147.5 per dollar on Tuesday, holding its 1% gain as markets digested Japan’s election outcome. Despite the ruling coalition losing its upper house majority, Prime Minister Shigeru Ishiba is likely to stay in office, easing political concerns. Ishiba confirmed his continued involvement in US trade negotiations. Meanwhile, opposition parties are expected to advocate for fiscal stimulus and tax cuts, which could pressure the yen and push bond yields higher. Trade discussions with the US remain on schedule for the August 1 deadline.
Resistance is at 147.75, with major support at 146.15.
Fundamental analysis: JPY strength and TV show recommendation The outcome of the Japanese election has created JPY strength. If you placed a short term JPY long based on the election, I would find it difficult to argue. But, personally, I think any JPY strength will be short lived. Essentially due to uncertainty creating a likelihood of a slower pace of BOJ rate hikes (If at all). Meaning, JPY short trades back on the table soon.
Whilst I await a 4hr swing with a 'push up' on JPY charts (for a JPY short). I'd like to recommend a very interesting TV programme I recently watched called FINDING THE MONEY.
Depending on your region you might be able to watch it for free., Living in the UK, I paid about £6 to watch it via Amazon prime.
It won't necessarily make you a better trader, it's just a very interesting watch, particularly if you're curious about the concept of M.M.T and the workings of the financial system.
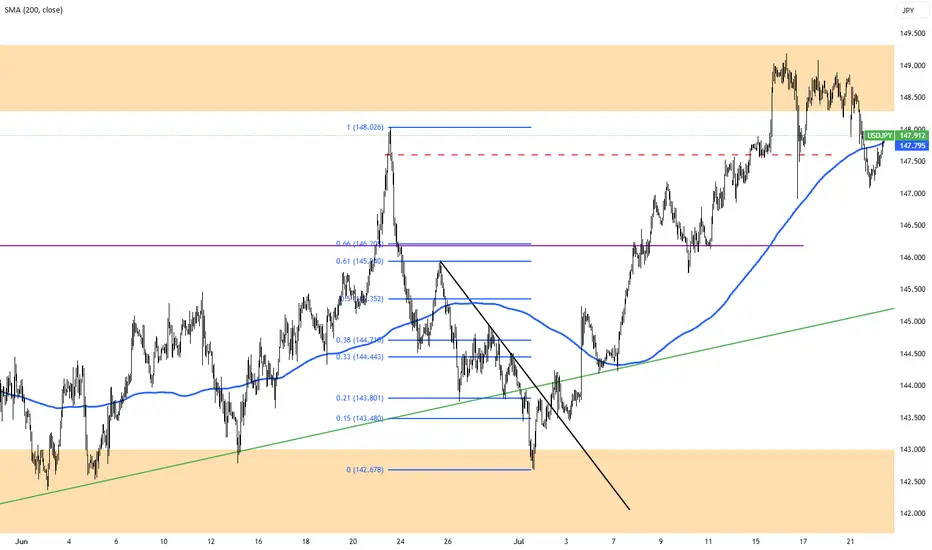
USD/JPY Bearish Reversal Setup with Key Targets and Stop LossThis 4-hour USD/JPY chart suggests a bearish setup. Price has rejected the order block near 149.220 and is heading downward. A support level is marked at 145.268, with the target around 142.637. A stop loss is set above the order block, indicating a short trade setup expecting a continued drop.

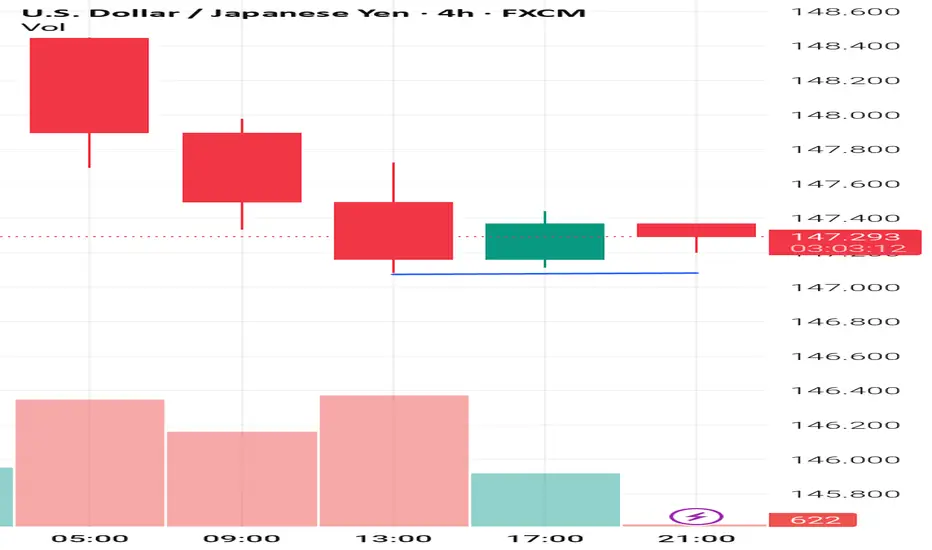
USDJPY Support & Resistance Levels🚀 Here are some key zones I've identified on the 15m timeframe.
These zones are based on real-time data analysis performed by a custom software I personally developed.
The tool is designed to scan the market continuously and highlight potential areas of interest based on price action behavior and volume dynamics.
Your feedback is welcome!

USDJPY BREAKOUT IN H1 Price just broke out of the trendline that was formerly serving as support. A sell opportunity is envisaged from the current market price. Target profit is at 146.207

USDJPY sell1. price created a double top near the premium zone
2. price moved down and broke the bullish trendline and closed below it
3. Created a new bearish trendline with multiple touches confirming that that the bullish move has ended
Entry idea:
will wait for price to pullback into the 50% zone fora limit order or alternatively wait for price to be overbought with a stochastic cross to enter at market order then exit/TP at the next available order block

USD/JPY Faces Rejection at 148.6, Bearish Setup EmergesFenzoFx—USD/JPY began a bearish wave after the 148.6 resistance rejected the price. As of this writing, the currency pair flipped below the ascending trendline and formed a bearish FVG at 147.9.
A pullback toward the FVG can provide a premium price to go short on USD/JPY, targeting 146.9, followed by 145.7.

USDJPY short position 21/07/2025English : According to our analysis, we anticipate a bearish scenario.
Morocan Darija : kanchofo d'apres l'analyse dyalna antsanaw hboot
ATENTION : I only share my ideas, not signals

USD/JPY Analysis by zForex Research Team - 07.21.2025Yen Recovers After Japan’s Upper House Election
The Japanese yen rose to around 148.5 per dollar on Monday, recovering some of last week’s losses after the ruling coalition lost its upper house majority. Markets had mostly priced in the result, limiting the reaction. Prime Minister Ishiba is expected to remain in office, which could ease concerns over political instability.
The opposition is likely to push for more spending and tax cuts, which could pressure the yen and lift bond yields. The election outcome comes as Tokyo continues trade talks with Washington. US Commerce Secretary Lutnick confirmed the August 1 tariff deadline but said negotiations will continue.
For the yen, resistance stands at 149.30, followed by 151.50, with the next key level at 155.00. Support is located at 147.50, with further levels at 146.15 and 145.30.

New Buy Signal> 📌 **Risk-to-Reward Ratio**:
> From entry to SL: 120 pips
> From entry to TP1: 80 pips
> From entry to TP2: 130 pips
> RR to TP2 = **1 : 1.08** (realistic and safe in this volatile structure)

Fundamental Market Analysis for July 21, 2025 USDJPYThe pair opened the week near 148.500, clawing back ground after Sunday’s upper‑house election saw Japan’s ruling LDP‑Komeito coalition lose its majority. The outcome clouds the fiscal outlook and raises the probability of additional stimulus, a combination that tends to undermine the yen as investors anticipate higher public borrowing and a looser policy mix.
At the same time, subdued inflation and stagnant real wages have pushed expectations of Bank of Japan tightening into late‑2025 at the earliest. With the 10‑year US‑Japan yield gap hovering near yearly highs, capital continues to flow from low‑yielding JGBs into higher‑yielding US assets, reinforcing dollar demand against the yen.
Dollar strength is also underpinned by persistent tariff worries and a Federal Reserve that maintains a cautious stance rather than rushing to cut rates. Given these fundamentals, USDJPY could retest the psychological 150.000 barrier, while dips below 147.500 are likely to be viewed by the market as opportunities to re‑establish long positions rather than the start of a deeper correction.
Trading recommendation: BUY 148.500, SL 147.500, TP 149.500

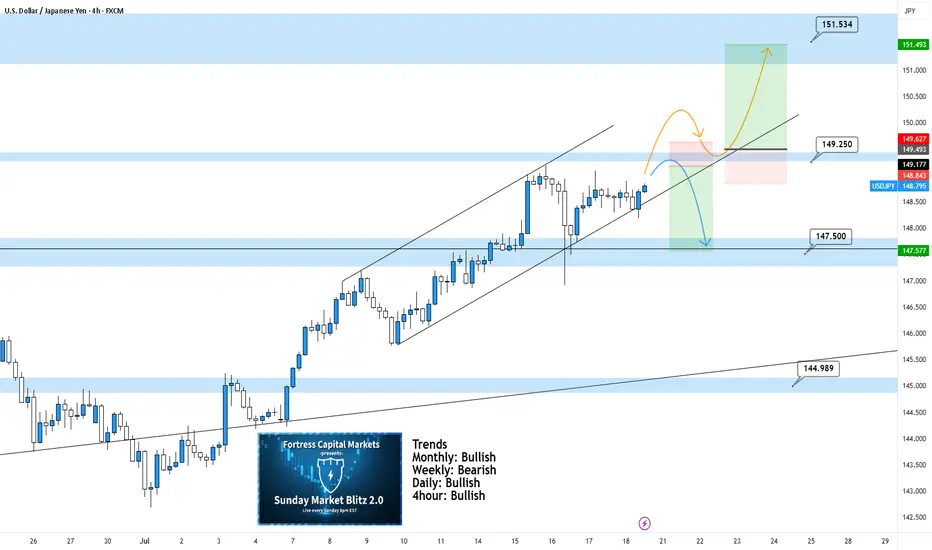
USDJPY 4Hour TF - July 20th,2025USDJPY 7/20/2025
USDJPY 4Hour Neutral Idea
Monthly - Bullish
Weekly - Bearish
Daily - Bullish
4Hour - Bullish
UJ is looking better than a couple weeks ago and at least we can spot some decent setups for the week ahead. These are NOT perfect setups but we have two scenarios that we are ready for if price action shows it is ready too. Here are the two scenarios we’re looking at for the week:
Bullish Continuation - We can see UJ in a nice 4hour channel but we are currently seeing a bit of flat price action. For us to consider UJ long setups again we would need to be convinced. Look for a break above our 149.250 zone with a confirmed higher low above. This would be enough to consider longs and target higher toward key levels of resistance.
Bearish Reversal - If price action continues to stall, this bearish setup will become more and more likely. Ideally, we want to see some strong rejection from our 149.250. If this happens look to target lower toward 147.500.
Buy usdjpyStrong buy continues
Still not complete its bullish correction
It can retrace a few pips from market levels but long term buy expected

USDJPY BUY CONTINUATIONBroke out of daily resistance zone, made retest of both zone and 50EMA. H1 has a minor resistance that needs a clear breakout before looking for buying signals.

USD JPY shortthe long term trend is long but who know what trump has under his sleeve , so a lower high suggest there is chance of a mid term correction , or as its kind of more possible it can break above and make newer highs again ... if so consider buy opportunities for next week ...
Please note: This is for educational purposes only and not a trading signal. These ideas are shared purely for back testing and to exchange views. The goal is to inspire ideas and encourage discussion. If you notice anything wrong, feel free to share your thoughts. In the end, to learn is to share !

USDJPY ready to fire with 1:6 risk rewardWatch out USDJPY ready to fire on charts 15 min mass done pull back of Fib until .50 of previous swing I believe it should fall after touching 149.39. until then its good swing for upside.
1:6 risk reward is possible here
I'm not professional please do your own research before entering the trade.

USD/JPY FORCAST🟦 Time Structure Analysis – USD/JPY | The 3-6-9 Temporal Cycle
📌 Price can lie. But time never does.
While many traders rely on price action or Elliott Wave counts, I take a different route — I trade time. Why?
Because time sets the rhythm, and the rhythm defines everything.
🔄 The 3-6-9 Time Cycle
Every complete market movement follows a hidden structure based on natural timing laws
In the current month, July 2 was the entry gate. That’s where I anchor the beginning of the new cycle.
⏳ Why Time Wins Over Price
Indicators lag
Price patterns repaint
But time never repaints.
Once the temporal cycle is locked in, it dictates future market rhythm.
You can identify where the market must move next — not by guessing the price level, but by counting time bars from a known pivot.
---
⚡ Strategy in Practice
In my system, I use:
✅ Cycle Lines starting from key reversal points
✅ Fixed monthly gates as temporal anchors
✅ Bar counting based on 3-6-9 geometry
✅ Fractal validation from higher timeframes
This gives me a predictive edge based on time pressure, not price patterns.
🎯 “The market doesn’t move because of buyers and sellers...
It moves because of time.”
Time is the structure. Price is just the effect.
