USD/JPY(20250718)Today's AnalysisMarket news:
① Kugler: It is appropriate to keep the interest rate policy stable for "a while".
② Daly: Whether to cut interest rates in July or September is not the most critical.
③ Bostic: It may be difficult to cut interest rates in the short term.
Technical analysis:
Today's buying and selling boundaries:
148.45
Support and resistance levels:
149.80
149.30
148.97
147.93
147.61
147.10
Trading strategy:
If the price breaks through 148.97, consider buying in, the first target price is 149.30
If the price breaks through 148.45, consider selling in, the first target price is 147.93
USDJPY trade ideas

Good setup to short USDJPYRecently the risk emotions caused by the White House and inflation worries it produced drives long term US Treasury yields rising, with 20-yr yield cross up to 5% once again.
Yet, you can see that the yield difference are still at a dropping trend. Moreover, the Fed is expected to cut 125 bps in the next 15 months according to the swap market.
Combined with the techincal levels, it's a good price to get into a short position of USDJPY. I don't know about you guys. I'm in

Yen Falls on Weak Trade DataThe Japanese yen weakened to around 148 per dollar on Thursday after disappointing trade data fueled concerns of a technical recession. June’s trade surplus came in at JPY 153.1 billion, well below the JPY 353.9 billion forecast and JPY 221.3 billion from a year earlier. Exports dropped 0.5% YoY, the second straight monthly decline, mainly due to the fallout from U.S. tariffs.
These signs have heightened fears of another quarterly contraction for Japan.
Resistance is at 147.75, with major support at 146.15.
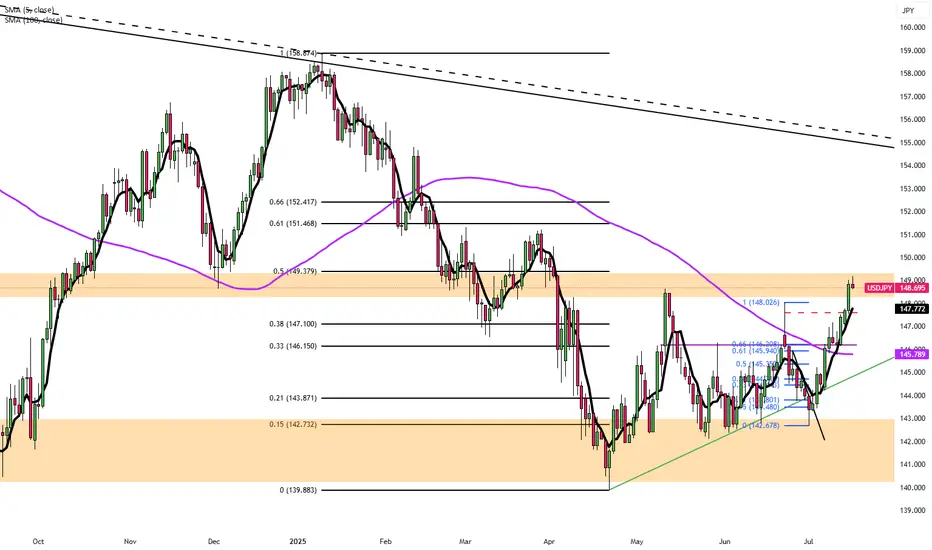
Dollar-yen remains at a crossroadsUSDJPY gained more strongly than most other major pairs with the dollar in the aftermath of June’s higher American inflation. One of the key factors here seems to be generally disappointing trade data from Japan and rising concern in some quarters of a technical recession; weaker economic figures challenge the prevailing expectations that the BoJ will continue to hike rates, but a hike on 31 July still seems fairly likely.
¥149, also the area of the 200 SMA, is a key area: a close above there might signal a push up to ¥150 or possibly even higher. However, the price still hasn’t clearly broken above the previous resistance of the 38.2% weekly Fibonacci retracement slightly above ¥148. Another close above there with higher volume of buying might give more confidence of further gains.
There isn’t an obvious short-term support. ¥147, the limit of 16 July’s tail, is a possibility, but this isn’t confirmed. The 20 SMA is a lot lower; a move beyond there into the value area with the 50 and 100 SMAs seems very unlikely for now unless there’s major surprising news of tariffs or expectations for monetary policy shift dramatically.
This is my personal opinion, not the opinion of Exness. This is not a recommendation to trade.

Yen Weakness Deepens as Dollar Strength ResurfacesThe Japanese Yen continues to struggle, extending its multi-session decline against the U.S. Dollar. This morning’s weakness followed disappointing Japanese trade data, with June’s surplus falling well short of expectations due to another sharp contraction in exports, particularly to China. This trend has renewed fears that Japan may be slipping into a technical recession, which has further undermined confidence in the Yen.
Beyond trade numbers, Japan’s macro landscape is becoming increasingly fragile. Real wages have declined, inflation is cooling, and the Bank of Japan’s path to normalizing policy now appears more uncertain. Adding to the pressure, political risk is also rising ahead of the upcoming Upper House election, leaving markets without a clear direction from fiscal leadership.
In contrast, the U.S. Dollar is enjoying a resurgence. Federal Reserve members, including Williams and Logan, hinted this week that rates could remain higher for longer, particularly as President Trump’s latest wave of tariffs adds to inflation concerns. The administration’s recent clarification that there are no plans to replace Fed Chair Jerome Powell has also calmed investor nerves, restoring faith in policy stability. The result: increased demand for the dollar at the Yen’s expense.
Technical Outlook:
• Current price: Just below 148.60 resistance
• Support: 147.90 and 147.50
• Breakout potential: A decisive move above 148.60 could open the door toward 149.60 and even test the psychological 150.00 mark—last seen in March.
• Indicators: Price is supported by the 100-hour EMA with positive oscillator alignment.
Momentum remains bullish unless support at 147.90 is breached.
Takeaway: Expect continued volatility as the Yen reacts to domestic data while USD remains supported by Fed hawkishness and trade tensions.

USD/JPY(20250717)Today's AnalysisMarket news:
The annual rate of PPI in the United States in June was 2.3%, lower than the expected 2.5%, the lowest since September 2024, and the previous value was revised up from 2.6% to 2.7%. Federal Reserve Beige Book: The economic outlook is neutral to slightly pessimistic. Manufacturing activity declined slightly, and corporate recruitment remained cautious.
Technical analysis:
Today's buying and selling boundaries:
147.97
Support and resistance levels:
150.23
149.38
148.84
147.11
146.56
145.72
Trading strategy:
If it breaks through 147.97, consider buying in, and the first target price is 148.84
If it breaks through 147.11, consider selling in, and the first target price is 146.56

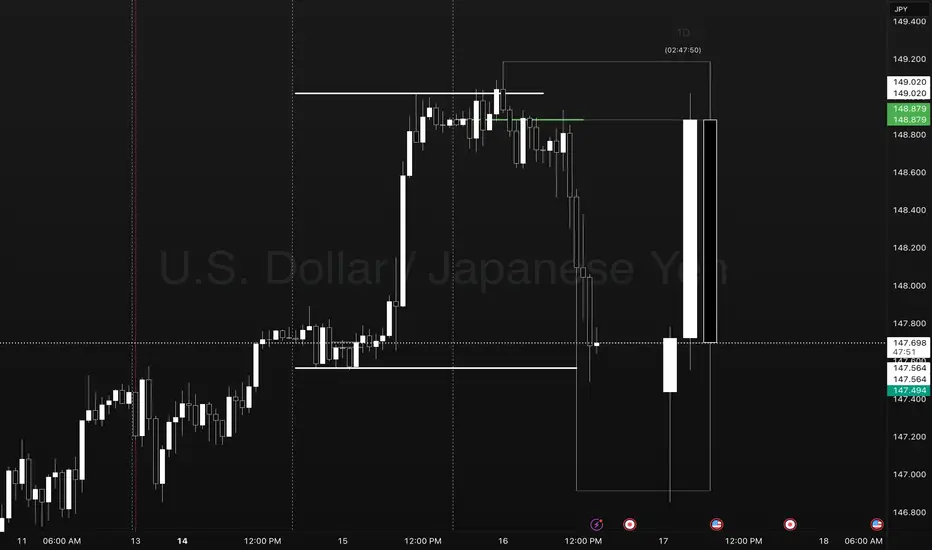
Pump Coil Dump Day 1-2-3 USDJPYUSDJPY Reversal Trade.
Points to Notice
Day 1 - Sets the new week high and low. Establishes a new week closing price as a target for a day 3 setup.
Day 2 - Typically expands Mondays range in the direction of the underlying oder flow. This occurs as a pump/ dump leading to the Asia and London coil sideways.
Day 3- We take note of the previous day high and low to observe price going into the NY session. In this case Price gave signs of a coiling reversal into the evening setting up for the move below Day 2 closing price.
Ideally what you want to see in this template is traders faked into a breakout move in the direction of the pump. This can present as a candle close above yesterdays high or closing price.
After trapping traders in we see the change in order flow creating a new lower low. This is the confirmation to look for an entry at the previous days closing price.
We set a stop at the high of day 3 level or at the previous days high with a target at the previous days low. In extreme cases we may see a setup that expands to the LOW level.
THE ONLY IMPORTANT DATA POINTS.
- PREVIOUS DAY HIGH AND LOW
- CLOSING PRICE
- LOW HOW LEVELS
- DAY COUNT
MARKETS ONLY DO TWO THINGS
- BREAKOUT, FAIL, REVERSE
- BREAKOUT, RETEST, TREND.
ONLY LEVELS THAT ARE TRADED
- PREVIOUS DAY HIGH (STOP LOSS)
- PREVIOUS DAY CLOSING PRICE (ENTRY)
- PREVIOUS DAY LOW (TARGET) CMCMARKETS:USDJPY FX:EURUSD OANDA:USDJPY
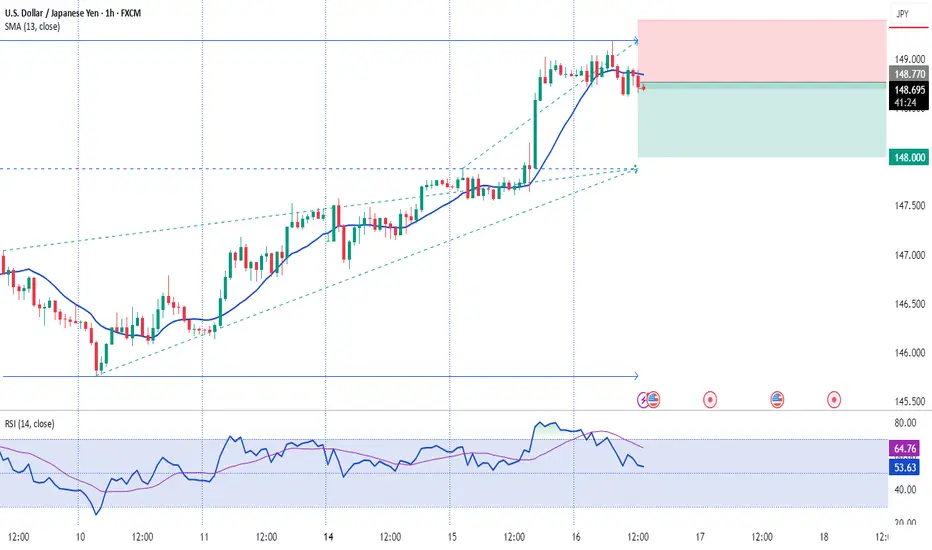
16.07.2025 #USDJPYSELL 148.770 | STOP 149.400 | TAKE 148.000 | ⏳ Close the trade in profit or move Stop Loss to breakeven after the price passes +25 pips.
Yen Slips Near 2-Month LowThe yen traded around 147.6 per dollar on Tuesday, close to a two-month low, as market sentiment remained fragile amid lingering trade tensions. The U.S. plans to impose 25% tariffs on Japanese exports starting August 1, but Tokyo hasn’t signaled retaliation. Talks between the two sides have stalled, and Japanese officials warn of potential economic fallout if the measures take effect.
Resistance is at 147.75, with major support at 146.15.
Euro Steady, EU Prepares $84B RetaliationEUR/USD hovered near 1.1670 in Tuesday’s Asian session as markets awaited US-EU trade updates. Despite Trump’s 30% tariff announcement on EU imports, he confirmed that negotiations with Brussels are ongoing ahead of the August 1 deadline. According to Bloomberg, the EU is ready to respond with proportional tariffs targeting $84B (€72B) worth of US goods, including Boeing jets, bourbon, cars, and machinery.
Resistance for the pair is at 1.1715, while support is at 1.1645.

Market Analysis: USD/JPY RisesMarket Analysis: USD/JPY Rises
USD/JPY is rising and might gain pace above the 149.20 resistance.
Important Takeaways for USD/JPY Analysis Today
- USD/JPY climbed higher above the 147.50 and 148.40 levels.
- There is a key bullish trend line forming with support at 148.40 on the hourly chart at FXOpen.
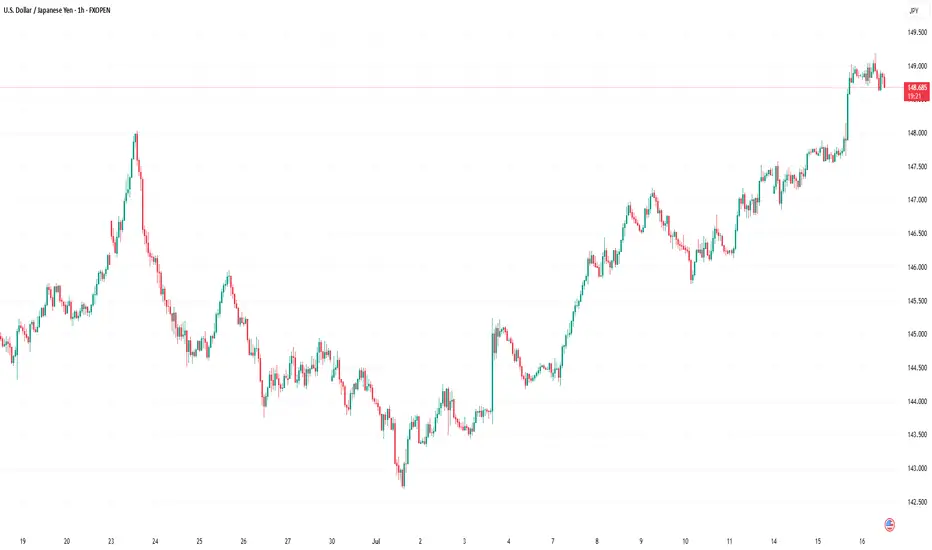
USD/JPY Technical Analysis
On the hourly chart of USD/JPY at FXOpen, the pair started a fresh upward move from the 145.75 zone. The US Dollar gained bullish momentum above 146.55 against the Japanese Yen.
It even cleared the 50-hour simple moving average and 148.00. The pair climbed above 149.00 and traded as high as 149.18. The pair is now consolidating gains above the 23.6% Fib retracement level of the upward move from the 145.74 swing low to the 149.18 high.
The current price action above the 148.50 level is positive. There is also a key bullish trend line forming with support at 148.40. Immediate resistance on the USD/JPY chart is near 149.20.
The first major resistance is near 149.50. If there is a close above the 149.50 level and the RSI moves above 70, the pair could rise toward 150.50. The next major resistance is near 152.00, above which the pair could test 155.00 in the coming days.
On the downside, the first major support is 148.40 and the trend line. The next major support is visible near the 147.90 level. If there is a close below 147.90, the pair could decline steadily.
In the stated case, the pair might drop toward the 147.50 support zone and the 50% Fib retracement level of the upward move from the 145.74 swing low to the 149.18 high. The next stop for the bears may perhaps be near the 146.55 region.
This article represents the opinion of the Companies operating under the FXOpen brand only. It is not to be construed as an offer, solicitation, or recommendation with respect to products and services provided by the Companies operating under the FXOpen brand, nor is it to be considered financial advice.
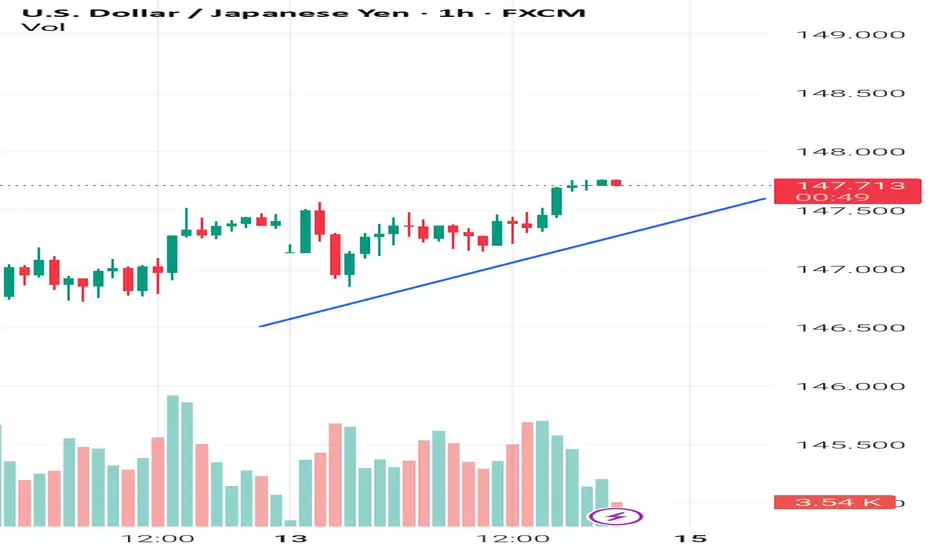
USDJPY H1 Support & Resistance Levels🚀 Here are some key zones I've identified on the 15m timeframe.
These zones are based on real-time data analysis performed by a custom software I personally developed.
The tool is designed to scan the market continuously and highlight potential areas of interest based on price action behavior and volume dynamics.
Your feedback is welcome!

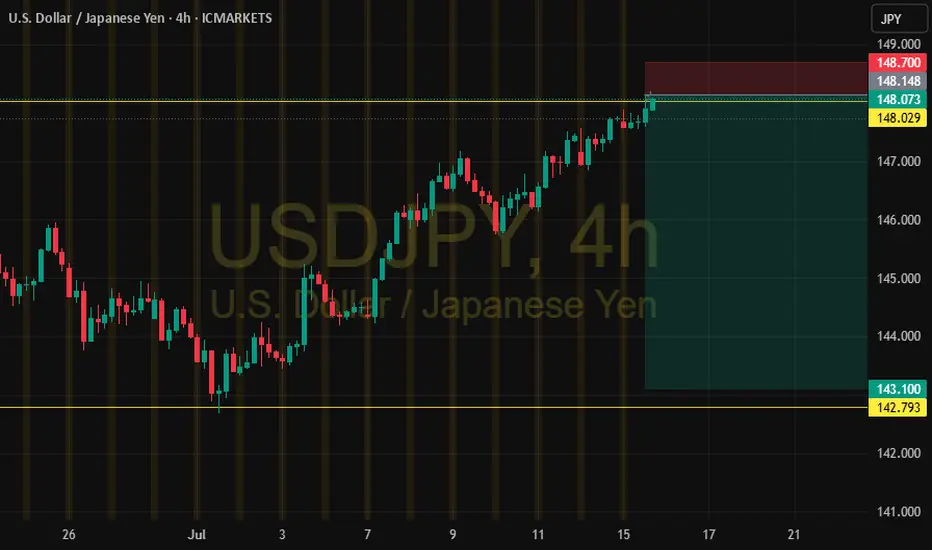
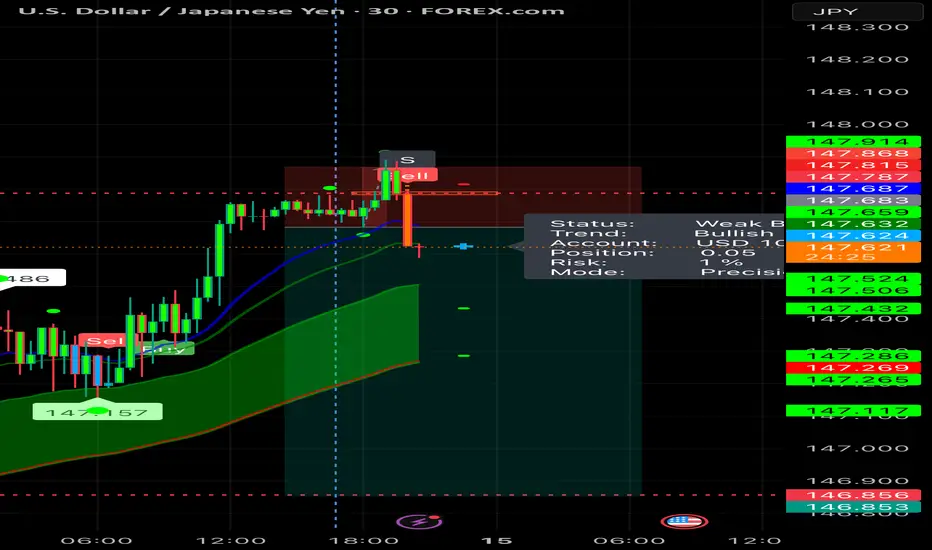
USD/JPY 4-Hour Forex Chart4-hour performance of the U.S. Dollar (USD) against the Japanese Yen (JPY) from late June to mid-July 2025, sourced from FOREX.com. The current exchange rate is 147.436, with a 1.178 (+0.81%) increase. Key levels include a sell price of 147.393 and a buy price of 147.479. The chart shows a recent upward trend with a resistance zone highlighted between 147.436 and 148.092, and support around 146.598. Candlestick patterns indicate volatility, with notable price movements around early July.

Fundamental Market Analysis for July 16, 2025 USDJPYEvent to Watch Today:
15:30 EET. USD – Producer Price Index
USDJPY:
USD/JPY has stabilized around 148.900, maintaining upside potential due to:
Interest Rates: The Fed keeps yields elevated (10-year bonds at 4.46%), while the Bank of Japan maintains an ultra-loose policy, keeping real yields negative.
Political Uncertainty: Upcoming elections in Japan and possible fiscal tightening reduce the yen’s appeal.
Dollar Demand: Trade frictions and geopolitical risks drive safe-haven flows into the dollar.
A break above 149.000 could open the path to 149.500. Support at 148.600 remains a critical barrier for the bullish scenario.
Trade Recommendation: BUY 149.000, SL 148.700, TP 149.900

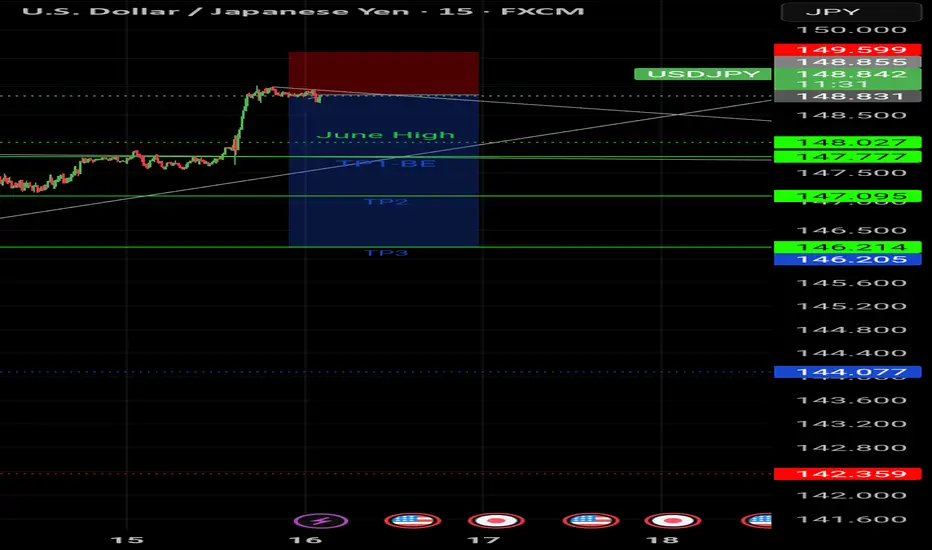
Pullback ahead The USDJPY pair has broken above previous month's high aggressively, a bearish retracement could possibly step in at this level, as price looks like it's resisting to keep pushing higher.
Support levels for profit taking: 147.777;
147.09; 146.2
USD/JPY ticks higher today!USDJPY has been trading strongly bullish in couple of days now and it seems the momentum ain’t slowing down anytime soon! Yes, this is a good time to opt in for a buy once we get any opportunity for that. We’re looking forward to tracking the market for a time price will begin to make a pullback so as to opt in for a buy.

USDJPY - BUY Market has broken resistance level with good bullish momentum candle and we anticipate market to remain bullish.
we plan our TPs with R:R of 1:1 and 1:2 with SL as defined below HL.

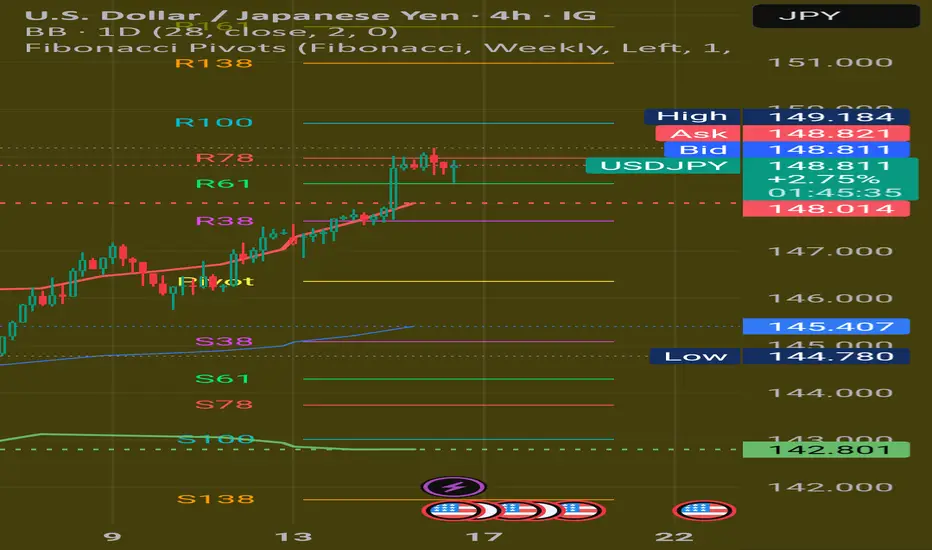
USDJPY Short Setup Near Key Resistance🔻 USDJPY Short Setup Near Key Resistance 🔻
Timeframe: 4H
Symbol: USDJPY
Trade Type: Short (Sell)
📌 Context:
USDJPY is approaching the psychological resistance zone at 148.00–148.50, an area that has historically triggered pullbacks. While the recent momentum is bullish, key technical indicators are flashing overbought conditions.
📉 Technical Confluence:
RSI above 70, suggesting exhaustion
Price nearing upper Bollinger Band
4H structure hints at a possible bearish divergence
Previous resistance around 148.00 held multiple times
💡 Short Idea:
I’m watching for signs of rejection or bearish candle confirmation near the 148.00–148.30 zone. If the price fails to break above, this could be an ideal place to short.
🎯 Potential Targets:
TP1: 147.20 (recent support / 50EMA on 4H)
TP2: 146.50 (mid-June consolidation zone)
⛔️ Stop Loss:
SL above 148.50, just beyond the resistance structure
⚠️ Invalidation:
A clean breakout and 4H close above 148.50 would invalidate this idea.
📝 Note: Always wait for confirmation. This is not financial advice. Use proper risk management.
#USDJPY #forex #shortidea #tradingview #priceaction #JPY #DXY #resistancezone #technicals
Now or after it breaks down from trend line - USDJPYThe blue dotted line represents the resistance level - 147.944. You can short now with a very tight SL OR wait for the price action to break down from the bullish trend line to establish your position.

USDJPY InsightHello to all subscribers,
Please feel free to share your personal thoughts in the comments. Don’t forget to like and subscribe!
Key Points
- U.S. President Trump raised tariff uncertainty by sending tariff letters to 25 countries, but mentioned that “negotiations remain open with major trading partners like the EU,” reigniting TACO trading sentiment.
- Trump warned that if Russia does not reach a ceasefire agreement with Ukraine within 50 days, the U.S. will impose “secondary tariffs” on Russia and any countries conducting trade with it.
- BOE Governor Andrew Bailey hinted that the Bank of England could cut interest rates more aggressively if needed.
Key Economic Events This Week
+ July 15: U.S. June Consumer Price Index (CPI)
+ July 16: U.K. June CPI, U.S. June Producer Price Index (PPI)
+ July 17: Eurozone June CPI
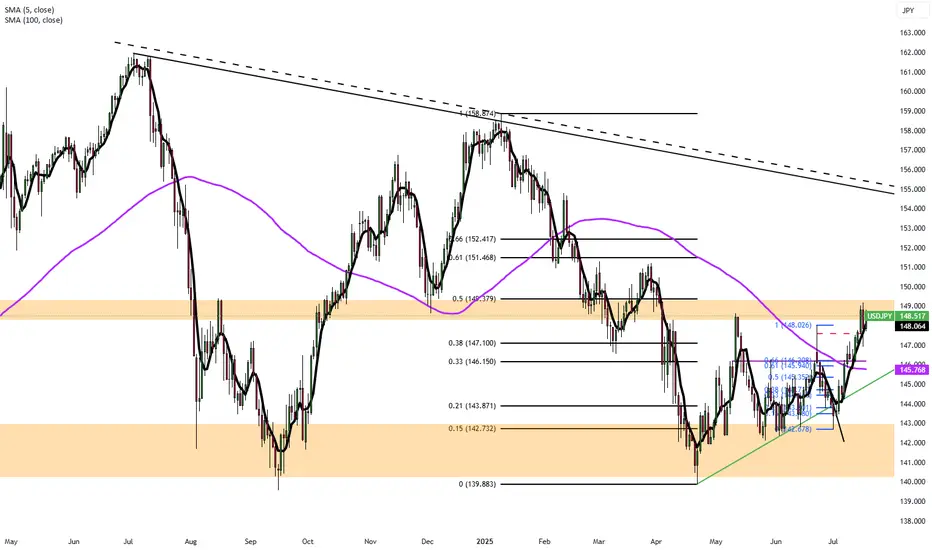
USDJPY Chart Analysis
The pair showed a mild upward trend near the 142 level and successfully rose to the 148 level. The direction is expected to shift around the 148 resistance. If it fails to break through, a decline back to 142 is likely. However, if it breaks above 148, a further rise toward the 151 level is expected.

Fundamental analysis: Monday 14 July Despite a little bit of tariff noise, nothing has fundamentally altered my view that 'risk on' trades are viable, particularly short JPY. Although (with the exception of the strong USD, we've seen fairly lackluster movement today). Which I suspect can be put down to the market waiting for Tuesdays US CPI data. I would also attribute today's USD strength to 'positioning' ahead of the release.
Regarding the data, it could be very market moving. We are starting to hit the time when 'tariff caused inflation' could show up in the data.
This is a situation where anyone 'testing' anticipation trades could set USD orders in both directions a few minutes before the event. Meaning, (for example) a 'buy stop' AUD USD in the event of a below forecast number (USD negative).
But also a 'sell stop' AUD USD for the event of a higher than forecast number (USD positive).
Setting the orders (roughly) the distance of the 1hr ATR (look back 100). Ideally with a stop loss behind, or close to, the open of the news candle.
If an order triggers, immediately delete the other order. If no orders trigger after 90 seconds, delete both orders and reassess.
The 'anticipation' strategy is something I've dipped in and out of for a while now. Privately it's been very successful, but the reason I say 'testing' is because I can't endorse it in a live account until each individual has experienced the 'slippage on entry' the strategy occasionally experiences (causing a loss to what looks like a winning trade). As alluded to over the last week or so, I do think 'red flag' US data releases could create 'anticipation trades' moving forward. But, please don't dive in with a live account. Be sure to gather enough 'demo data' to form your own opinion as to if it's a good strategy or not.
Regarding post event, catalyst / standard trades. It's complicated. I envision that long term the market will brush aside a high CPI number. But, in the short term, in the event of a high number, a USD long 'catalyst trade' would be very viable.
My preference would be for a below forecast number, which would create a 'no-brainer risk on trade', probably USD short but I would compare the momentum of USD JPY to determine which is the best 'short option'.
In other news, Canada reports CPI at the same time as the US, I expect the US data to dominate. But the CAD could be used as a tradable currency depending on the outcome of its data.
Sentiment for the GBP remains negative, in particular I suspect GBP AUD will continue it's downward trajectory.
Finally, the CHF continues to be strong in the face of the 'risk on environment'. Which I can only put down to the article I read a while ago suggesting the SNB GOLD HOLDINGS are benefitting the CHF. It makes sense considering the high price of gold at the moment.
It's not a situation i envision will last forever, but, it does mean I would rather short the JPY (or USD) in times of 'risk on'. In times of 'risk off' I'll compare the USD, JPY and CHF against each other. If the CHF is the strongest, I'd feel very confident in a CHF long.
Trading is never easy, but it feels particularly complicated at the moment, please feel free to offer thoughts or questions: