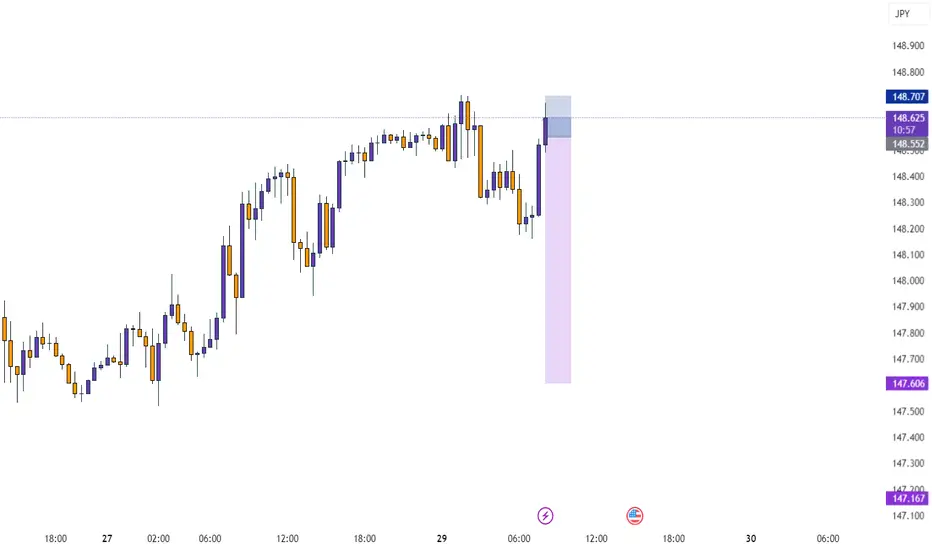
USDJPY 30Min Engaged ( BULLISH & Bearish Break Entry Detected )Time Frame: 30-Minute Warfare
Entry Protocol: Only after volume-verified breakout
🩸Bullish Break- 148.750
🩸Bearish Break- 148.370
➗ Hanzo Protocol: Volume-Tiered Entry Authority
➕ Zone Activated: Dynamic market pressure detected.
The level isn’t just price — it’s a memory of where they moved size.
Volume is rising beneath the surface — not noise, but preparation.
🔥 Tactical Note:
We wait for the energy signature — when volume betrays intention.
The trap gets set. The weak follow. We execute.
USDJPY trade ideas

USD/JPY Chart Analysis (Educational Breakdown)📊USD/JPY Chart Analysis (Educational Breakdown)
🗓 Date: July 28, 2025
⏰ Timeframe: 2H (2-Hour Candles)
🧠 Concepts: Liquidity | Fair Value Gap | Order Block | Structure | Support/Resistance
⸻
1. Market Structure Overview
• The pair has been bullish, making higher highs and higher lows.
• Recently, price tapped into a resistance zone (~148.40–149.00) and sharply rejected, suggesting a potential short-term reversal.
• The price may now aim to sweep liquidity below support before a possible rebound.
⸻
2. Key Levels
🟥 Resistance Zone (148.50–149.00)
• Marked by a previous supply zone where sellers stepped in aggressively.
• Current Bearish Order Block sits just below this resistance, confirming institutional interest in selling this level.
🟫 Bearish Order Block
• Last bullish candle before sharp drop acts as a bearish order block (around 148.30–148.50).
• This is a high-probability sell-side reaction area — ideal for liquidity grabs and reversals.
🟦 Fair Value Gap (FVG)
• Between mid-17th–18th July, an imbalance was left after strong bullish momentum.
• Price returned to this zone, partially filled the gap, and then dropped again — confirming its importance.
🟥 Support Zone (145.80–146.30)
• Long-standing demand area where buyers previously stepped in.
• This area aligns closely with sell-side liquidity (SSL).
⸻
3. Liquidity Zones
🔵 Buy-Side Liquidity (BSL) – Above resistance (149.00+)
• Stop-loss clusters above previous swing highs.
• Liquidity for institutional sell positions.
🟣 Sell-Side Liquidity (SSL) – Below 146.00
• Positioned right under support.
• Ideal liquidity target for smart money to trigger stop hunts and fill positions before reversing.


#USDJPYDate: 29-07-2025
#USDJPY Current Price: 148.53
Pivot Point: 148.049 Support: 146.177 Resistance: 149.932
Upside Targets:
Target 1: 151.264
Target 2: 152.597
Target 3: 154.303
Target 4: 156.008
Downside Targets:
Target 1: 144.839
Target 2: 143.501
Target 3: 141.796
Target 4: 140.090
#TradingView #Stocks #Equities #StockMarket #Investing #Trading #Forex
#TechnicalAnalysis #StockCharts #Currency

USDJPY 60/15 Pullback LongOverall bull trend. Waiting for pullback. If it pass the market shift and stay below, no go. Else will wait for long singal to go long.

USDJPY Rising wedge on FX:USDJPY pair
Key level to watch is 150 where multiple failed breakout attempts were recorded.
Confirmed breakout will push price to 152-156

USDJPY long position 29/07/2025English : According to our analysis, we anticipate a bearish scenario.
Morocan Darija : kanchofo d'apres l'analyse dyalna antsanaw hboot
ATENTION : I only share my ideas, not signals
if TP1 hit i will move SL to BE

Eyes on the Break USDJPY Approaches Key Resistance with Bullish.USDJPY Technical Outlook Bullish Momentum Gaining Strength
USDJPY is currently displaying a strong bullish structure, having taken a clean bounce from the ascending trendline support. This upward movement was further validated as the pair successfully broke through a significant resistance level, triggering a Market Structure Shift (MSS) a clear signal that the prior trend has potentially reversed or evolved.
Following the MSS, a Break of Structure (BoS) to the upside has confirmed the continuation of this bullish momentum. The price action is now navigating above the previous demand zone, indicating strong buying interest in that area.
Notably, the market retraced slightly to retest the bullish engulfing zone, reinforcing the strength of buyers at that level. After this healthy retest, price action is once again pushing upward.
Now, all eyes are on the next key resistance zone. If USDJPY manages to decisively break above this level and prints a valid bullish confirmation (such as another structure break, strong candlestick pattern, or liquidity sweep followed by a reversal), it would open the door for an extended upside move, potentially targeting higher time frame liquidity pools.
Traders should closely monitor price behavior around this resistance zone. A confirmed breakout with volume or institutional candle formations could provide an excellent opportunity for continuation buys, in alignment with the prevailing bullish sentiment.

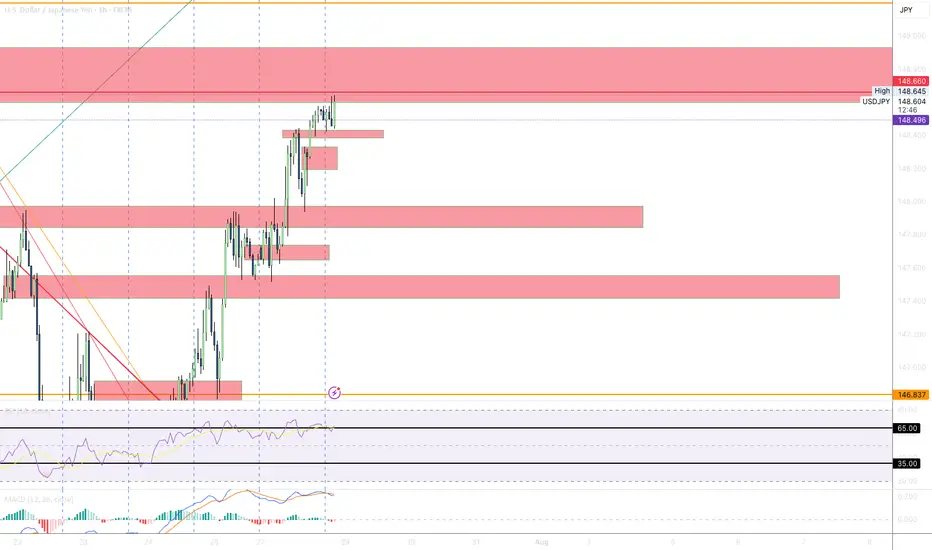
Lingrid | USDJPY Potential Channel Breakout. LongFX:USDJPY is retesting the breakout zone after reclaiming support from a prior swap area near 146.9. Price action has broken above a downward trendline and is forming a bullish retest structure. As long as USDJPY holds above 146.920 zone, the setup favors a continuation toward the resistance barrier. A breakout above the red descending trendline could accelerate upside momentum.
📉 Key Levels
Buy trigger: Break and hold above 147.500
Buy zone: 146.900 – 147.000
Target: 148.250
Invalidation: Break below 146.000
💡 Risks
Failure to break the descending red trendline may trigger renewed selling
Consolidation below resistance could signal buyer exhaustion
Break below 146.000 would invalidate bullish retest setup
If this idea resonates with you or you have your own opinion, traders, hit the comments. I’m excited to read your thoughts!

USDJPY USDJPY has reached liquidity level on the higher timeframe. A bearish 15M FVG has formed and I’m going to short to the 30/1H FVG gap. And then look for long positions

SellRejection Level
Daily Volume
Market Structure Shift
London Session
Trend Line Break
Untapped Order Point
Fundamental Market Analysis for July 29, 2025 EURUSDThe pair is consolidating at 148.500, leaving behind a nearly 1% gain since the start of the week. High Treasury yields (10-year bonds — 4.34%) are supporting demand for the dollar, while the easing of the US-Japan trade conflict is reducing defensive demand for the yen. As part of yesterday's statement by the US Treasury, tariffs on Japanese cars are being reduced to 10%, which improves the outlook for export-oriented corporations, but at the same time reduces investors' need for safe-haven currencies.
Despite inflation of 3.7% y/y and rising food costs, the Bank of Japan is likely to keep its rate at 0.5% following its July 30-31 meeting and only revise its CPI forecasts upward. Former Deputy Governor of the Central Bank Hiroshi Nakaso acknowledges that further increases are only possible after assessing the effect of US tariffs, i.e., not before 2026. This scenario reinforces negative real interest rates and a widening yield differential with the US.
In addition, the inflow of Japanese investment into foreign bonds has resumed amid confidence in a gradual, rather than sharp, normalization of BOJ policy. Taken together, these factors point to the likelihood of a test of 150.00 in the coming days in the absence of verbal intervention by the Japanese Ministry of Finance.
Trading recommendation: BUY 148.500, SL 147.900, TP 150.500

USDJPY – DAILY FORECAST Q3 | W31 | D29 | Y25📊 USDJPY – DAILY FORECAST
Q3 | W31 | D29 | Y25
Daily Forecast 🔍📅
Here’s a short diagnosis of the current chart setup 🧠📈
Higher time frame order blocks have been identified — these are our patient points of interest 🎯🧭.
It’s crucial to wait for a confirmed break of structure 🧱✅ before forming a directional bias.
This keeps us disciplined and aligned with what price action is truly telling us.
📈 Risk Management Protocols
🔑 Core principles:
Max 1% risk per trade
Only execute at pre-identified levels
Use alerts, not emotion
Stick to your RR plan — minimum 1:2
🧠 You’re not paid for how many trades you take, you’re paid for how well you manage risk.
🧠 Weekly FRGNT Insight
"Trade what the market gives, not what your ego wants."
Stay mechanical. Stay focused. Let the probabilities work.
OANDA:USDJPY

USDJPY InsightHello to all our subscribers.
Please feel free to share your personal thoughts in the comments. Don’t forget to hit the boost and subscribe buttons!
Key Points
- Prime Minister Shigeru Ishiba reaffirmed during a party meeting held at the LDP headquarters that he has no intention of resigning, stating, "I will do my utmost to ensure there is no political vacuum for the nation and the people."
- Following the U.S.-EU trade agreement, concerns have arisen that it could negatively impact the EU economy, with negative sentiment spreading across Europe.
- On July 28, the third high-level meeting between the U.S. and China began in Stockholm, Sweden. The market widely expects the current “tariff truce” to be extended by another 90 days.
Major Economic Events This Week
+ July 29: U.S. Department of Labor – JOLTS
+ July 30: Germany Q2 GDP, U.S. July ADP Nonfarm Employment Change, U.S. Q2 GDP, Bank of Canada rate decision, FOMC meeting results
+ July 31: Bank of Japan rate decision, Germany July CPI, U.S. June PCE Price Index
+ August 1: Eurozone July CPI, U.S. July Nonfarm Payrolls, U.S. July Unemployment Rate
USDJPY Chart Analysis
After facing resistance near the 149 level, USD/JPY pulled back but found support around 146, and is now climbing again toward 149. In the long term, a rise toward 151 seems possible. Two potential scenarios are in play:
- The pair hits resistance again at 149, finds support at 146, and then moves up toward 151.
- The pair maintains its current upward momentum and continues climbing directly to 151.
We will determine our strategy based on the price action near the 149 level.

USDJPY – Strap in For the Central Bank Rollercoaster The next 4 trading days could be crucially important for FX markets, with traders bracing for the outcomes of a variety of different events including several central bank meetings, economic data readings and trade deal/tariff negotiations. No currency pair within the majors is likely to feel the impact of these events more than USDJPY, given that both the Federal Reserve (Fed) and Band of Japan (BoJ) interest rate decisions take place within a 9-hour window late on Wednesday evening and early Thursday morning, UK time (Fed 1900 BST Wed, BoJ 0400 BST Thurs).
The first move in USDJPY at the start of this week has been higher. This was in response to the announcement of a trade deal between the EU/US, which sees tariffs of 15% on most EU goods imported into the US and has been taken as a success for President Trump and his trade team. (general USD positive). When coupled with the political uncertainty surrounding Japanese PM Ishiba, who is fighting to keep his job, (potential JPY negative) USDJPY has traded from opening levels at 147.51 on Monday up to a high of 148.71 earlier this morning in Asia.
Looking forward, both the Fed and BoJ are expected to keep interest rates unchanged. This could make what is said at the accompanying press conferences by Fed Chairman Powell (1930 BST Wed) and BoJ Governor Ueda (0730 BST Thurs) on the timing of their next respective interest rate moves potentially pivotal for the direction of USDJPY into the weekend.
Tier 1 US economic data may also be important, with the Fed’s preferred inflation gauge (PCE Index) due for release at 1330 BST on Thursday, and the next update on the current health of the US labour market due on Friday at 1330 BST in the form of Non-farm Payrolls. Sentiment may also be impacted on Friday by any headlines or social media posts from President Trump regarding trade deals and updates on whether he may extend or hold certain countries to his current deadline of August 1st.
Technical Update: Focus on Fibonacci Retracement Resistance at 149.40
On July 16th 2025, USDJPY traded to a price high of 149.19, nearing what might have been considered a resistance level by traders at 149.40. This level is equal to the 50% Fibonacci retracement of the price weakness seen from 158.88 on January 10th down to 139.88, the April 22nd low. Having been capped by this resistance level, a setback in price developed last week.
However, this phase of price weakness encountered buying support around the Bollinger mid-average, currently at 146.98, from which fresh attempts at price strength have emerged. As a result, it might be argued that this type of price action is more constructive in nature, especially as since the April 22nd low was posted a pattern of higher price lows and higher price highs has so far materialised, as the chart above shows.
That said, with potential for a sustained period of USDJPY volatility in the week ahead let’s consider what may be the important support and resistance levels that could influence the direction of prices moving forward.
Potential Resistance Levels:
Having previously capped price strength, the 149.40 retracement level may prove to be successful in doing so again, meaning closing breaks above 149.40 might now be required to suggest a further period of price strength.
As the chart above shows, if successful breaks above 149.40 do materialise, potential may then turn towards tests of the next resistance at 151.21, the March 28th session high, even 151.65, the higher 61.8% Fibonacci resistance level.
Potential Support Levels:
Having seen it offer support to recent price declines, traders may still be focusing on the 146.98 Bollinger mid-average as an important level that if broken on a closing basis, might lead to a further phase of price weakness.
Closing breaks under the 146.98 support while not a guarantee of further declines, could suggest potential to test 145.85, the July 24th session low and rally point, even towards 142.68, the July 1st low.
The material provided here has not been prepared accordance with legal requirements designed to promote the independence of investment research and as such is considered to be a marketing communication. Whilst it is not subject to any prohibition on dealing ahead of the dissemination of investment research, we will not seek to take any advantage before providing it to our clients.
Pepperstone doesn’t represent that the material provided here is accurate, current or complete, and therefore shouldn’t be relied upon as such. The information, whether from a third party or not, isn’t to be considered as a recommendation; or an offer to buy or sell; or the solicitation of an offer to buy or sell any security, financial product or instrument; or to participate in any particular trading strategy. It does not take into account readers’ financial situation or investment objectives. We advise any readers of this content to seek their own advice. Without the approval of Pepperstone, reproduction or redistribution of this information isn’t permitted.

July 29, Forex Outlook : High-Reward Setups You Shouldn’t Miss!Welcome back, traders!
In today’s video, we’ll be conducting a Forex Weekly Outlook, analyzing multiple currency pairs from a top-down perspective—starting from the higher timeframes and working our way down to the lower timeframes.
Pairs to focus on this Week:
USDJPY
AUDJPY
CADJPY
EURGBP
GBPCHF
USDCHF
NZDCHF
EURNZD
Our focus will be on identifying high-probability price action scenarios using clear market structure, institutional order flow, and key confirmation levels. This detailed breakdown is designed to give you a strategic edge and help you navigate this week’s trading opportunities with confidence.
📊 What to Expect in This Video:
1. Higher timeframe trend analysis
2. Key zones of interest and potential setups
3. High-precision confirmations on lower timeframes
4. Institutional insight into where price is likely to go next
Stay tuned, take notes, and be sure to like, comment, and subscribe so you don’t miss future trading insights!
Have a great week ahead, God bless you!
The Architect 🏛️📉

Trade Setup: USDJPY – Short Position Opportunity A technical seTrade Setup: USDJPY – Short Position Opportunity
A technical sell signal has emerged on the USDJPY pair, offering a short-term bearish trading opportunity based on current price action, resistance levels, and weakening bullish momentum.
USDJPY is trading near a key resistance zone around 148.200, where price has previously faced rejection, suggesting sellers are gaining control.
The entry at 148.193 allows for a high-probability short position just below the resistance, with minimal risk and solid potential reward.
The first target at 148.050 is a minor support level and a logical initial exit for short-term traders looking to secure fast gains.
The second target at 147.940 aligns with a recent price consolidation low and offers a more meaningful profit zone.
The final target at 147.880 touches a key demand zone and reflects the expected extent of the move if bearish pressure sustains.
The stop loss at 148.280 is wisely placed above the local resistance and recent swing high to minimize risk while allowing the trade some breathing room.
Write to Teefa Alizafar

Analysis on the Nite Elite PairsYou can follow us for more Analysis(Images and Videos) with Precise definition of the Financial Market.ENJOY!!!

USD/JPY(20250729)Today's AnalysisMarket news:
After gold prices soared to an all-time high of more than $3,500 an ounce in April, the latest report from the Commodity Futures Trading Commission (CFTC) showed that fund managers have increased their bullish bets to the highest level in 16 weeks.
Technical analysis:
Today's buy and sell boundaries:
148.19
Support and resistance levels:
149.23
148.84
148.59
147.78
147.53
147.14
Trading strategy:
If the price breaks through 148.59, consider buying, the first target price is 148.84
If the price breaks through 148.19, consider selling, the first target price is 147.78

USDJPYCurrently in an Up Trend, how every momentum seems to be slowing down. Short-term Trend reversal in the bear direction perhaps. I'm about to re-mark up my chart so this is just archive mark-up.
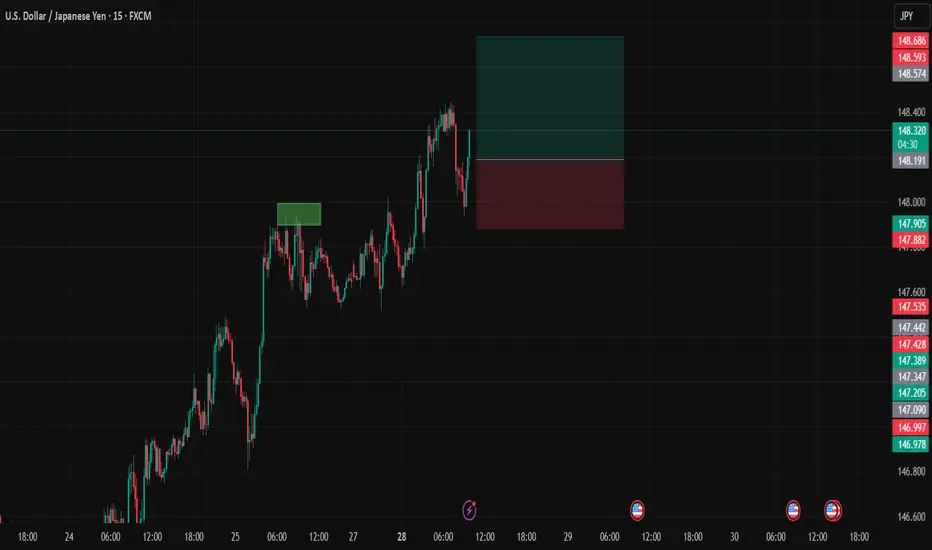
USDJPYDate:
July 28,2025
Session:
London and New York Session
Pair:
USDJPY
Bias:
Long
Looks like Sundays liquidity pool from last NYC open has been swept and it looks like price action wants to follow/continue its trend long.
Entry: 148.197
Stop Loss: 147.884
Target: 148.740
RR: 1.77
USD-JPY Is Overbought! Sell!
Hello,Traders!
USD-JPY is trading in a
Strong uptrend and the pair
Will soon hit a horizontal
Resistance of 149.200
So after the retest a
Local bearish pullback
Is to be expected
Sell!
Comment and subscribe to help us grow!
Check out other forecasts below too!
Disclosure: I am part of Trade Nation's Influencer program and receive a monthly fee for using their TradingView charts in my analysis.

