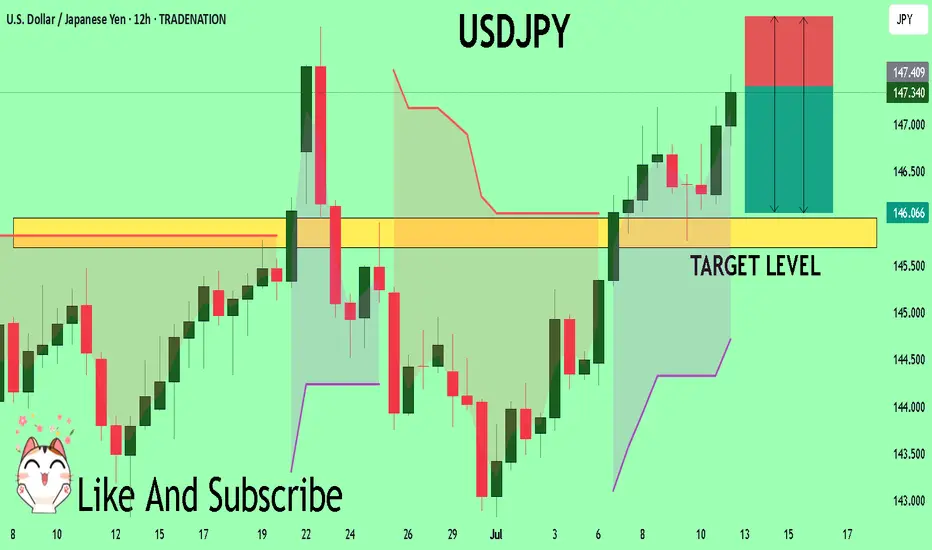
USD/JPY - Potential TargetsDear Friends in Trading,
How I see it,
STRONG PIVOT/SUPPORT @ 147.135
Caution:
All bullish TPs indicated are in multiple previous swing areas.
Monitor price action closely at these levels.
As long as price holds above PIVOT, bullish continuation remains
a high probability.
I sincerely hope my point of view offers a valued insight.
Thank you for taking the time to study my analysis.
USDJPY trade ideas

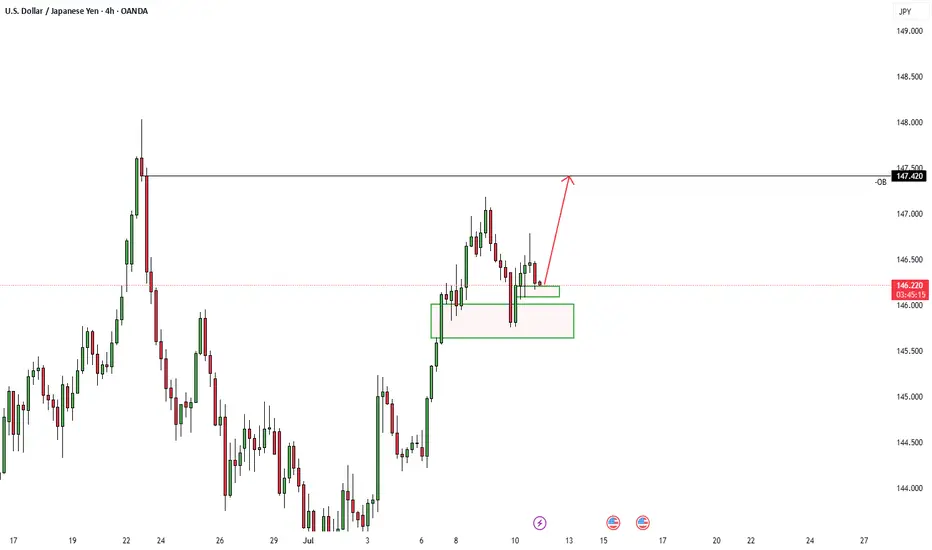
USDJPY: More Growth Ahead! 🇺🇸🇯🇵
USDJPY broke and closed above a minor daily resistance
with a confirmed BoS.
The next strong resistance is 148.0
It is going to be the next goal for bulls.
❤️Please, support my work with like, thank you!❤️
I am part of Trade Nation's Influencer program and receive a monthly fee for using their TradingView charts in my analysis.

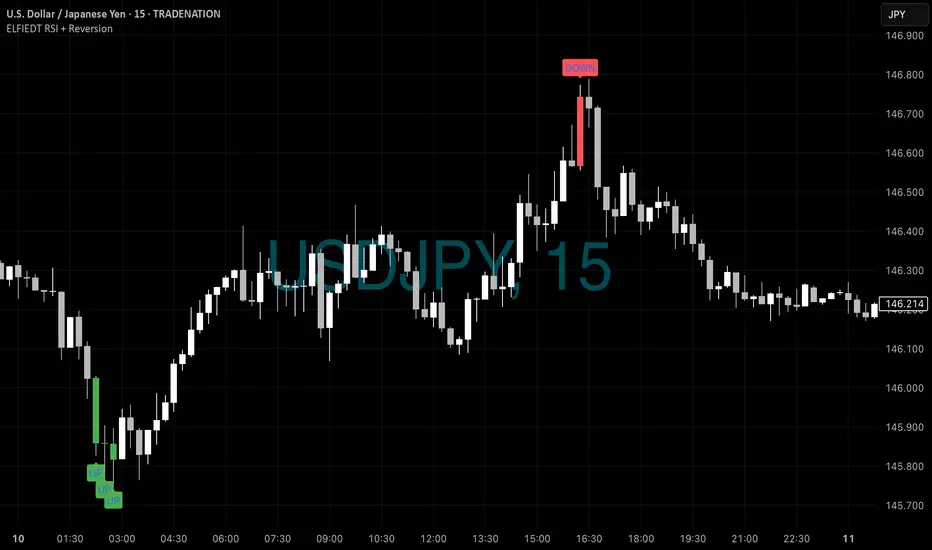
UJ - Long to Short📈 USDJPY 15min – ELFIEDT RSI + Reversion Signal Walkthrough
🧠 Precision Signals | High-Probability Reversals | Real Trades Visualized
This chart showcases how the ELFIEDT RSI + Reversion indicator identified actionable buy and sell opportunities on the 15-minute USDJPY chart.
🟩 Buy Signals: Triple Confluence at Session Lows
In the early hours, the indicator printed three consecutive UP signals around 02:30, marking a sharp reversion zone after a strong decline. This type of signal stack often suggests:
Oversold conditions aligning with broader momentum shifts
A high-probability reversal entry zone
🔹 Hypothetical trade:
Enter long at the close of the third UP signal.
📌 Stop-loss: Just below the swing low of the signal candle
🎯 Exit: On opposing signal (or trailing stop) – delivering a clean upward move from ~145.85 to ~146.90+
🟥 Sell Signal: Precise Top Call
Around 17:15, the indicator printed a DOWN signal at the exact high of the session. This marks exhaustion after an extended rally and primes for a mean reversion short.
🔹 Hypothetical trade:
Enter short at the signal close (~146.85–147.00 range)
📌 Stop-loss: Just above the session high
🎯 Exit: As price reverts to ~146.20 or based on trailing criteria
This single trade could have yielded over 60 pips.
✅ What Makes This Indicator Powerful?
ELFIEDT RSI + Reversion combines proprietary logic with time-tested reversal patterns. The signals are designed to be:
Fast-acting, yet filtered for noise
Non-repainting, and context-aware
Based on unique market conditions, not just raw RSI thresholds
🎁 Want access to more advanced versions?
This is just a public demo of what the ELFIEDT engine can do.
For access to exclusive multi-layered strategies (including divergence, trendline breaks, multi-timeframe filters), reach out directly.
📩 DM to get whitelisted for premium tools available only to select users.
#USDJPY #ReversionTrading #RSI #ForexSignals #ELFIEDT #SmartMoney #MeanReversion #TradingView #FXStrategy
USDJPY SWING BUY USDJPY is going to buy for a while... DYOR but according to my analysis...I'm riding the buy to those levels
USD/JPY - H1- Wedge Breakout (07.07.2025)The USD/JPY pair on the H1 timeframe presents a Potential Buying Opportunity due to a recent Formation of a Wedge Breakout Pattern. This suggests a shift in momentum towards the upside and a higher likelihood of further advances in the coming hours.
Possible Long Trade:
Entry: Consider Entering A Long Position around Trendline Of The Pattern.
Target Levels:
1st Resistance – 148.00
🎁 Please hit the like button and
🎁 Leave a comment to support for My Post !
Your likes and comments are incredibly motivating and will encourage me to share more analysis with you.
Best Regards, KABHI_TA_TRADING
Thank you.
Disclosure: I am part of Trade Nation's Influencer program and receive a monthly fee for using their TradingView charts in my analysis.

USDJPY IDEA 08/07/25So we are looking for a Discount Zone with this one. Since we are in a Premium PD Array, we are expecting a short term reversal
USD-JPY Short From Resistance! Sell!
Hello,Traders!
USD-JPY keeps growing but
A strong horizontal resistance
Is ahead around 148.500
So after the retest we will
Be expecting a local
Bearish correction on Monday!
Sell!
Comment and subscribe to help us grow!
Check out other forecasts below too!
Disclosure: I am part of Trade Nation's Influencer program and receive a monthly fee for using their TradingView charts in my analysis.

USDJPY 30Min Engaged ( Bullish Entry Detected )➕ Objective: Precision Volume Execution
Time Frame: 30-Minute Warfare
Entry Protocol: Only after volume-verified breakout
🩸 Bullish From now Price : 146.350
➗ Hanzo Protocol: Volume-Tiered Entry Authority
➕ Zone Activated: Dynamic market pressure detected.
The level isn’t just price — it’s a memory of where they moved size.
Volume is rising beneath the surface — not noise, but preparation.
🔥 Tactical Note:
We wait for the energy signature — when volume betrays intention.
The trap gets set. The weak follow. We execute.
USDJPY The Target Is DOWN! SELL!
My dear friends,
Please, find my technical outlook for USDJPY below:
The price is coiling around a solid key level - 147.41
Bias - Bearish
Technical Indicators: Pivot Points High anticipates a potential price reversal.
Super trend shows a clear sell, giving a perfect indicators' convergence.
Goal - 146.00
Safe Stop Loss - 148.14
About Used Indicators:
The pivot point itself is simply the average of the high, low and closing prices from the previous trading day.
Disclosure: I am part of Trade Nation's Influencer program and receive a monthly fee for using their TradingView charts in my analysis.
———————————
WISH YOU ALL LUCK
UJ LongsLooking for today's daily bullish candle to make new high into NY session
I drew the CTL for clarity of what I am looking for my entry.
Need a break close above 4hr resistance

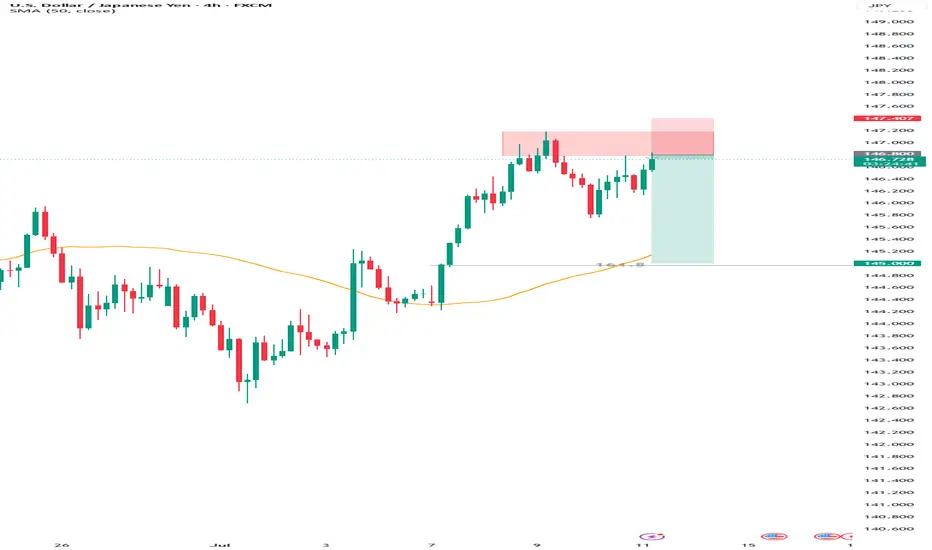
USDJPY 4HR Analysis on a bullish outlookUSDJPY - Short term bullish on DXY - I have my doubts on DXY still being bullish but I do like this scenario.
Is the US dollar taking a breather against the Japanese yen?After the recent rebound of the US dollar following two quarters of decline, the USD/JPY pair has been on an upward trajectory, forming a series of higher highs on both the 4-hour and daily charts.
However, the recent drop below the 146.515 level and the formation of a new low suggests a potential shift in trend on the 4-hour timeframe from bullish to bearish. This could signal a possible pullback in the short to medium term, with the first short-term target located at the 146.084 level.
The bearish scenario would be invalidated if the price rises above 147.179 and a 4-hour candle closes above that level.

USDJPYMarket Bias: Bearish USDJPY
Recent price action shows weakening bullish momentum on USDJPY, with sellers stepping in near resistance zones.
Key Drivers:
– Broad USD softness amid dovish Fed tone and easing inflation pressures
– JPY strength supported by rising BOJ tightening expectations or yield differentials narrowing
– Risk-off sentiment potentially boosting safe-haven demand for JPY

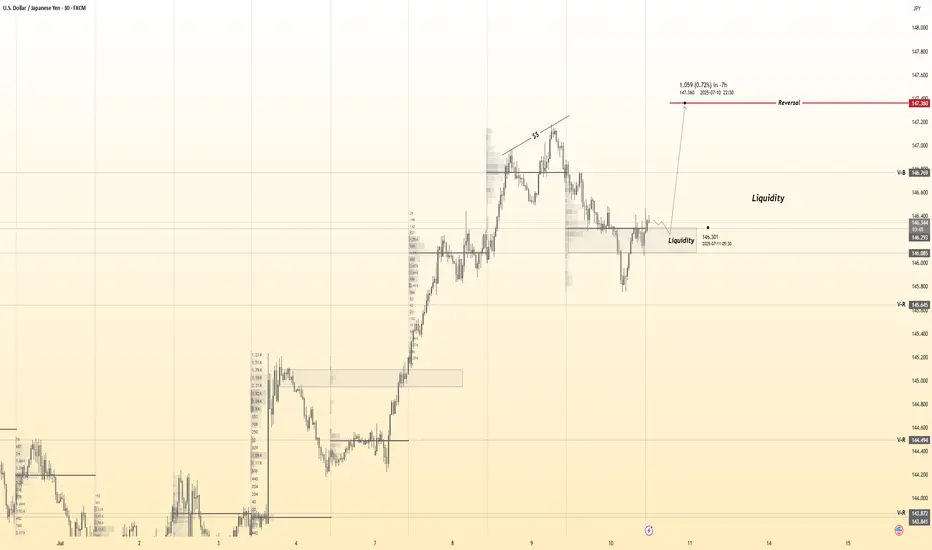
11.07.25 USDJPY Trade Recap + Re-Entry for +2.5%A long position taken on USDJPY for a breakeven, followed by a premature re-entry that I took a loss on. I also explain the true re-entry I should have taken for a 2.5% win.
Full explanation as to why I executed on these positions and also more details around the third position that I did not take.
Any questions you have just drop them below 👇

USDJPY-bias long bullish indications:
Making HHHL
Previous day's high is broken
Support respected at 146.76
Morning star formation in daily.
Bullish flag formation in 4 hr.
MA 21 respected in 30 min
Trade plan bias long @ 146.946
SL:146.66
TP1:147.246
TP2:147.55

Forex Market Depth Analysis and Trading StrategiesForex Market Depth Analysis and Trading Strategies
Forex market depth analysis offers traders a deeper understanding of currency market dynamics. It reveals the real-time volume of buy and sell orders at different prices, which is crucial for assessing liquidity and trader sentiment. This article explores how to analyse and use market depth for trading, discussing various strategies and their limitations.
Forex Market Depth Explained
Market depth meaning is the volume of buy and sell orders at different price levels. It's a real-time snapshot of the pair’s liquidity and depth of supply (sell orders) and demand (buy orders). Traders use this information to gauge the strength and direction of a currency pair.
This depth is typically represented through an order book, displaying a currency pair’s existing orders at various price points. This book lists the number of units being bid or offered at each point, giving us insight into potential support and resistance levels. For instance, a large number of buy orders at a certain price level may indicate a strong support area, suggesting that many traders are willing to purchase the currency pair at this price.
Understanding market depth is crucial in assessing the likelihood of trades being executed at desired prices, especially in fast-moving currencies or when trading large volumes. It may help in identifying short-term price movements, offering a more nuanced view of an asset beyond just candlestick charts.
How to Analyse Market Depth
Analysing order flow is a fundamental aspect of market depth trading, providing traders with valuable insights into the supply and demand dynamics of forex pairs. Forex market depth can be assessed using various tools and indicators.
One key tool is the Depth of Market (DOM), which shows the number of buy and sell orders pending at different prices. DOM offers a visual representation of the currency pair’s order book, highlighting potential areas where large orders are placed. We can use such information to identify significant support and resistance levels where the pair might experience a turnaround.
Another essential tool is Level II quotes. These quotes provide detailed information about the price, volume, and direction of every trade executed in real-time. By analysing Level II quotes, traders may be able to identify the pair’s momentum and potential trend shifts. For example, if there is a sudden increase in sell orders at a particular price, it may indicate a potential downward movement, prompting us to adjust our positions accordingly.
Strategies Using Market Depth Analysis
In forex trading, market depth analysis is a crucial tool for understanding and executing a depth of market strategy. Here's how traders can leverage this type of analysis in their strategies:
Scalping Strategy
By closely observing the DOM, scalpers can identify minor price movements and liquidity gaps. For instance, if the DOM shows a large number of sell orders at a slightly higher price, a scalper might open a short position, anticipating a quick downturn. This strategy relies on fast, short-term trades, capitalising on small price changes.
Momentum Trading
Momentum traders use the order book to gauge the strength of a trend. By analysing the order flow and volume, they can determine if a trend is likely to continue or reverse. For example, a surge in buy orders at increasing prices may signal a strong upward momentum, prompting a trader to enter a long position. Conversely, a build-up of sell orders might indicate a potential downward trend.
Support and Resistance Trading
Depth analysis is invaluable for identifying key support and resistance levels. Clusters of orders often act as barriers, influencing price movements. Traders may use these levels to set entry and exit points. For example, a large number of buy orders at a specific price may indicate a strong support zone, reflecting a potentially good entry point for a long position.
Breakout Trading
Traders seeking breakout opportunities can use market depth to spot potential breakout points. A significant accumulation of orders just beyond a known resistance or support level may indicate a potential breakout. If the pair moves past these areas with high volume, it could signal the start of a new trend, potentially offering a lucrative trading opportunity.
Integrating Market Depth with Technical Analysis
Integrating a depth chart trading strategy with technical analysis may enhance decision-making, combining the real-time insights of depth charts with the power of technical indicators. For instance, we can use market depth to confirm signals from technical analysis tools.
If a moving average crossover suggests a bullish trend, a corresponding increase in buy orders in the depth chart may reinforce the signal. Similarly, a significant resistance level identified through technical analysis, such as a Fibonacci retracement level, might be substantiated if there’s a large accumulation of sell orders at that price point.
Risks and Limitations of Market Depth Analysis
While market depth analysis is a valuable tool in forex trading, it comes with certain risks and limitations:
- Dynamic and Fast-Changing Data: Order book data is highly dynamic, often changing within seconds, making it challenging to base long-term strategies solely on such information.
- Lack of Centralisation in Forex: Unlike stock exchanges, the forex market lacks a centralised exchange. This decentralisation means depth data might not represent the entire marketplace accurately.
- Susceptibility to 'Spoofing': Large players might place and quickly withdraw large orders to manipulate market depth perception, misleading other traders. It’s worth noting that spoofing is illegal in many jurisdictions.
- Limited Usefulness in Highly Liquid Markets: In highly liquid pairs, the depth of market data may become less relevant, as large orders are quickly absorbed without significantly impacting prices.
- Dependency on Broker's Data: The reliability of order book data depends on the broker's technology and the size of their client base, which can vary widely.
The Bottom Line
Market depth analysis provides critical insights for forex traders, though it's vital to recognise its dynamic nature and limitations. Integrating it with technical analysis may create robust trading strategies.
This article represents the opinion of the Companies operating under the FXOpen brand only. It is not to be construed as an offer, solicitation, or recommendation with respect to products and services provided by the Companies operating under the FXOpen brand, nor is it to be considered financial advice.

Fundamental Market Analysis for July 11, 2025 USDJPYThe dollar is holding steady at 146.500 against the yen: another rise in US yields and stable demand for safe US assets following comments from the Fed are fueling appetite for the USD, while demand for the JPY remains sluggish.
The tariff front exacerbates the imbalance: the White House has already imposed 25% tariffs on Japanese goods, and new ideas for “umbrella” tariffs are heightening fears of a trade war, forcing investors to flow into financing currencies. Reuters notes that the yen weakened to 146.400, recording a weekly decline of more than 1%.
At the same time, the Bank of Japan is not yet ready for aggressive tightening: a decline in inflation to 1.8% y/y and weak real wage dynamics make it difficult to raise rates above 0.5%. The divergence in monetary policy and expectations for Japanese macro data (machine tool orders, industrial production) until July 14 form the fundamental basis for the pair's growth to 147.500 and above, while the risks of correction are limited to the 145.900 zone.
Trading recommendation: BUY 146.500, SL 145.900, TP 147.500

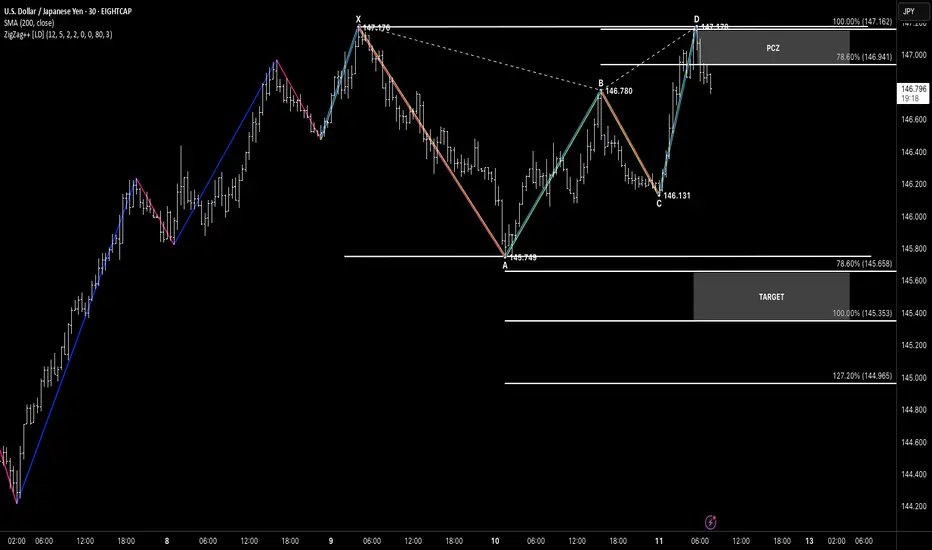
XABCD Double Top
Hello traders! I hope you’ve had a productive trading week.
Let’s take a look at USDJPY, where we’re wrapping up the week with a textbook XABCD Double Top formation.
📍 Structure Overview
Price action completed an extended XABCD formation, with D printing a perfect double top around the 147.17 level.
The move from C to D aligns closely with the prior XA leg, showing strong symmetry in price.
D terminates precisely within the PCZ (Potential Completion Zone), aligning with both 78.6% and 100% extensions.
🎯 Bearish Targets Below
If this Double Top confirms with bearish follow-through, the structure offers a clean setup with downside targets:
Target 1: 145.35 (100%)
Target 2: 144.96 (127.2%)
A break below point C (146.13) would further validate the bearish thesis.
🧠 Pattern Highlights
XABCD geometry
Strong price symmetry
Completion into previous high (resistance)
Clear target zone for risk-defined trades
USDJPY LongWe have a break of structure. the pair is forming a Elliot wave pattern. We are joining at the current market to complete the 4th wave. Lets see how it goes.

Let’s enter this position with **confidence and discipline**.✅ **The price has cleanly pulled back to 146.900**, which is exactly what we were waiting for.
We are in the **right zone, right signal, right timing.**
Let’s go. 💪📈


USDJPY Sell Idea Looking to sell between 146.800–147.180, targeting a move down to 145.000 with a stop loss at 147.400 to manage risk. This setup aims to catch a pullback from resistance after the recent rally, expecting the price to drop toward lower support.
As always, watch for bearish confirmation around the entry zone and trade with discipline.
Entry: 146.800 - 147.180
SL: 147.400
TP: 145.000
USDJPY | Supply zone rejection 💣📉Price ran out internal liquidity, tapped into a refined supply zone, and showed early signs of distribution. Entry taken post-confirmation at the mitigation of the order block, with a clean R:R toward the next demand zone.
🔹 BOS + Liquidity Grab
🔹 Supply Zone Rejection
🔹 Premium Pricing Entry
🔹 Targeting unmitigated demand below (HTF imbalance)
Setup is built around smart money principles—waiting for price to deliver the sell-off. Clean and mechanical.
#SMC #USDJPY #SmartMoney #LiquiditySweep #FXTradingClub #MarketStructure
