How to ENTER A TRADE - USDJPY BUY trade EXPLAINED!!!Determining the direction of an asset you wish to trade is relatively easy, the difficult part is finding the best entry. In this vid we look at reasons to enter a trade and analyze a current live buy trade on USDJPY
USDJPY trade ideas

usdjpy
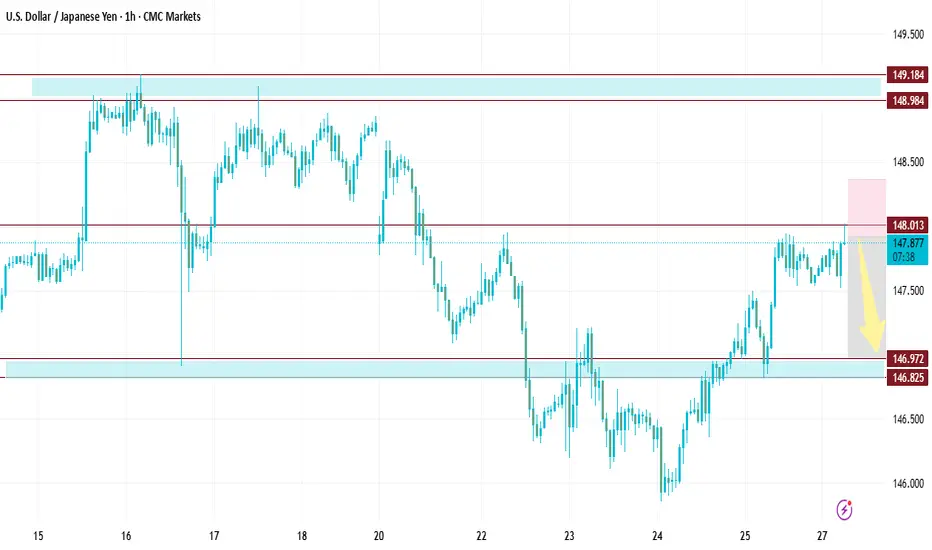
📌 Trade Idea: Sell USDJPY (U.S. Dollar / Japanese Yen)
Current Market Action: Based on recent technical analysis and price behavior, a selling opportunity in USDJPY has been identified.
Entry Zone: 147.90 – This is the ideal level where traders can initiate a sell position. It aligns with recent price rejection levels and shows early signs of bearish momentum.
Stop Loss (SL): 148.50 – A well-placed stop just above a key resistance zone ensures risk is controlled if price reverses against the trade idea.
Take Profit (TP) Levels:
🎯 TP1: 147.490 – This level offers a quick short-term target and serves as the first point for partial profit booking.
🎯 TP2: 147.190 – A mid-range target based on previous support zones, allowing for a stronger reward.
🎯 TP3: 147.000 – Final take-profit level, representing a significant move within the prevailing downtrend structure.
USD/JPY(20250728)Today's AnalysisMarket news:
Trump announced that the US and Europe reached a trade agreement: 15% tariffs on the EU, $600 billion in investment in the US, zero tariffs on the US by EU countries, the EU will purchase US military equipment, and will purchase US energy products worth $750 billion. However, the US and Europe have different opinions on whether the 15% tariff agreement covers medicines and steel and aluminum. Von der Leyen: 15% tariff rate is the best result that the European Commission can achieve.
US Secretary of Commerce: The deadline for tariff increase on August 1 will not be extended. The United States will determine the tariff policy on chips within two weeks.
Technical analysis:
Today's buying and selling boundaries:
147.47
Support and resistance levels:
148.58
148.17
147.90
147.04
146.77
146.35
Trading strategy:
If the price breaks through 147.90, consider buying, the first target price is 148.17
If the price breaks through 147.47, consider selling, the first target price is 147.04

USDJPY Asian session quick scalpingNFA...This is a personal trade I am willing to gamble a few bucks on. Ride with me if you want. gracias

USDJPY Short Setup: Trend Reversal Confirmation in ProgressAfter waiting patiently for nearly two weeks, price action on USDJPY is finally beginning to align with bearish expectations. The current setup shows signs of exhaustion in the bullish momentum, with a rejection near the 147.80–148.00 zone — a key area of interest.
🔍 Entry thesis:
Price is reacting below previous highs.
EMAs are starting to compress and slope downward.
Potential change of character (CHOCH) forming on lower timeframes.
🎯 Trade parameters:
Entry: 147.72
SL: 147.99
TP: 146.35
Risk/Reward: ~5:1
This move could unfold progressively throughout the week, especially as we approach the end-of-month flows and increased USD volatility. I’ll continue to monitor structure and volume for confirmation.

Bearish reversal off swing high resistance?USD/JPY is rising towards the pivot, which acts as a swing high resistance and could reverse to the pullback support.
Pivot: 149.20
1st Support: 146.36
1st Resistance: 151.18
Risk Warning:
Trading Forex and CFDs carries a high level of risk to your capital and you should only trade with money you can afford to lose. Trading Forex and CFDs may not be suitable for all investors, so please ensure that you fully understand the risks involved and seek independent advice if necessary.
Disclaimer:
The above opinions given constitute general market commentary, and do not constitute the opinion or advice of IC Markets or any form of personal or investment advice.
Any opinions, news, research, analyses, prices, other information, or links to third-party sites contained on this website are provided on an "as-is" basis, are intended only to be informative, is not an advice nor a recommendation, nor research, or a record of our trading prices, or an offer of, or solicitation for a transaction in any financial instrument and thus should not be treated as such. The information provided does not involve any specific investment objectives, financial situation and needs of any specific person who may receive it. Please be aware, that past performance is not a reliable indicator of future performance and/or results. Past Performance or Forward-looking scenarios based upon the reasonable beliefs of the third-party provider are not a guarantee of future performance. Actual results may differ materially from those anticipated in forward-looking or past performance statements. IC Markets makes no representation or warranty and assumes no liability as to the accuracy or completeness of the information provided, nor any loss arising from any investment based on a recommendation, forecast or any information supplied by any third-party.

USDJPY - W30📉 USD/JPY Weekly Plan
Current Price: ~147.65
Bias: Neutral to Bullish while above 147.00
🔑 Key Levels
Resistance: 147.94 → 149.17
Support: 147.00 → 145.90 (55-day EMA)
🔧 Trade Setups
1. Buy Breakout
Entry: Above 147.94
SL: 147.50
TP: 149.17 → 151.43
2. Buy on Dip
Entry: 147.00–147.20
SL: 146.80
TP: 147.94
🗓️ Key Events
Wed: Fed meeting
Fri: US NFP
BOJ: Possible comments affecting JPY

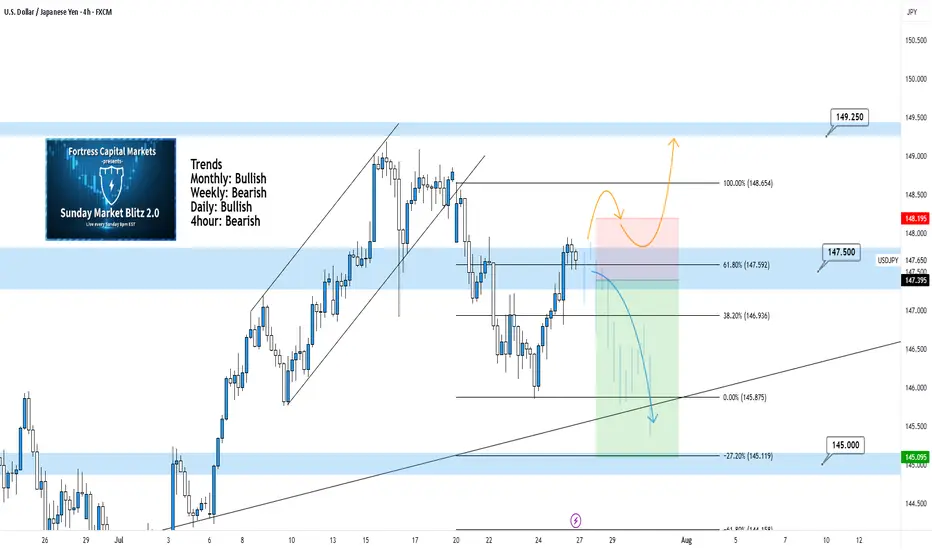
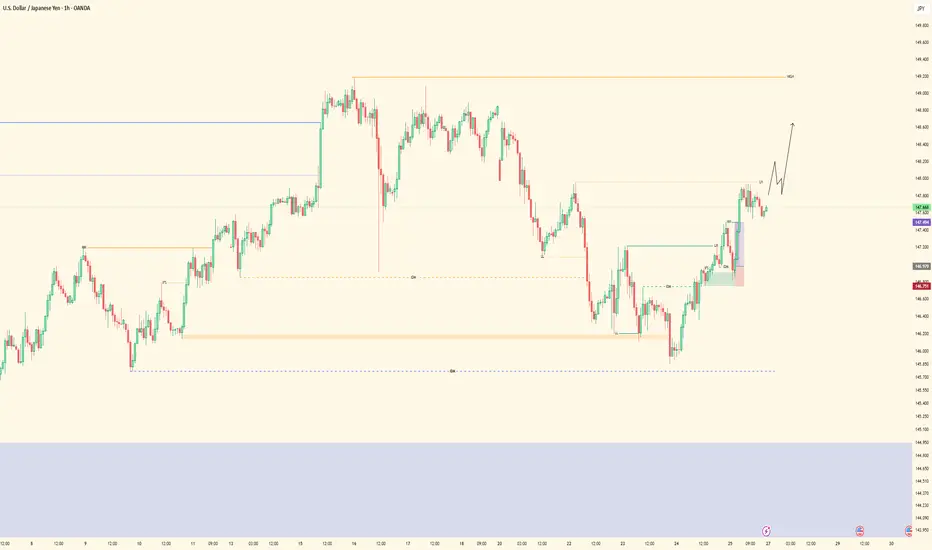
USDJPY 4Hour TF - July 27th, 2025USDJPY 7/27/2025
USDJPY 4Hour Neutral Idea
Monthly - Bullish
Weekly - Bearish
Daily - Bullish
4Hour - Bearish
We’re getting some mixed signals going into this week on UJ but it does look primarily bearish, especially after the move last week.
Currently price action is resting at 147.500 and we’re waiting to see if it will hold as resistance.
Here are two potential ways price action could play out for the week ahead:
Bearish Continuation - This is the most likely based on the context clues of last week. We’re clearly bearish and that lines up with the DXY bias at the moment.
For us to spot a confident short position on UJ we would need to see some bearish conviction coming off our 147.500 zone. We could see this happen after some consolidation or immediately so be cautious and be patient.
Bullish Reversal - This is the only bullish set up I'd be interested in if it plays out. We need to be convinced price action will move higher so I would need to see a significant push above 147.500 resistance with new structure in the form of higher low above. I’d look to target higher toward key levels of resistance if this happens.
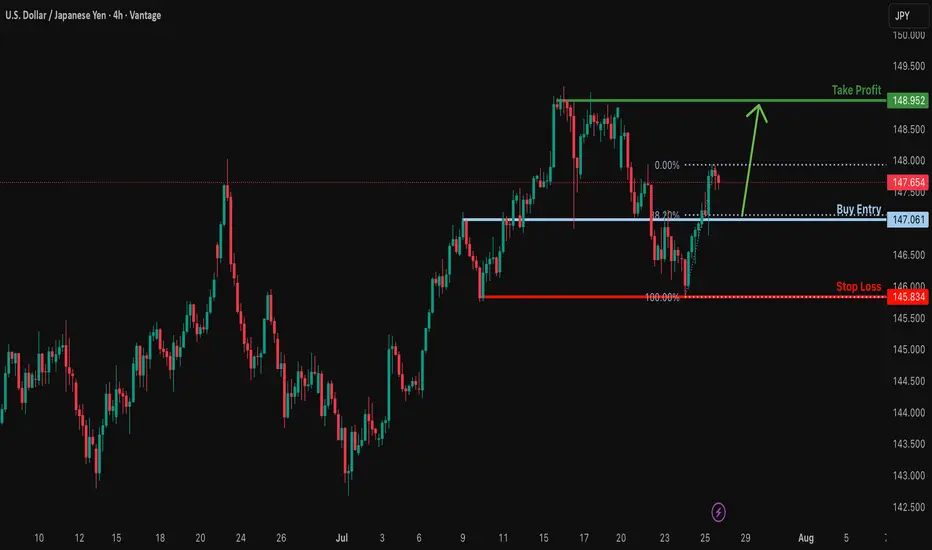
Could the price bounce from here?USD/JPY is falling towards the support level, which is an overlap support that aligns with the 38.2% Fibonacci retracement and could bounce from this level to our take-profit.
Entry: 147.06
Why we like it:
There is an overlap support that aligns with the 38.2% Fibonacci retracement.
Stop loss: 145.83
Why we like it:
There is a multi-swing low support.
Take profit: 148.95
Why we like it:
There is high swing resistance.
Enjoying your TradingView experience? Review us!
Please be advised that the information presented on TradingView is provided to Vantage (‘Vantage Global Limited’, ‘we’) by a third-party provider (‘Everest Fortune Group’). Please be reminded that you are solely responsible for the trading decisions on your account. There is a very high degree of risk involved in trading. Any information and/or content is intended entirely for research, educational and informational purposes only and does not constitute investment or consultation advice or investment strategy. The information is not tailored to the investment needs of any specific person and therefore does not involve a consideration of any of the investment objectives, financial situation or needs of any viewer that may receive it. Kindly also note that past performance is not a reliable indicator of future results. Actual results may differ materially from those anticipated in forward-looking or past performance statements. We assume no liability as to the accuracy or completeness of any of the information and/or content provided herein and the Company cannot be held responsible for any omission, mistake nor for any loss or damage including without limitation to any loss of profit which may arise from reliance on any information supplied by Everest Fortune Group.
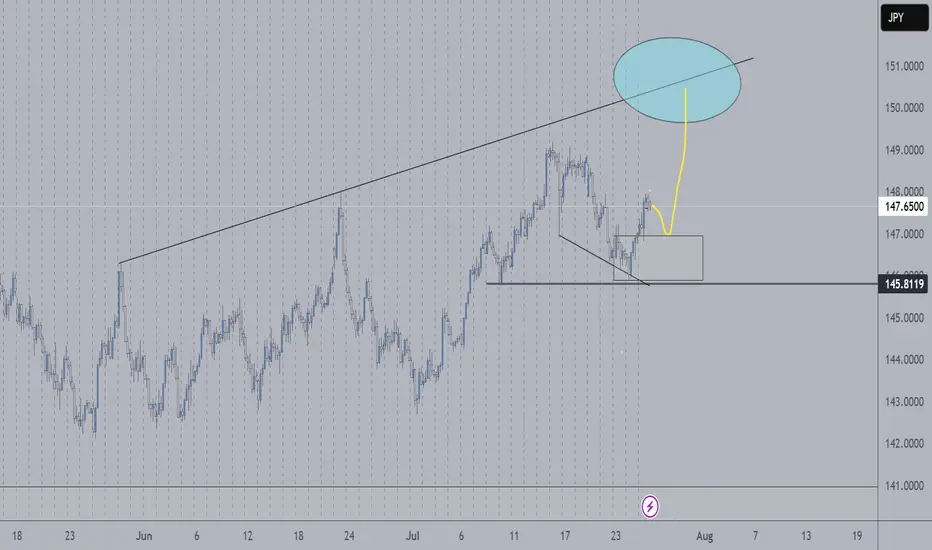
USD/JPY Outlook: Bullish Target Set at 151.0 USD/JPY Weekly Forecast – July Week 4
Last week, USD/JPY retested a weekly Fair Value Gap and closed with strong bullish pressure, confirming demand. Now, the next key liquidity level sits around 151.00 — just above the previous major highs.
On the daily timeframe, we may see a bearish retest toward 147.00 early in the week. From there, supported by both Federal Reserve sentiment and a bullish dollar, price could launch a strong bullish move to sweep the 151.00 highs.
Bias: Bullish
Key Zones:
• Support / Retest: 147.00
• Target: 151.00
• FVG Reaction: Confirmed on weekly close
The setup aligns with dollar strength and clean bullish structure.
—
Weekly forecast by Sphinx Trading
Drop your view in the comments.
#USDJPY #ForexForecast #SmartMoney #LiquidityTargets #SphinxWeekly #DollarStrength #PriceAction #FVG

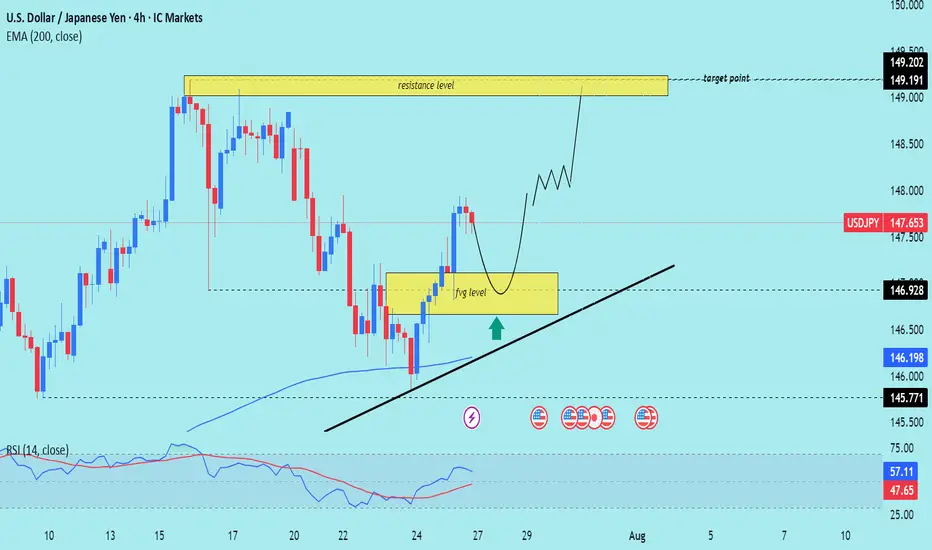
USD/JPY) Bullish Analysis Read The captionSMC Trading point update
Technical analysis of USD/JPY on the 4-hour timeframe, signaling a potential rally toward the 149.191–149.202 resistance zone. Here's the full breakdown
---
Technical Analysis – USD/JPY (4H)
1. Fair Value Gap (FVG) Support
Price recently filled a Fair Value Gap (FVG) level (yellow box) and is now pulling back toward it.
The FVG zone is expected to act as a support and potential entry point for buyers (marked by the green upward arrow).
2. Uptrend Structure
Price is moving within an ascending trendline, suggesting bullish market structure.
The current retracement is seen as a higher low setup, aligning with bullish continuation logic.
3. 200 EMA as Support
The 200 EMA at 146.198 is providing dynamic support.
Confluence between the EMA, FVG, and ascending trendline strengthens the bullish bias.
4. Resistance Target Zone
The projected target zone is between 149.191–149.202, which aligns with a previous high and key resistance level.
This zone is highlighted as the final take-profit area.
5. RSI Momentum
RSI is at 57.11, showing positive momentum but not yet overbought — which supports further upside.
RSI remains above 50, maintaining bullish momentum.
Mr SMC Trading point
---
Summary
Bias: Bullish
Current Price: 147.653
Support Zone (FVG): 146.20–146.92 (approx)
Trendline Support: Uptrend line intact
200 EMA: Acting as dynamic support (146.198)
Resistance Target: 149.191–149.202
RSI: 57.11 – healthy bullish momentum
plesse support boost 🚀 this analysis)
USD/JPY Daily AnalysisPrice has rejected 146.00 for the second time this month as buyers currently regard this as a high value area.
Next stop could be 149.00 which was the last daily resistance zone, rejected this month.
If you agree with this analysis, look for a trade that meets your strategy rules.

USDJPY TRADE SETUPH4 time frame base market is downtrend i hope this week continue to sell so let's see what happenned

USDJPY new highs on the horizon?we might begin the week with some short-term bearish moves. hopefully we get the needed bullish pressure to push us towards new highs
USDJPY Will Fall! Short!
Take a look at our analysis for USDJPY.
Time Frame: 1D
Current Trend: Bearish
Sentiment: Overbought (based on 7-period RSI)
Forecast: Bearish
The price is testing a key resistance 147.661.
Taking into consideration the current market trend & overbought RSI, chances will be high to see a bearish movement to the downside at least to 145.139 level.
P.S
The term oversold refers to a condition where an asset has traded lower in price and has the potential for a price bounce.
Overbought refers to market scenarios where the instrument is traded considerably higher than its fair value. Overvaluation is caused by market sentiments when there is positive news.
Disclosure: I am part of Trade Nation's Influencer program and receive a monthly fee for using their TradingView charts in my analysis.
Like and subscribe and comment my ideas if you enjoy them!

USD/JPY - Potential TargetsDear Friends in Trading,
How I see it,
Let me know if anything is unclear.
Keynote:
My personal point of view is that the greenback will be like a
train @ full throttle (BULLISH) for the second half of 2025.
Specifically, from the 1st of August...
I sincerely hope my point of view offers a valued insight
Thank you for taking the time study my analysis.

USDJPY BULLISHUJ closed bullish last week so I’ll continue looking for buys this week. There was a daily double bottom & 50% Retracement on the daily timeframe. I would like for price to either break the H4 resistance, form a HL then look for buys. Or price could retrace and form a HL the I’ll look for buys towards daily resistance @149.190 then my next TP will be 151.00

USDJPY Breakout and Potential RetraceHey Traders, in today's trading session we are monitoring USDJPY for a buying opportunity around 146.300 zone, USDJPY was trading in a downtrend and successfully managed to break it out. Currently is in a correction phase in which it is approaching the retrace area at 146.300 support and resistance area.
Trade safe, Joe.

USDJPY: Bullish Move From Support Ahead! 🇺🇸🇯🇵
I think that there is a high chance that USDJPY will continue growing
next week.
A bullish breakout of a resistance line of a flag pattern that occurred
after a test of a key support provides a strong bullish signal.
Goal - 148.7
❤️Please, support my work with like, thank you!❤️
I am part of Trade Nation's Influencer program and receive a monthly fee for using their TradingView charts in my analysis.

UJ| Bullish Structure Ride | 5M Demand ExecutionPair: USDJPY
Bias: Bullish
HTF Overview: 4H structure stayed bullish with clean intent. Internal liquidity resting above prior highs, and price is still pushing through the 30M range toward those 4H targets.
LTF Confirmation: 30M showed a clean continuation range with a lower high (LH) inside structure — price never broke character. I tracked it into 5M where the OB was sitting patiently.
Entry Zone: Tapped into the 5M OB with a short-term sweep right before — no need for extra confirmation. The move had structure, inducement, and momentum on its side.
Target: TP hit at the 5M highs, but overall I’m watching for the 30M LH to go first, then ultimately expecting price to run the 4H internal highs this upcoming week.
Mindset Note: When the story is clear on the HTF, all you need is one clean LTF entry to ride with conviction. I’m letting the higher timeframe breathe and staying ready.
USDJPY (weekly Analysis) 26/07Hi everyone the weekly analysis is now up. hope everyone has a great weekend and as always happy trading.

USDJPY BullishAfter exiting a correction, the first impulse (Wave 1) appears. I expect a retracement of at least 50% of the Fibonacci.

USD JPY shortthe sl is a bit short and narrow but yet lets see the rr is very good 1 to 3 lets see
Please note: This is for educational purposes only and not a trading signal. These ideas are shared purely for back testing and to exchange views. The goal is to inspire ideas and encourage discussion. If you notice anything wrong, feel free to share your thoughts. In the end, to learn is to share !
