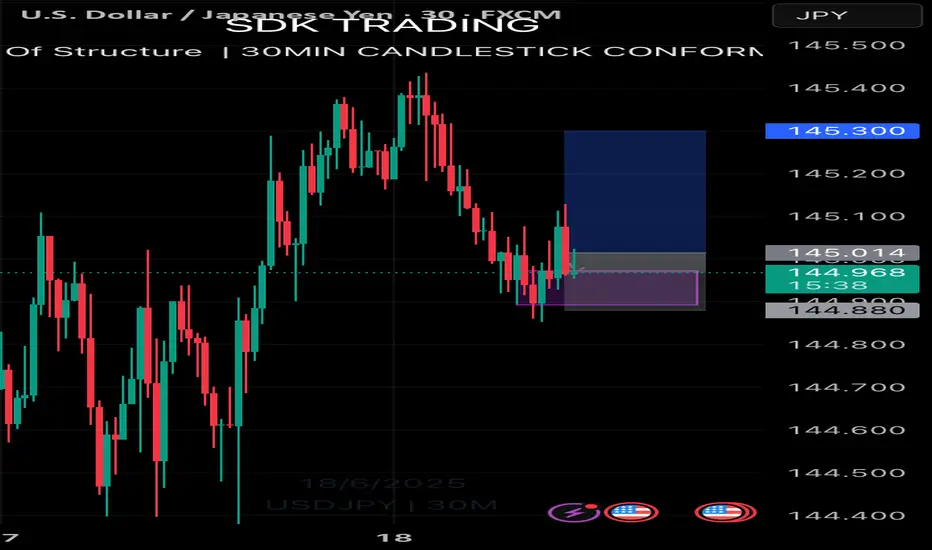
USDJPY LongPrice hit an Area on interest on the 30 min timeframe. There is also a break of structure on the 30min timeframe and and orderblock that price retested. Takeprofit and stop loss are indicated on the chart.
USDJPY trade ideas
Break out and retest strategyOn the 4 hour time frame shows an uptrend, of which it has provided the third touch marking a buy. And it has been in an uptrend that has been creating higher lows. It has provided a breakout on the H4, and on the 30 minute timeframe it gave a support level markin a buy set up amd entry. Sculping to take first take profit and second

Yen Holds Ground as BoJ Stays CautiousThe yen held near 145.1 per dollar on Wednesday following three consecutive sessions of losses, weighed down by soft economic data and trade uncertainty. Japan’s exports declined in May for the first time in eight months, alongside drops in machinery orders and manufacturing sentiment. The Bank of Japan left rates unchanged and maintained a cautious tone, though Governor Ueda signaled future hikes remain possible. Trade talks between Prime Minister Ishiba and President Trump at the G7 summit showed no progress on tariffs.
Resistance is at 145.30, while support stands near 142.50.

USDJPY 1H – 5-WaveHello awesome traders!
USDJPY (1H) is shaping up beautifully with a textbook 5-wave structure into a potential reversal zone.
After completing the 5th wave at 145.442, we’re seeing a controlled pullback targeting the TARGET ZONE 1, which aligns perfectly with:
127% Fib Extension of the last impulse
161.8% Full Projection
200 SMA Dynamic Support
We’re watching closely for price to reach this high-confluence area (144.471 – 144.207), which also aligns with the previous Wave 4 region and the trendline break. If buyers step back in with strong price action, we’ll look to long from this zone toward a retest of 145.255, and possibly beyond if structure shifts bullish again.
Key Outlook:
🔸 Short-term retracement into value
🔸 Bullish continuation possible from PCZ
🔸 Patience pays — let the setup complete
We'll monitor the TARGET ZONE 1 for signs of accumulation and a fresh breakout setup.
🔥 Structure. Patience. Execution.
🟠 Follow for more clean structural setups and trade-ready charting ideas
TradeChartPatternsLikeThePros.

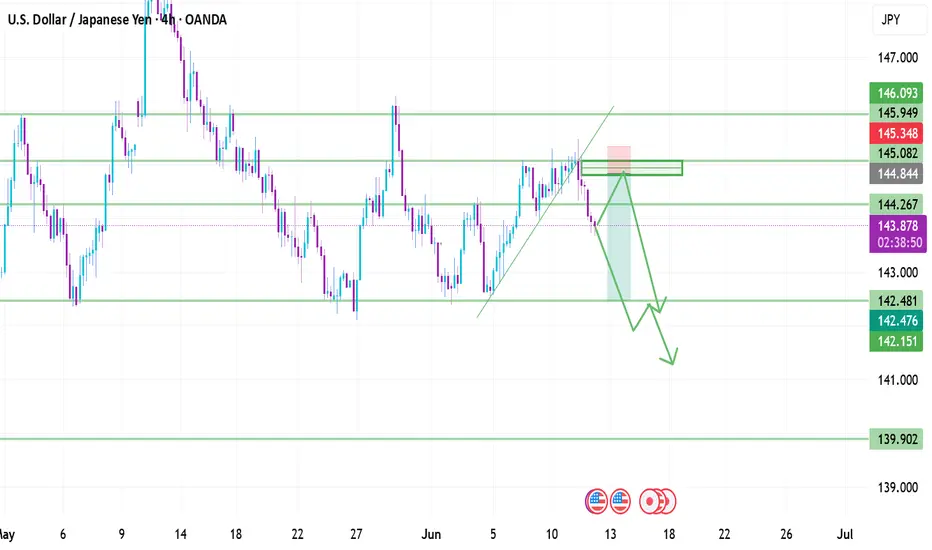
USD/JPYIn my previous analysis, I held a long bias on USD/JPY; however, recent geopolitical tensions and market-moving news have shifted the outlook. The pair has now broken below a key trendline, forming new lower lows, suggesting a potential change in structure.
At this point, two possible scenarios could unfold:
Scenario 1: USD/JPY may retest the breakout zone around the 145.000 level before continuing its move downward.
Scenario 2: The pair may continue its bearish momentum, break through the next significant support at 142.480, and potentially offer a shorting opportunity following a confirmed retest of that level.
Although the chart has shown mixed signals with both bullish and bearish formations, I’m reminded of an insightful quote I read this morning by Mihai_Iacob: “Trade the chart, respect the world around it.”
With that in mind, I will continue to focus on technical structure while remaining mindful of external factors such as geopolitical events and high-impact news that could influence volatility and market direction.
USD/JPY Follow the ascending bullish from demand zone 143.000FX:USDJPY Analysis – 1H Timeframe
The pair continues to respect its bullish ascending channel, gaining strong momentum from the key demand zone at 143.000.
🔹 Technical Targets Ahead:
🔸 1st Target: 144.100 – Minor Supply Zone
🔸 2nd Target: 144.900 – Key Supply Zone
🔸 3rd Target: 145.900 – Strong Resistance Level
Momentum remains in favor of buyers as long as price holds above 143.000. Watch for reactions at each target zone for potential short-term pullbacks or breakout continuation.
📊 Trade smart – manage your risk!
👇 Like, follow, drop a comment, and join us for real-time updates & setups!
— Livia 💹😜

Could the price bounce from here?USD/JPY is falling towards the pivot which is an overlap support and could bounce to the 1st resistance which which acts as a pullback resistance.
Pivot: 144.34
1st Support: 142.98
1st Resistance: 146.15
Risk Warning:
Trading Forex and CFDs carries a high level of risk to your capital and you should only trade with money you can afford to lose. Trading Forex and CFDs may not be suitable for all investors, so please ensure that you fully understand the risks involved and seek independent advice if necessary.
Disclaimer:
The above opinions given constitute general market commentary, and do not constitute the opinion or advice of IC Markets or any form of personal or investment advice.
Any opinions, news, research, analyses, prices, other information, or links to third-party sites contained on this website are provided on an "as-is" basis, are intended only to be informative, is not an advice nor a recommendation, nor research, or a record of our trading prices, or an offer of, or solicitation for a transaction in any financial instrument and thus should not be treated as such. The information provided does not involve any specific investment objectives, financial situation and needs of any specific person who may receive it. Please be aware, that past performance is not a reliable indicator of future performance and/or results. Past Performance or Forward-looking scenarios based upon the reasonable beliefs of the third-party provider are not a guarantee of future performance. Actual results may differ materially from those anticipated in forward-looking or past performance statements. IC Markets makes no representation or warranty and assumes no liability as to the accuracy or completeness of the information provided, nor any loss arising from any investment based on a recommendation, forecast or any information supplied by any third-party.

CHECK USDJPY SIGNAL READ CAPTAINTrade Setup Details (USD/JPY):
Entry Price: 144.965 (marked in grey)
Current Price: 144.934
Stop Loss: 145.330🔻
Take Profit Levels:
TP1: ~144.350
TP2: ~144.880
Last Target: 143.290 🎯

ANOTHER DAY ANOTHER DOLLAR.So we are in the midst of an international crisis. Middle eastern tensions are always bound to shake up the market so even with all the information; economic data and technical analysis. We should always expect surprises.
With that being said let's jump right into analysis of the dollar v yen pair.We have been range bound for the past two months in a wide range between 148.00and 141.00.I don't expect price jumping out of that range unless there is a very strong catalyst. This week's price range has seen lows of 143.90 and highs of 145.40 and this is the data we will use today to set our targets.A break lower for the dollar will subsequently mean lower targets for the dollar yen while a reverse in the dollar will take us to monthly high targets @ 146.00 and 147.00.

Nite Pairs among the 10 Elite PairsVery long video but Educative.We are Expecting Gold to Shoot up(Bullish). You can follow us for more Analysis(Images and Videos) with Precise definition of the Financial Market.ENJOY!!!

Prop Journey Trade 1Hello Traders!
I will be showing the in and outs of managing a prop account under strict rules.

USDJPY TECHNICAL ANALYSIS I'm expecting a small push to the down side if price respects our zone just aim for 1:2,1:3,1:4rr then close. I believe it should be a short sell

Leg Based Continuation Possible Play📈 USD/JPY – 15M Chart (Scalping to Intraday Play)
🕒 June 17, 2025 – Lower Time Frame Setup
Bias: Short-term Bullish Continuation
Structure: Leg-Based Impulse-Pullback-Impulse Model
🔹 Market Structure Insight:
Price recently completed a strong impulsive move (LEG 1) on increasing volume.
After a shallow correction into dynamic support (EMA 60), price is attempting a LEG 2 continuation.
EMAs (15 & 60) have bullish alignment and acted as dynamic support.
✅ Buy #1 – Market Execution
Entry: 144.91 (current or recent execution)
SL: 144.38
TP: 145.25
R:R ≈ 1
🧠 Entry based on continuation after bullish flag breakout
✅ Price held higher low structure + EMA confluence
✅ Buy Limit #2 – Pullback Opportunity
Entry: 144.59 (highlighted zone between EMAs)
SL: 144.37
TP: 145.25
R:R ≈ 3.0
🧠 Designed to catch a retest into the mid-range and volume base
➕ Risk minimized, reward optimized
➕ Matches possible HL (higher low) setup if price dips before pushing
⚠️ Risk Management Notes:
Overlap with prior resistance zone just above TP (145.20–145.40): partial TP or trail advised.
Invalidated if price closes below 144.30 on strong volume (breaks structure).
If LEG 2 matches or exceeds LEG 1 in strength, extended targets above 145.50 possible.

US retail sales data stands out | FX ResearchThe yen didn't move all that much but did manage to post a 4-day low against the buck after the Bank of Japan maintained its interest rate as expected while planning to reduce bond purchases quarterly starting next fiscal year. BoJ Governor Ueda signaled potential rate hikes if economic and inflation forecasts held, but highlighted risks from U.S. tariffs, domestic food inflation, and weaker economic data expected in the second half of the year.
In global markets, the U.S. dollar remained stable. EUR/USD softened despite a strong German ZEW survey, and oil prices were relatively contained considering Middle East tensions and a tanker collision off the UAE coast.
U.S. stock futures are under a little pressure as Senate Republicans proposed tax cuts that could widen deficits, while upcoming U.S. retail sales data and ECB commentary on strengthening the euro’s global role have kept markets focused—also ahead of tomorrow’s highly anticipated Fed decision.
Exclusive FX research from LMAX Group Market Strategist, Joel Kruger

usd/jpyjust a quick look to see where its going to go my beleif is it will hit restitance and start to come back down until a break out occurs, catch good moves on U/J just got to sit and wait TAKE PROFIT AND STOP LOSS BOTH ON DECK

USD/JPY: Yen Continues to Lose Ground Against the U.S. DollarOver the past three trading sessions, USD/JPY has risen by more than 1%, favoring the U.S. dollar, as the yen continues to weaken steadily. The bullish bias has persisted, supported by a rebound in dollar strength. The DXY index, which measures the dollar's performance against other major currencies, has been climbing in the short term and is once again approaching the 100-point mark, signaling growing confidence in the dollar’s movements. If this dollar strength persists, buying pressure in USD/JPY may become increasingly dominant.
Consistent Downtrend
Since early January of this year, USD/JPY has been consolidating consistent downward movements, shaping a solid bearish trend that has lasted through recent months. Currently, price action is once again testing a resistance zone, aligned with the downtrend line, but buying momentum has not been strong enough to break through. As a result, the dominant trend remains bearish, unless a significant bullish breakout manages to disrupt the pattern.
Neutrality in Indicators
At the moment, the RSI line is oscillating near the 50 level, while the MACD histogram remains close to the zero line. These patterns suggest a state of equilibrium between buying and selling pressure, which has led to a series of neutral movements. As long as both indicators remain in this range, it reflects a lack of dominance by either market force in the short term.
Key Levels to Watch:
145.470 – Short-Term Barrier: A level where potential bearish corrections could emerge, especially as price remains near the downtrend line under conditions of neutrality.
148.012 – Major Resistance: This corresponds to the recent multi-month highs. Sustained buying above this level could threaten the prevailing bearish trend.
142.367 – Critical Support: A level aligned with the lowest prices of recent months, which has been repeatedly respected, increasing its strength in the short term. A breakdown here could trigger a renewed bearish bias, reinforcing the ongoing downward trend.
Written by Julian Pineda, CFA – Market Analyst
Follow him at: @julianpineda25

SELL USDJPYUSDJPY massive shorts to be executed on the H4 chart. A clear double top has formed and looks matured to complete. Sell now from 145,00 and take profit at 143,00.

USDJPY What Next? SELL!
My dear followers,
This is my opinion on the USDJPY next move:
The asset is approaching an important pivot point 145.13
Bias - Bearish
Safe Stop Loss - 145.55
Technical Indicators: Supper Trend generates a clearshort signal while Pivot Point HL is currently determining the overall Bearish trend of the market.
Goal - 144.31
About Used Indicators:
For more efficient signals, super-trend is used in combination with other indicators like Pivot Points.
Disclosure: I am part of Trade Nation's Influencer program and receive a monthly fee for using their TradingView charts in my analysis.
———————————
WISH YOU ALL LUCK

USDJPY - NEW BREAKOUT !Hello Traders !
After a huge bullish move,
The USDJPY broke the resistancce level (144.748 - 144.566).
So, I expect a new bullish move🚀
______________
TARGET: 145.280🎯

In my opinion it will cone down to get the LIQIn my opinion it will cone down to get the LIQ
Trend is Bearish

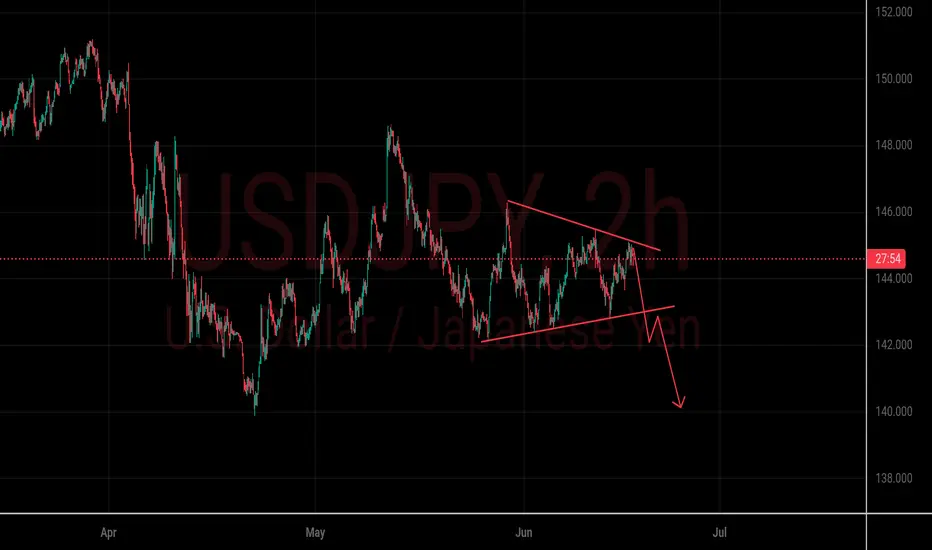
USDJPY Bearish BreakdownChart Overview
The USDJPY pair on the 2-hour chart is currently forming a descending triangle pattern — a typical bearish continuation setup.
---
Key Observations:
Resistance Line (Upper Trendline): Price is repeatedly rejected from lower highs.
Support Line (Lower Horizontal): Price maintains support around the 144.00–144.20 region.
Bearish Bias: The red arrow projection suggests a breakdown from the triangle, with a potential move toward 140.00 if the lower support fails.
---
Potential Bearish Scenario:
1. Break below ~144.00 confirms the triangle breakdown.
2. First target around 142.00, second target near 140.00.
3. Stop-loss ideally above 145.00 if entering short.
---
Disclaimer:
This analysis is for educational purposes and not financial advice. Always perform your own due diligence or consult a financial advisor before making trading decisions.
USDJPY Swing trade Signal for the Sell Once in a while we like to give a free signal. So here is one of the many trades we will have running for our subscribers.
Wait for the 1 hour candle to close below the Entry, and then a response to our entry, then you can sell.
Remember the rules, and remember your risk/reward
USDJPY Sell
🦇Entry: 143.525
⚠️Sl: 145.036
✔️TP1: 142.153
✔️TP2: 140.346
✔️TP3: 138.109
Happy trading. Any problems feel free to contact me, as over 10 years as a professional trader I can assure you there is no such thing as a stupid question.
Best,
Sarah

USDJPYHello Traders! 👋
What are your thoughts on USDJPY?
On the USD/JPY chart, price is currently moving within a symmetrical triangle pattern and is approaching the upper trendline and a key resistance zone.
We expect that upon testing this resistance level, price will likely fail to break above it and enter a bearish phase, potentially falling at least to the specified support level.
For higher-confidence sell entries, it’s recommended to wait for a confirmed downside break of the lower trendline of the triangle, which would validate a bearish continuation.
Will this resistance hold and trigger a drop, or will bulls take control? Share your thoughts below! 🤔👇
Don’t forget to like and share your thoughts in the comments! ❤️
