USDJPY trade ideas

USD/JPY Uptrend On the 4hr We can still see price making Higher Lows and Higher Highs.
Price will retrace to 145.200-145.000 before going back up to 148.000.


Daily USDJPY analysisHi everyone hope this video helps on why i take my trades and how i find secure trades. Note nothing is 100% this is all highest probability. refer to the video for all details.
happy trading everyone

USDJPY 15M KEEP THE RIDE GOING BULL TIME :))Its good area to keep the ride going
Its very good R/R TRADE (AS USUAL)

Usdjpy Long updateTarget reached for my previous UJ bulls, lets see how the chart behaves... pullback until 145.24(take profit 1) or continuation?

Bearish reversal?USD/JPY is rising towards the resistance level which lines up with 100% Fibonacci projection and also slightly below the 78.6% Fibonacci retracement and could reverse from this level too ur take profit.
Entry: 146.68
Why we like it:
There is a resistance level that lines up with the 100% Fibonacci projection and also slightly below the 78.6% Fibonacci retracement.
Stop loss: 147.95
Why we like it:
There is a swing high resistance.
Take profit: 145.21
Why we like it:
There is a pullback support level.
Enjoying your TradingView experience? Review us!
Please be advised that the information presented on TradingView is provided to Vantage (‘Vantage Global Limited’, ‘we’) by a third-party provider (‘Everest Fortune Group’). Please be reminded that you are solely responsible for the trading decisions on your account. There is a very high degree of risk involved in trading. Any information and/or content is intended entirely for research, educational and informational purposes only and does not constitute investment or consultation advice or investment strategy. The information is not tailored to the investment needs of any specific person and therefore does not involve a consideration of any of the investment objectives, financial situation or needs of any viewer that may receive it. Kindly also note that past performance is not a reliable indicator of future results. Actual results may differ materially from those anticipated in forward-looking or past performance statements. We assume no liability as to the accuracy or completeness of any of the information and/or content provided herein and the Company cannot be held responsible for any omission, mistake nor for any loss or damage including without limitation to any loss of profit which may arise from reliance on any information supplied by Everest Fortune Group.

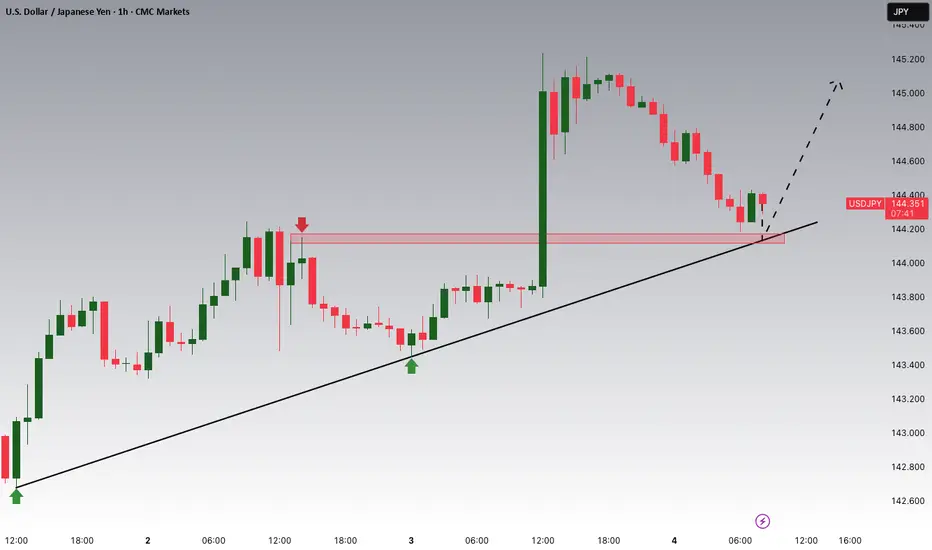
Potential Long position on USDJPYReasons I think this pair will rise:
- Confirmed trend line meaning harder breakout
- Price printed higher low after bouncing off trend line signaling momentum loss
- RSI oversold on Daily chart
What do you think?

USDJPY - Cypher Pattern Walkthrough & Continuation TradeA walkthrough of a potential Bearish Cypher pattern & a look at another opportunity that has recently popped up ahead of the potential pattern setup.
Questions or Comments - Leave them below!
Akil

USDJPY Potential UpsidesHey Traders, in today's trading session we are monitoring USDJPY for a buying opportunity around 144.100 zone, USDJPY is trading in an uptrend and currently is in a correction phase in which it is approaching the trend at 144.100 support and resistance area.
Trade safe, Joe.
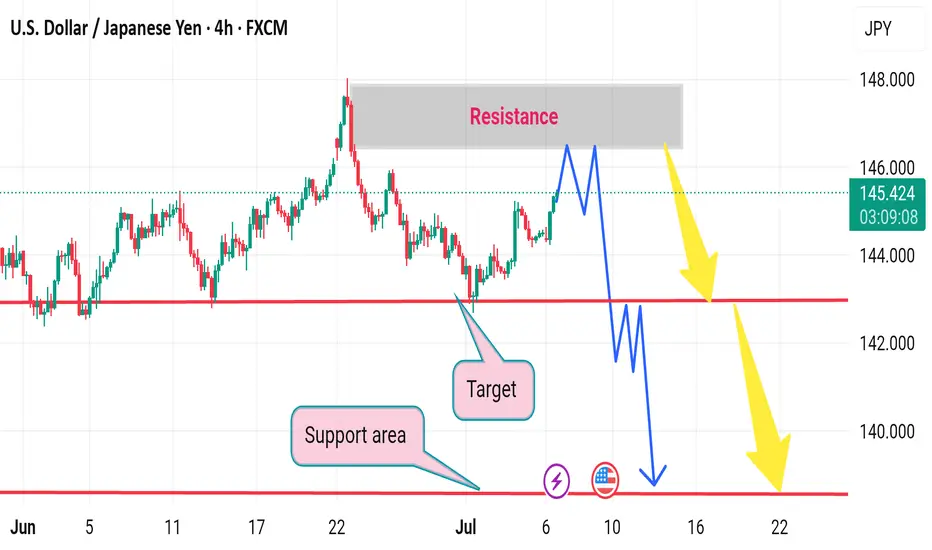
USDJPY POSSIBLE SELL FROM THE PULLBACK RESISTANCE From the H4 perspective, I anticipate a sell off from the pullback resistance level of 145.895 from the technical standpoint, I expect price to drop! A sell opportunity is envisaged from the current market price.

USDJPY Price Accumulated|Time For Bullish Distribution|Setupsfx|The price has accumulated nicely and is now distributing. We have three targets in mind, but set your own based on your analysis. Our approach is purely technical, but also includes a basic fundamental approach. This analysis concludes over 1500 pips and is a swing move. Please use this analysis as educational purposes only, as it does not guarantee that price will move exactly as predicted.
If you like our idea, please consider liking and commenting on it.
Good luck and trade safely!
Team Setupsfx_

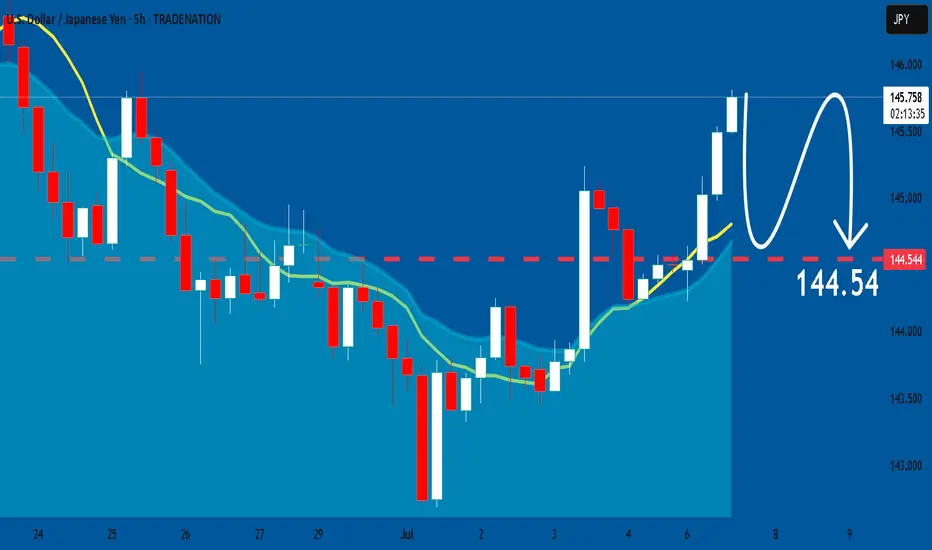
USDJPY: Bearish Continuation is Highly Probable! Here is Why:
Remember that we can not, and should not impose our will on the market but rather listen to its whims and make profit by following it. And thus shall be done today on the USDJPY pair which is likely to be pushed down by the bears so we will sell!
Disclosure: I am part of Trade Nation's Influencer program and receive a monthly fee for using their TradingView charts in my analysis.
❤️ Please, support our work with like & comment! ❤️
USDJPY Wave Analysis – 7 July 2025
- USDJPY reversed from long-term support level 142.50
- Likely to rise to resistance level 148.00
USDJPY currency pair recently reversed up from the support zone located between the long-term support level 142.50 (which has been steadily reversing the price from August of 2024, as can be seen from the daily USDJPY chart below) and the lower daily Bollinger Band.
The upward reversal from this support zone stopped the previous short-term ABC correction 2 from the end of June.
Given the strength of the support level 142.50 and the strongly bearish yen sentiment seen today, USDJPY currency pair can be expected to rise to the next resistance level 148.00 (top of the previous waves 4, (1) and 1).

USDJPY ReversalUSDJPY started selling off nicely on Friday late trading session. Price has quickly regained bullish momentum but, we can expect a nasty reversal from this supply area towards 143,333

SELL USDJPYIn todays session we are monitoring USDJPY for selling opportunity. Our entry is at 145.746 and our stops are above 146.357 . Our targets is 143.376. Use proper risk management. Cheers

Japan Seeks US Deal as Tariff Deadline NearsThe yen hovered around 145 per dollar Friday after a nearly 1% drop in the previous session, pressured by trade uncertainties as Tokyo seeks a deal with Washington before next week’s deadline. Trump may announce new tariffs or extend deadlines today, having previously threatened tariffs up to 35% on Japanese goods over low US rice and car imports.
The yen also weakened as a stronger US dollar followed a better June jobs report, easing recession fears and reducing near-term Fed cut chances. In Japan, May household spending grew more than forecast, supported by government efforts to increase demand.
The key resistance is at $145.35, meanwhile the major support is located at $143.55.

USD/JPY - continue with the UptrendOn USD/JPY , it's nice to see a strong buying reaction at the price of 143.860.
There's a significant accumulation of contracts in this area, indicating strong buyer interest. I believe that buyers who entered at this level will defend their long positions. If the price returns to this area, strong buyers will likely push the market up again.
(FVG) - Fair Value GAP and high volume cluster are the main reasons for my decision to go long on this trade.
Happy trading
Dale


USDJPY LONGMarket structure bullish on HTFs DH
Entry at both Weekly and Daily AOi
Weekly Rejection at AOi
Daily Rejection At AOi
Previous Structure point Daily
Around Psychological Level 144.000
H4 Candlestick rejection
Rejection from Previous structure
Levels 2.91
Entry 95%
REMEMBER : Trading is a Game Of Probability
: Manage Your Risk
: Be Patient
: Every Moment Is Unique
: Rinse, Wash, Repeat!
: Christ is King.

BUY usdjpy
The JPY sector is going to be the most promising sector, for the next half of the year, low risk, huge margin of safety, economic indicators are supportive of the pairs intrinsic value .
It's advisable to place huge amount of your portfolio into this sector

USDJPY FREE STRATEGYHere is a brief strategy on how to successfully trade usdjpy and become profitable.

USDJPY h4 strong downResistance Reversal Zone: 145.80–146.20 (watch for break or rejection).
Support Trap Area: 143.80–144.20 (possible fakeout and rally).
Breakout Confirmation: Sustained candle close above 146.30.