USD/JPY - Channel BreakoutThe USD/JPY pair on the M30 timeframe presents a Potential Selling Opportunity due to a recent Formation of a Breakout Pattern. This suggests a shift in momentum towards the downside and a higher likelihood of further advances in the coming hours.
Possible Short Trade:
Entry: Consider Entering A Short Position around Trendline Of The Pattern.
Entry (Sell Limit): 144.435
Stop Loss: 144.669
Take Profit: 143.768
This is Sell Limit entry and wait for pullback to enter the trade
USDJPY trade ideas

Analysis on USD/JPY LONGHello! As we all know the Thursday NFP came in positive for USD thereby making usd to be in stronger position against the JPY. More analysis are stated below
US–Japan Interest Rate Divergence
Bank of Japan (BoJ) remains cautious post its January rate hike, with rates near 0.5% and monetary policy likely on hold through 2025
U.S. Federal Reserve (Fed) has postponed cuts amid robust job data and inflation above target; markets have pulled forward rate cut expectations to autumn rather than summer .
The interest-rate gap (USD >4%, JPY ~0.5%) favours a stronger dollar but carries a steep “carry cost” for yen investors .
Economic Outlooks & Trade Dynamics
Japan’s Q2 business sentiment (Tankan) is slightly positive, despite export weakness due to tariff risks
U.S.–Japan trade tensions are escalating, with looming tariffs on Japanese car imports potentially impacting growth and yen sentiment
reddit.com
Persistent Japanese inflation (~2.5% in Tokyo) and wage gains (~2.8%) bolster long-term BoJ tightening expectations
Summary: The dollar remains supported by stronger U.S. policy and treasury yields. Meanwhile, Japan’s cautious BoJ, inflation, and trade vulnerabilities push the yen—and thus USD/JPY—into a volatile bracket.


Buy USDJPYUSDJPY remains in an uptrend on the 1-hour chart and is currently testing the trendline for the third time. A strong bullish reaction at this level may signal a potential buying opportunity.

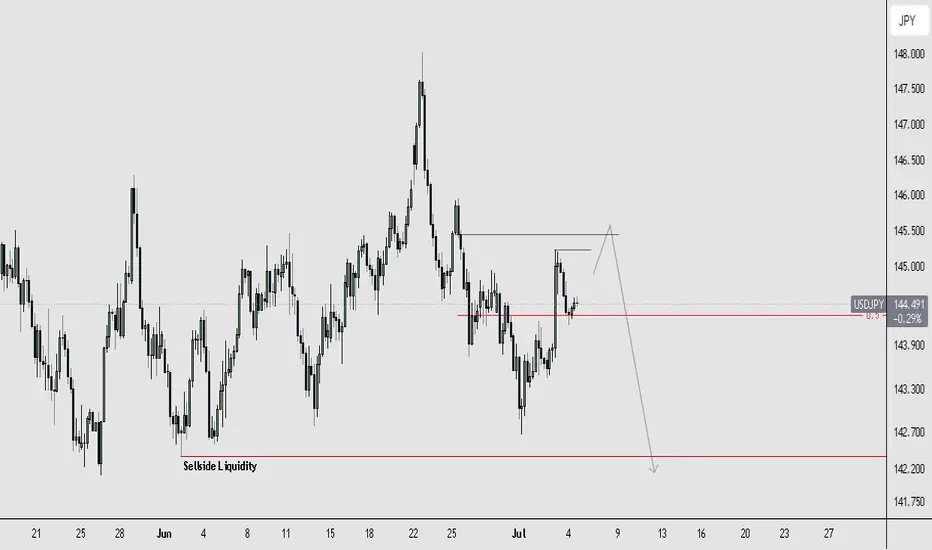
USDJPY BEARISH SETUPI am expecting price to raid the buyside liquidity resting above the previous week high. This area coincides with a Bearish Order Block (OB) that I have marked as the ideal zone for price to reverse from.
Execution Outlook:
Bias: Bearish
Short-Term Expectation: Price to push higher to raid buyside liquidity and tap into the OB.
Trigger Zone: OB above the 50% level – this is where I expect the reversal.
Target: Sell-side liquidity below the recent swing lows (~142.200 area).
Invalidation: A clean break and close above the OB would invalidate the bearish idea.
USDJPY TRADE SETUPMarket trend is broken i hope this week continue to up so let's see what happenned guys


USDJPY Daily TF - July 6th, 2025USDJPY 7/6/2025
USDJPY Daily Neutral Idea
Monthly - Bullish
Weekly - Bearish
Daily - Bearish
We’re still on the daily timeframe with UJ as there is nothing worthwhile. We are clearly in some daily consolidation phase and price action has no clear direction from a swing perspective.
Bearish Continuation - For us to consider a bearish continuation, which is the most likely, we would like to see a retest of our 147.500 zone followed by strong bearish rejection. If we can spot rejection around the 147.500 zone it could present some decent short positions. I’d be looking to target lower toward key support levels.
Aside from this potential setup i’m not looking at any other scenarios for UJ.

USD/JPY Range- weekly chart setupUSD/JPY abhi ek strong range-bound structure mein trade kar raha hai jisme clearly defined support aur resistance zones dikhai de rahe hain. Chart par price 144.50 ke aas paas consolidate kar raha hai, jahan se dono directions mein breakout ka potential bana hua hai.
📉 Resistance Zone: 145.80 – 146.20
📈 Support Zone: 142.30 – 142.70
🔍 Current Price: 144.50 (As of July 6, 2025)
🧠 Trading Scenarios:
🔽 Bearish Scenario:
Agar price 145.80 zone se reject hota hai, to short-term selling pressure dekhne ko mil sakta hai, jisme target 1: 143.50 aur target 2: 142.50 ka ho sakta hai.
🔼 Bullish Scenario:
Agar price support zone (142.50) se strong bounce karta hai, to range ke upper bound (145.80) tak ka upside move expected hai. Breakout ke baad extended target 147.00+ tak ho sakta hai.
📊 Timeframe: 4H
📍 Setup Type: Range Trade | Mean Reversion | Breakout Watch
💬 Idea by: Liquidity_Gold_FX
🔔 Follow for more FX setups and updates.

WaverVanir DSS Trade Plan – JPYUSD=X (July 6, 2025)🧭 Directional Bias: Bullish Reversal from Discount Zone
📉 Current Price: 0.006919
🧠 Thesis:
Price reacted strongly from the Discount Wick Low Zone (≈ 0.006885–0.006856).
The current structure shows:
✅ CHoCH to the upside near the EQ
✅ Volume cluster support at 0.00691
🟦 Liquidity sweep occurred at prior lows.
Expecting a reversal back into Premium zone toward Fibonacci extension clusters near 0.00707–0.00711.
🎯 Trade Setup: Long JPY/USD (Short USD/JPY)
Element Value / Zone
Entry Zone 0.00691–0.00692 (Equilibrium / 0.618 Fib)
Stop Loss (SL) 0.006875 (below recent Discount Low / 0.786 Fib)
Take Profit 1 0.006978 (0.886 Fib / SMC Break level)
Take Profit 2 0.00707 (1.236 Fib / major OB target)
Take Profit 3 0.007112 (38.2% extension – long-term target)
Risk-Reward TP1 ≈ 2.3:1, TP2 ≈ 3.6:1, TP3 ≈ 5.4:1
🔍 Volume Profile Insight:
Heavy accumulation at:
0.00691 (high confluence of OB, Fib, and volume)
Above 0.00695, price enters "inefficient" zone → price may accelerate rapidly.
Most volume near 0.00692 confirms institutional interest.
🔐 Risk Management:
Max 1–2% capital exposure per position
Position sizing should reflect SL width of ~4.4 pips
Trailing stop once TP1 is reached to protect profits
🔄 Alternate Scenario (Invalidate if):
Price breaks and closes below 0.006875 with high volume
Then, revisit 0.006758 (Golden Zone) as next long accumulation zone
Consider reversing bias if a CHoCH to the downside occurs post TP1 rejection
⏱️ Timeframe:
Holding Period: 2–5 days (swing scalping opportunity)
Suitable for: CFD traders, JPY futures traders (e.g., J6), or FX options buyers
🔗 Suggested Option Strategy (for FX traders using options):
Bull Call Spread on JPYUSD=X or inverse Put Spread on USDJPY
Strike range:
Expiry: July 12–19
✅ Summary:
Execute long from Equilibrium zone (~0.00691) toward 0.00707–0.00711. Strong confluence from Fib extensions, SMC structure, and volume profile validates a reversal.
Protect with tight SL under 0.006875. Scale out at key premiums.

JPY/USD – Compression Breakout Toward Fib Extension Zone | High-📈 JPY/USD – Compression Breakout Toward Fib Extension Zone | High-Conviction DSS Setup
🧠 WaverVanir DSS | Fib x Volume x Structure Alignment
🔹 Timeframe: 1H
🔹 Instrument: JPY/USD
🔹 As of: July 6, 2025
🔹 Bias: Bullish Breakout
🔹 Conviction: High-Probability Reversal-Continuation Hybrid
🔍 🧠 Thesis Summary
JPY/USD has coiled into a symmetrical triangle following a strong internal structure shift. With price compressing against major Fib/SMC levels and anchored volume support at 0.00685–0.00690, the most probable outcome is a bullish breakout targeting the 127–161% extension levels.
🧮 📊 Probabilistic Trade Plan
Element Value
🎯 Entry Zone 0.00691–0.00693 (live)
📍 SL (Invalidation) 0.006758 (structural)
🎯 TP1 0.00715 (Fib 50%)
🎯 TP2 0.00732 (Fib 100%)
🛸 Final TP3 0.00745–0.00754 (127–161%)
📈 R/R ~1:3.5+ (conservative trail)
📊 Probability ~72% (VolanX DSS Estimate)
🔐 Confluence Stack
✅ Volume Profile: Major absorption at 0.00685–0.00690
✅ Fibonacci Expansion: Break above 1.0 targets 127–161%
✅ Structure: Break of descending triangle + higher low
✅ Macro Tailwind: BOJ policy weakness + USD resilience
✅ No Major Resistance until 0.00732–0.00745
🧠 Risk Logic
Breakdown below 0.006758 = invalidate bull thesis (structural fail)
Favor scaling out at TP1 and TP2, trail runner to TP3
If price consolidates under 0.00701, wait for re-confirmation
📍 Visuals (Chart Already Published)
📌 See attached chart for full Fib ladder and volume path tracking
🔄 Execution Note
This is a probabilistic trigger-based plan, not a fixed signal. Align entry only after confirmation of strength above 0.007007 (1.0 Fib breakout zone).
⚠️ Disclaimer
This is a strategic framework powered by WaverVanir’s VolanX DSS. Manage risk accordingly.

USD/JPYusdjpy did not take last days high or low, but in did manipulate london's high in new york session, as you can see london and NewYork made low resistance liquidity, that is most likely to be taking out sundays opening, on high time frame we are on a resistance for so called order block, we touch near the zone once and then took out people who put there stop loss there, creating a turtle soup, we a most likely to go after friday low as target, this is not finance advice.

USDJPYUSDJPY Exchange Rate
USDJPY: 144.495(July 5, 2025)
The pair has been trading in the 144.0–145.0 range in early July, reflecting recent yen strength and a broadly weaker US dollar and japan economic outlook.
10-Year Government Bond Yields
Country 10-Year Yield Date
Japan 1.45%
US 4.31-4.38%
Yield Spread (US10Y - JP10Y):
2.86 percentage points (US yield higher)
Policy Interest Rates
Country Policy Rate
Japan 0.50%
US 4.25–4.50%
Key Insights
USDJPY:
The yen has strengthened in 2025, with USDJPY falling from above 160 earlier in the year to the mid-144s in July. This reflects narrowing yield differentials and shifting global risk sentiment.
Bond Yields:
The US 10-year yield remains elevated at 4.31-4.38%, while Japan’s 10-year yield is at 1.45-1.43%, since 2019 jp10y is on the rise ,reflecting japan strong economic outlook
Yield Differential:
The US-Japan 10-year bond yield spread is 2.86%, favoring the US dollar. However, this spread has narrowed from earlier highs, contributing to recent yen strength.
Interest Rate Policy:
The Federal Reserve maintains a 4.25–4.50% target range, with markets expecting possible cuts later in 2025.
The Bank of Japan holds its policy rate at 0.50%, the highest since 2008, but remains cautious about further hikes due to growth and inflation uncertainties.
Summary Table
Metric US Japan Differential
Policy Rate 4.25–4.50% 0.50% 3.75–4.00%
10-Year Bond Yield 4.31% 1.45% 2.86%
Market Implications
USDJPY Direction:
The narrowing yield spread and expectations of Fed rate cuts have pressured USDJPY lower, supporting the yen.
Bond Differential:
The still-wide, but narrowing, US-Japan yield gap remains a key driver for capital flows and currency moves.
Interest Rate Outlook:
Any shift in Fed or BOJ policy will directly impact both the yield spread and USDJPY direction in the coming months.
#usdjpy


USD/JPY at Crossroads: Breakout or Big Drop Ahead? USD/JPY Analysis – July 2025
🔍 Technical:
Price: 144.50
Key Resistance: 149.50
Key Support: 140.12, then 117.64
Two possible moves:
Bullish: Break above 149.50 → Target 156+
Bearish: Stay below 149.50 → Drop to 140 → 128 → 117
🌍 Fundamental:
USD Strength: If inflation stays high, Fed may delay rate cuts.
JPY Strength: BOJ may shift policy or intervene if Yen weakens more.
🔑 Upcoming Events:
July 11 – US CPI
BOJ outlook & Fed comments matter
🎯 Outlook:
Bearish bias if price stays below 149.50.
Bullish only if clean breakout above resistance.

USDJPY| - Bullish Structure Holding | Waiting For Mitigation Pair: USDJPY
Bias: Bullish
Timeframes: 4H, 30M, LTFs
• 4H is showing clean bullish structure — internal high was breached, confirming bullish pressure.
• 30M broke the LH, showing further signs of demand holding.
• Now waiting on price to return and mitigate the OB zone for possible LTF confirmation.
🔹 Entry: Once price hits OB and gives CHoCH/sweep confirmation on LTFs
🔹 Entry Zone: Marked OB on 30M
🔹 Target: Near structure highs (continuation path if demand holds)
Mindset: Ride the wave, not the noise. Let the structure print, and don’t blink when price gives your cue.
Bless Trading!

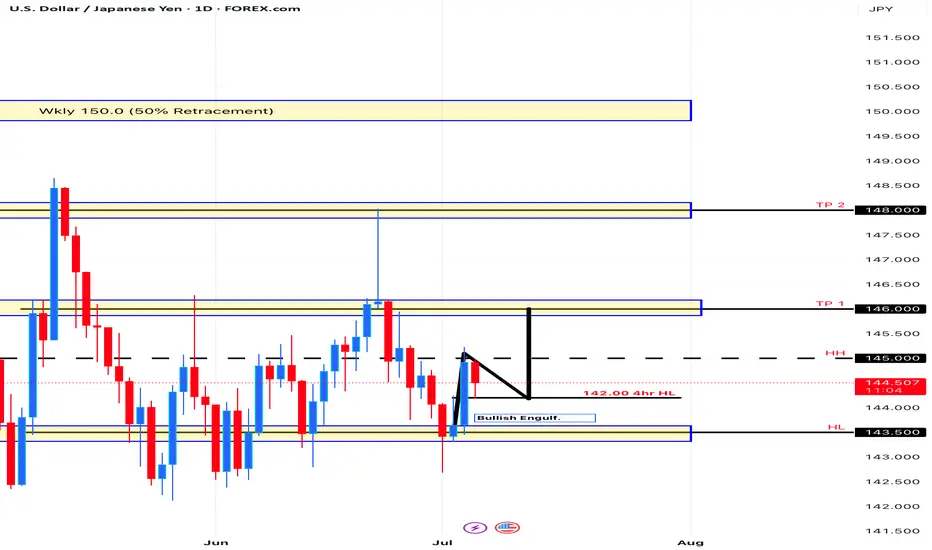
Uptrend USD/JPYDaily - uptrend
4hr- uptrend
Price hit a key level at 145.000
We can possibly see a retrace back to the 4hr HL @ 144.200 then shoot up to the 1st TP @ 146.000
USD/JPY pair struggles due to a weaker US DollarOn the JPY side, nothing has changed fundamentally, and the currency has been mainly driven by the risk sentiment. As a reminder, the BoJ kept interest rates unchanged at 0.5% and reduced the bond tapering plan for fiscal year 2026 as expected at the last meeting. The BoJ continues to place a great deal on the US-Japan trade deal and the evolution of inflation.
USD/JPY is moving lower despite the disappointing Industrial Production report from Japan. The report showed that Industrial Production increased by +0.5% month-over-month in May, compared to analyst forecast of +3.5%. However, I think that if we respect this area, we might see upward momentum coming soon.

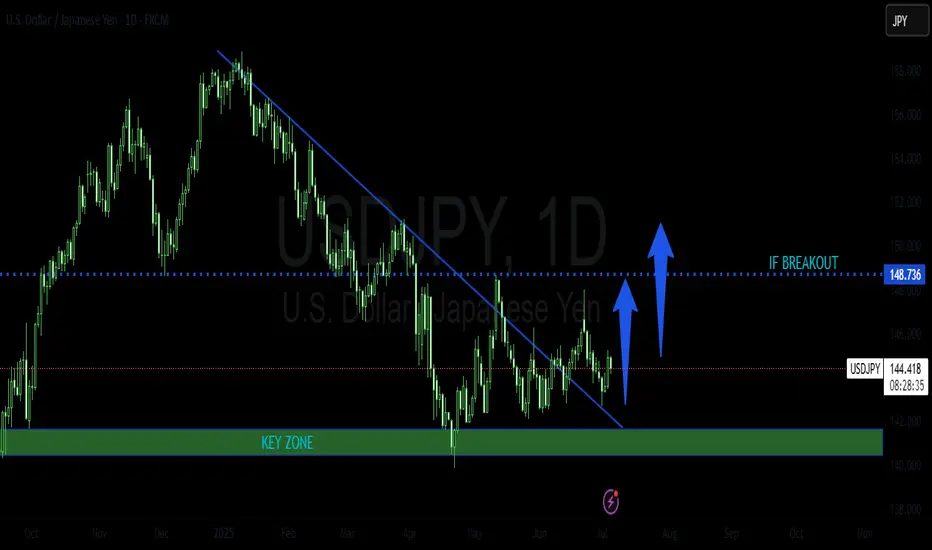
USDJPY POSSIBLE LONG TRADE PLANThe pair has been trading in a bearish trend for sometime now. It has recently rejected near a key zone and broke out a falling trend line. It looks like it is now retesting this zone before initiating a bull movement.
Please do your own analysis before placing any trades.
Cheers and happy trading !!!

Trading Recommendations and Analysis for USDJPYThe technical picture on Monday may shape future developments in the medium term. The week began a gap up, followed by the formation of a long upper shadow. The daily close occurred exactly at the support level of 146.11 thereby closing the gap.
Today's trading also opened exactly at the same level, and the candle is already black in the early hours of trading. This defines Monday's movement as false, thus creating a strong bearish signal, with a potential breakdown of the 143.45 support and a subsequent decline toward the MACD line, which coincides with the target level of 141.70. The Marlin oscillator has turned downward. its return to negative territory will add additional pressure on the price.
In the H4 timeframe, the price has consolidated below the 146.11 level, making it easier to settle below the MACD line eventually.
A break below 145.48 -the June 11 high-will serve as confirmation. The Marlin oscillator appears to be fixed in bearish territory and has joined the new downward movement.

USD/JPY loses bulk of NFP-related gainsThe USD/JPY has given back a bulk of yesterday's NFP-driven gains. Although the data was not as strong as the headlines suggested, the fact that we saw decent moves in bond and equity markets suggests investors were overall impressed by the figures. So it seems the market is preparing itself for some more tariff-related volatility as we approach the 9 July deadline, when 'Liberation Day' tariffs will revert. Trump has suggested letters are being sent out to trading partners over the next few days, informing them of their new tariff rate. If you recall, during the worst of April's volatility, the likes of the franc, euro and yen were all outperforming. Could we see a similar pattern this time?
Well, looking at the USD/JPY, traders have certainly sold into yesterday's rally. But we need a more decisive breakdown of support between 140.00-140.25 now to trigger some long side liquidation. Below this area, key support comes in around 142.50. Resistance comes in at 145.00, followed by 146.00.
By Fawad Razaqzada, market analyst with FOREX.com

USDJPY 4-Hour Technical Analysis (Smart Money Concept Breakdown)📈 Overall Market Structure Overview:
The chart reflects a multi-phase Smart Money playbook, consisting of:
Bullish channel structure
Breakout followed by liquidity sweep
Supply zone flip to demand
Price mitigation and structure shift
Anticipated reaction zone for upcoming move
🔎 Phase-by-Phase Analysis:
🧱 1. Ascending Channel Formation
Price was moving upward in a controlled bullish ascending channel, suggesting institutional accumulation with planned distribution above highs.
The channel breakout was the first significant liquidity event, where early breakout traders were baited.
💧 2. Fakeout and Supply Interchange into Demand (Ellipse Zone)
Once the channel broke, price sharply reversed, retracing into a previous supply zone.
However, institutions defended this zone, flipping it into a demand area.
This behavior, marked with the blue ellipse, signals “Supply Interchange in Demand” – a core SMC concept.
Here, orders were absorbed
Liquidity was trapped below
A bullish push confirmed institutional intent
🎯 3. Previous Target Hit – Completion of Bullish Leg
Price made a strong rally from the demand zone, hitting the previous target near 147–148 zone.
This bullish leg created a Major Break of Structure (BOS) confirming bullish dominance at that phase.
⚠️ 4. Distribution Begins: Shift in Momentum
After reaching the Major BOS area, price failed to hold higher levels.
A decline followed, indicating distribution by smart money.
The reaction was sharp and consistent, creating lower highs, signaling weakness.
🔄 5. Minor CHoCH Formation – Early Reversal Signal
A Minor Change of Character (CHoCH) occurred around the 144.000–143.000 area.
This is a key transition, where smart money transitions from bullish intent to potential bearish delivery.
📦 6. Next Target Zone – Bullish POI (Point of Interest)
The chart identifies a next target demand zone around 141.800–141.200, marked in green.
This zone:
Holds unmitigated demand
Sits below a recent liquidity pool
Aligns with past support
This is where Smart Money could re-enter, offering a long opportunity if a bullish CHoCH or BOS forms from that zone.
📊 Trade Scenarios & Forecast:
🔻 Bearish Short-Term Play (Sell Setup):
If price respects current resistance (144.500–145), and a lower high forms:
Short entry opportunity
Target: 142.000–141.200 demand zone
Confirmation: Strong bearish candle, CHoCH below minor support
🔺 Bullish Reversal Play (Buy Setup):
At the demand zone:
Look for bullish reaction + CHoCH or BOS
Long entry potential
Target: Retest of 144.000 or even 147.000 if liquidity allows
🔐 Smart Money Tactics in Play:
Liquidity Engineering:
Price trapped both bulls (at highs) and bears (below ellipse zone)
Supply into Demand Flip:
A classic trap where supply becomes a launchpad for bullish delivery
Minor CHoCH:
Early signal of intent change
Next POI (Point of Interest):
Potential reaccumulation zone below major liquidity grab
🧠 Educational Takeaway:
This analysis illustrates:
Why breakouts are often traps without confirmation
How to identify real institutional zones
The role of CHoCH/BOS in planning ahead
Importance of waiting for price to come to your levels, not chasing
⚠️ Risk & Caution:
News catalysts can cause deviation from technical levels
Always use stop loss and proper risk management
SMC is about patience and precision, not prediction
✅ Summary:
USDJPY is showing early signs of a smart money distribution and a potential pullback toward demand.
Watch closely for confirmation at the key zone (141.800–141.200) before engaging long. Until then, short setups on rallies may be favorable.
