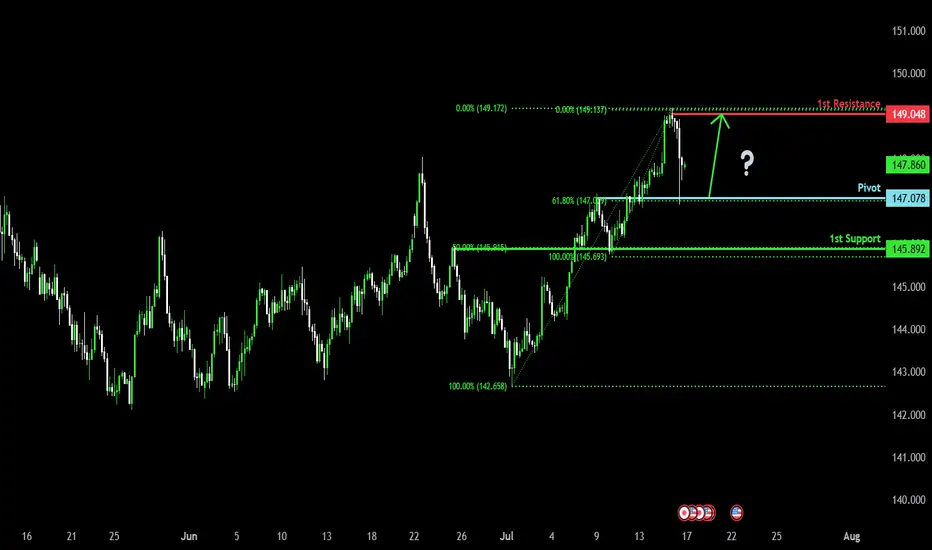
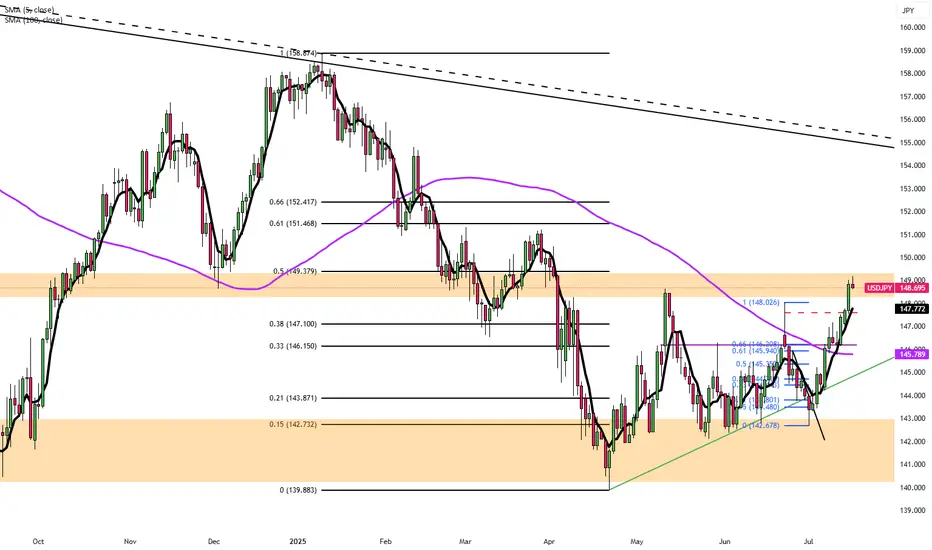
Bullish bounce off pullback support?USD/JPY is falling towards the pivot which aligns with the 61.8% Fibonacci retracement and could bounce to the 1st resistance.
Pivot: 147.07
1st Support: 145.89
1st Resistance: 149.04
Risk Warning:
Trading Forex and CFDs carries a high level of risk to your capital and you should only trade with money you can afford to lose. Trading Forex and CFDs may not be suitable for all investors, so please ensure that you fully understand the risks involved and seek independent advice if necessary.
Disclaimer:
The above opinions given constitute general market commentary, and do not constitute the opinion or advice of IC Markets or any form of personal or investment advice.
Any opinions, news, research, analyses, prices, other information, or links to third-party sites contained on this website are provided on an "as-is" basis, are intended only to be informative, is not an advice nor a recommendation, nor research, or a record of our trading prices, or an offer of, or solicitation for a transaction in any financial instrument and thus should not be treated as such. The information provided does not involve any specific investment objectives, financial situation and needs of any specific person who may receive it. Please be aware, that past performance is not a reliable indicator of future performance and/or results. Past Performance or Forward-looking scenarios based upon the reasonable beliefs of the third-party provider are not a guarantee of future performance. Actual results may differ materially from those anticipated in forward-looking or past performance statements. IC Markets makes no representation or warranty and assumes no liability as to the accuracy or completeness of the information provided, nor any loss arising from any investment based on a recommendation, forecast or any information supplied by any third-party.
USDJPY trade ideas
USDJPY (Daily Update) 17/07hi everyone as we yesterdays video is pretty much showing us whats happened today i did not go in as much detail but hopefully this video you find helpful. as always happy trading

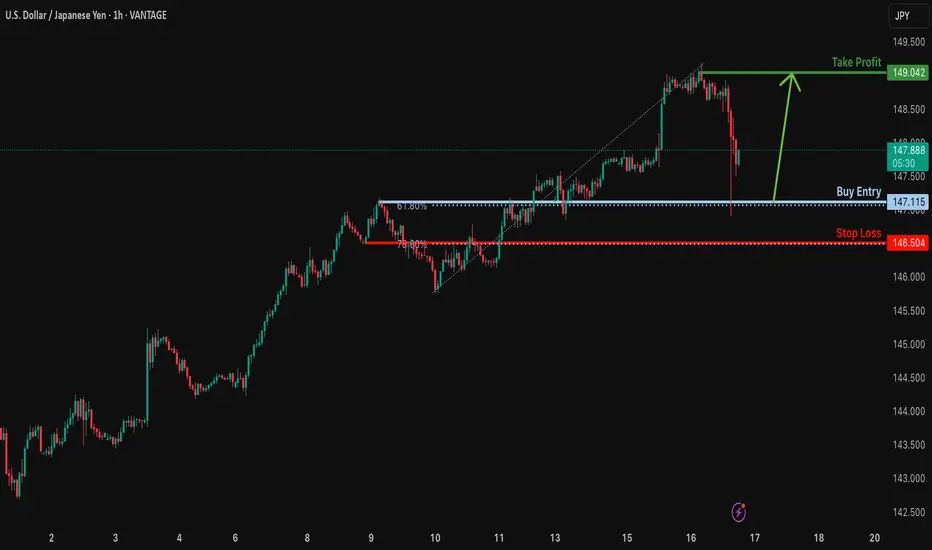
Bullish bounce off 61.8% Fibonacci support?USD/JPY is falling towards the support level which is an overlap support that aligns with the 61.8% Fibonacci retracement and could bounce from this level to our take profit.
Entry: 147.11
Why we like it:
There is an overlap support that lines up with the 61.8% Fibonacci retracement.
Stop loss: 146.50
Why we like it:
There is a pullback support that lines up with the 78.6% Fibonacci retracement.
Take profit: 149.04
Why we like it:
There is a pullback resistance.
Enjoying your TradingView experience? Review us!
Please be advised that the information presented on TradingView is provided to Vantage (‘Vantage Global Limited’, ‘we’) by a third-party provider (‘Everest Fortune Group’). Please be reminded that you are solely responsible for the trading decisions on your account. There is a very high degree of risk involved in trading. Any information and/or content is intended entirely for research, educational and informational purposes only and does not constitute investment or consultation advice or investment strategy. The information is not tailored to the investment needs of any specific person and therefore does not involve a consideration of any of the investment objectives, financial situation or needs of any viewer that may receive it. Kindly also note that past performance is not a reliable indicator of future results. Actual results may differ materially from those anticipated in forward-looking or past performance statements. We assume no liability as to the accuracy or completeness of any of the information and/or content provided herein and the Company cannot be held responsible for any omission, mistake nor for any loss or damage including without limitation to any loss of profit which may arise from reliance on any information supplied by Everest Fortune Group.
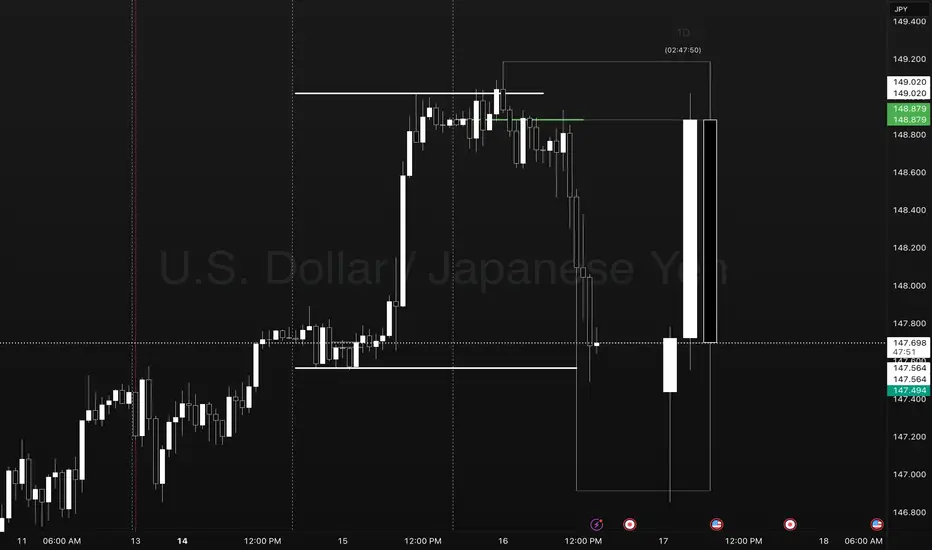
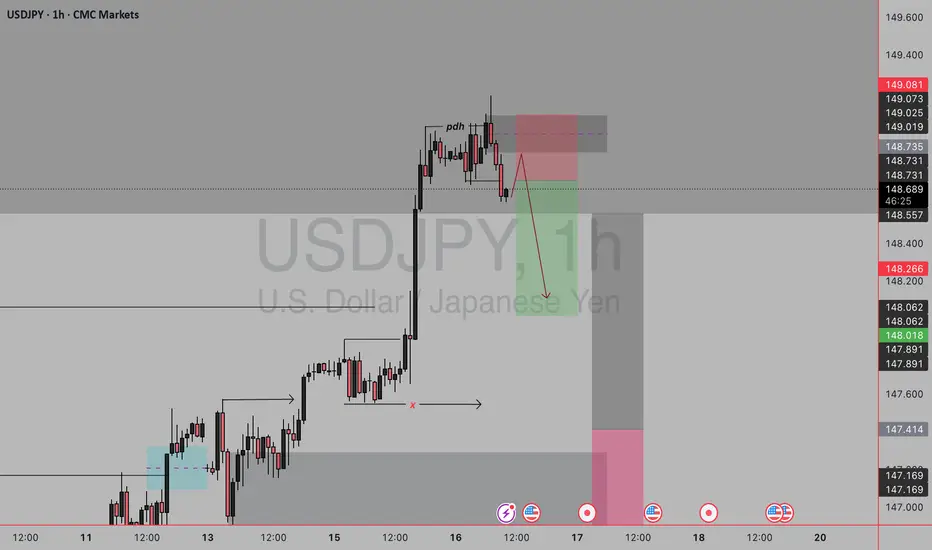
Pump Coil Dump Day 1-2-3 USDJPYUSDJPY Reversal Trade.
Points to Notice
Day 1 - Sets the new week high and low. Establishes a new week closing price as a target for a day 3 setup.
Day 2 - Typically expands Mondays range in the direction of the underlying oder flow. This occurs as a pump/ dump leading to the Asia and London coil sideways.
Day 3- We take note of the previous day high and low to observe price going into the NY session. In this case Price gave signs of a coiling reversal into the evening setting up for the move below Day 2 closing price.
Ideally what you want to see in this template is traders faked into a breakout move in the direction of the pump. This can present as a candle close above yesterdays high or closing price.
After trapping traders in we see the change in order flow creating a new lower low. This is the confirmation to look for an entry at the previous days closing price.
We set a stop at the high of day 3 level or at the previous days high with a target at the previous days low. In extreme cases we may see a setup that expands to the LOW level.
THE ONLY IMPORTANT DATA POINTS.
- PREVIOUS DAY HIGH AND LOW
- CLOSING PRICE
- LOW HOW LEVELS
- DAY COUNT
MARKETS ONLY DO TWO THINGS
- BREAKOUT, FAIL, REVERSE
- BREAKOUT, RETEST, TREND.
ONLY LEVELS THAT ARE TRADED
- PREVIOUS DAY HIGH (STOP LOSS)
- PREVIOUS DAY CLOSING PRICE (ENTRY)
- PREVIOUS DAY LOW (TARGET) CMCMARKETS:USDJPY FX:EURUSD OANDA:USDJPY
We sell again. * Price is now sitting below broken support, and any pullback might act as a **lower high** setup.

16.07.2025 #USDJPYSELL 148.770 | STOP 149.400 | TAKE 148.000 | ⏳ Close the trade in profit or move Stop Loss to breakeven after the price passes +25 pips.
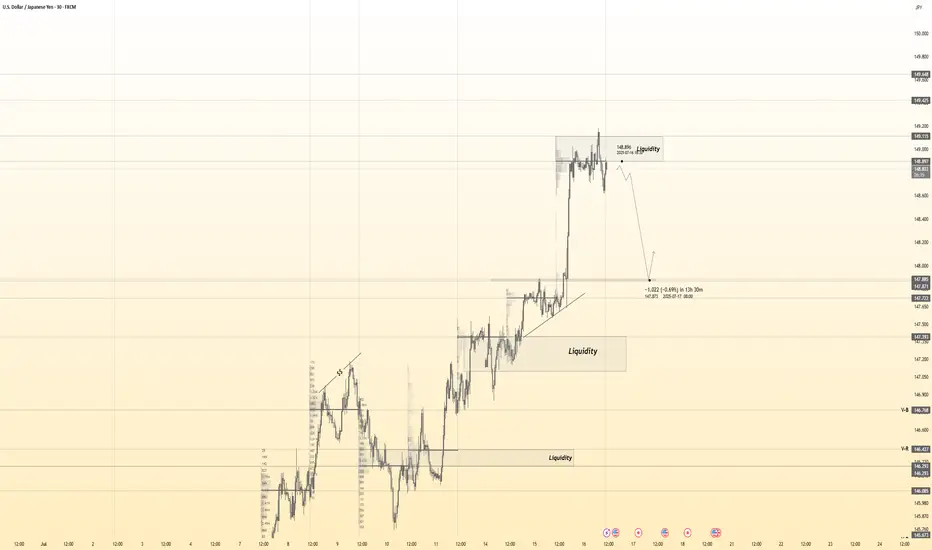
USDJPY 30Min Engaged ( Bearish Entry Detected )Time Frame: 30-Minute Warfare
Entry Protocol: Only after volume-verified breakout
🩸Bearish move from : 148.900 Zone
➗ Hanzo Protocol: Volume-Tiered Entry Authority
➕ Zone Activated: Dynamic market pressure detected.
The level isn’t just price — it’s a memory of where they moved size.
Volume is rising beneath the surface — not noise, but preparation.
🔥 Tactical Note:
We wait for the energy signature — when volume betrays intention.
The trap gets set. The weak follow. We execute.
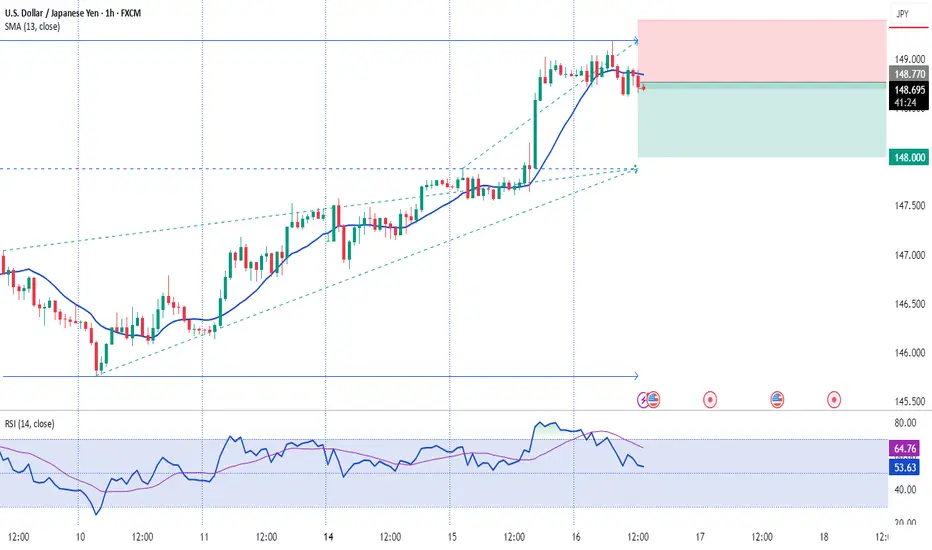
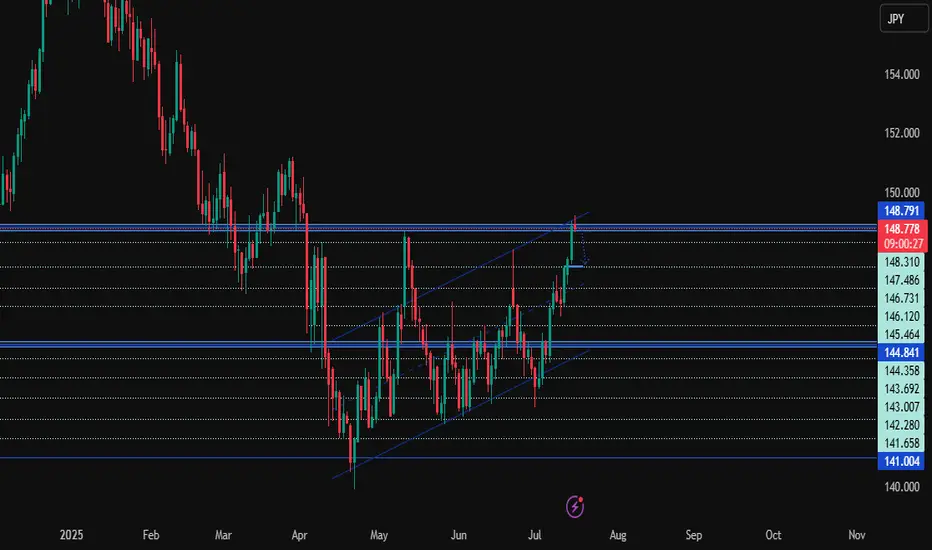
USDJPY Hits Rising Channel Ceiling: Will Bears Take Control?Hey Traders,
USDJPY has just tapped the top of its ascending channel around the 148.70 resistance- an area that has historically triggered bearish reactions. With signs of rejection and waning bullish momentum, we’re now at a potential inflection point for short-term downside retracement.
Current Market Conditions:
Price has reached and slightly wicked above the upper boundary of a rising channel.
Strong resistance zone between 148.70 – 148.79 aligns with prior swing highs.
Early signs of bearish rejection can be seen on the latest candle close.
Short-term structure suggests the potential for a pullback toward 147.48 or lower if sellers gain traction.
Fundamental Analysis/Outlook:
Recent USD strength has been driven by sticky U.S. inflation and hawkish Fed commentary, but JPY fundamentals are catching attention. BoJ is under pressure to shift policy due to rising wage growth and inflation spillover effects. If upcoming Japanese data supports tightening or USD weakens on risk-off sentiment, we could see a meaningful retracement in USDJPY.
Targets:
TP1: 147.486
TP2: 146.120
TP3: 144.841
Risk Management:
Stop-loss: Above 148.80 (channel breakout confirmation)
Maintain a minimum 1:2 R:R.
Trail stops if structure breaks lower (e.g., loss of 147.48 support).
Technical Outlook:
USDJPY has respected the channel boundaries since May. Unless price breaks and closes above 148.79 with strong volume and momentum, the more likely scenario is a pullback. Watch for a bearish engulfing or lower-timeframe double top confirmation to trigger entries.
Conclusion:
We’re seeing a potential top at a well-respected channel ceiling. Unless bulls break and hold above 148.79, USDJPY could be set for a healthy retracement. Keep an eye on U.S. dollar strength and BoJ policy chatter in the coming days.
Sign-off:
“In markets, clarity often lies just beyond the fear. Trade the levels, not the noise.”
💬 Drop your thoughts in the comments, give this idea a boost, and follow for more actionable setups. Stay sharp out there!
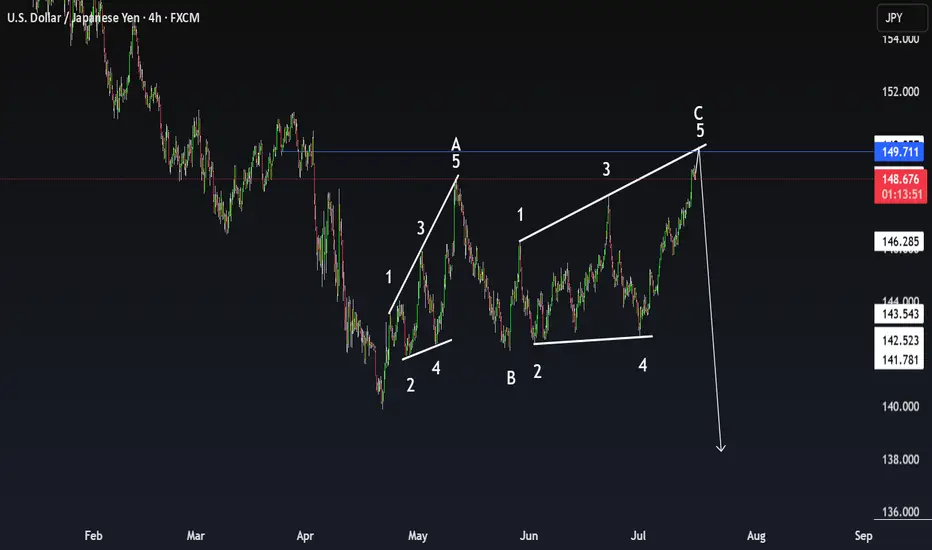
USDJPY Expanding Diagonal – Final Wave 5 at 149.71?FX:USDJPY FX_IDC:USDJPY
USD/JPY – 4H Chart – Elliott Wave Analysis
📅 July 16, 2025 | By: Trwin
🧠 Pattern Highlighted: Expanding Ending Diagonal (Wave C)
The current move from wave B to C appears to form a classic expanding ending diagonal, suggesting trend exhaustion near the key resistance zone of 149.71.
🔎 Key Features:
🔹 All 5 waves are structured as zigzags – a textbook ending diagonal.
🔹 Wave 3 > Wave 1, and Wave 5 > Wave 3 → confirms expanding structure
🔹 Wave 2 & 4 retraced deeper than typical impulses (common in diagonals)
🔹 Wedges are diverging, forming an expanding wedge.
🔹 Price is nearing a throw-over, hinting at final exhaustion.
💬 What do you think? Will USDJPY reverse hard from this expanding wedge or break higher into a blow-off top?
⚠️ Disclaimer:
This analysis is for educational purposes only and does not constitute financial advice. Trading carries risk, and past performance is not indicative of future results. Always do your own research and consult with a licensed financial advisor before making any trading decisions.
Yen Slips Near 2-Month LowThe yen traded around 147.6 per dollar on Tuesday, close to a two-month low, as market sentiment remained fragile amid lingering trade tensions. The U.S. plans to impose 25% tariffs on Japanese exports starting August 1, but Tokyo hasn’t signaled retaliation. Talks between the two sides have stalled, and Japanese officials warn of potential economic fallout if the measures take effect.
Resistance is at 147.75, with major support at 146.15.
Euro Steady, EU Prepares $84B RetaliationEUR/USD hovered near 1.1670 in Tuesday’s Asian session as markets awaited US-EU trade updates. Despite Trump’s 30% tariff announcement on EU imports, he confirmed that negotiations with Brussels are ongoing ahead of the August 1 deadline. According to Bloomberg, the EU is ready to respond with proportional tariffs targeting $84B (€72B) worth of US goods, including Boeing jets, bourbon, cars, and machinery.
Resistance for the pair is at 1.1715, while support is at 1.1645.

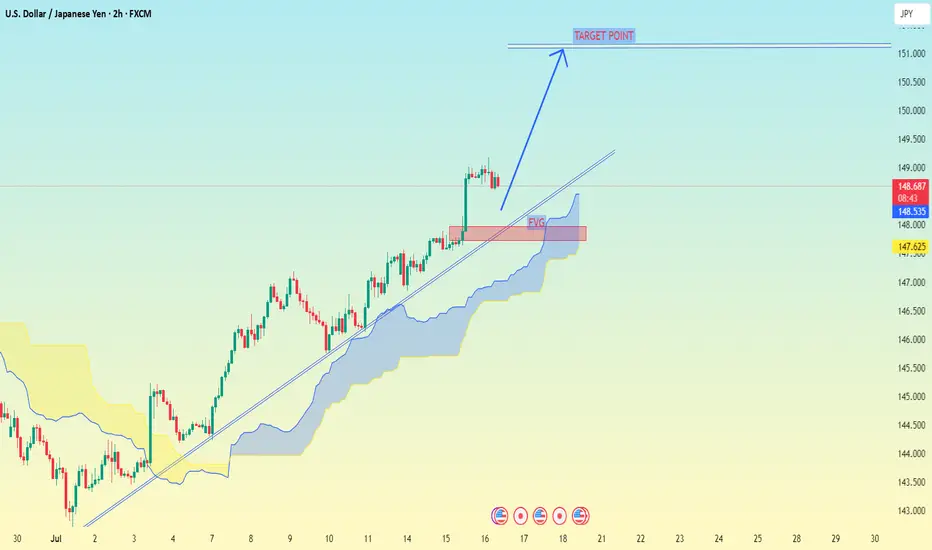
USD/JPY (2H time frame).USD/JPY (2H time frame), here is a breakdown:
📊 Technical Analysis Summary:
The chart shows an uptrend with price respecting a trendline.
Price is currently above the Ichimoku cloud, indicating bullish momentum.
A pullback zone (marked in red) is shown, likely suggesting a buying opportunity.
The chart indicates a projected move to the "Target Point" marked on the chart.
🎯 Target Level:
Target Point = 151.000
📌 Key Zones:
Support Zone / Pullback Entry: Around 147.80 to 148.20
Current Price: ~148.66
Resistance / Final Target: 151.000
✅ Trade Idea:
Buy on pullback near 148.00
Target: 151.000
Stop Loss: Below cloud or trendline, around 147.00
Market Analysis: USD/JPY RisesMarket Analysis: USD/JPY Rises
USD/JPY is rising and might gain pace above the 149.20 resistance.
Important Takeaways for USD/JPY Analysis Today
- USD/JPY climbed higher above the 147.50 and 148.40 levels.
- There is a key bullish trend line forming with support at 148.40 on the hourly chart at FXOpen.
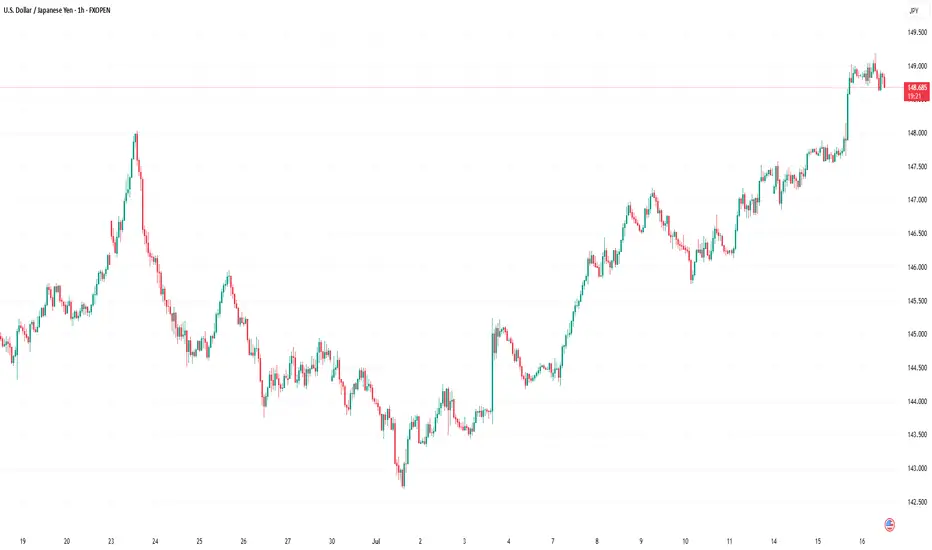
USD/JPY Technical Analysis
On the hourly chart of USD/JPY at FXOpen, the pair started a fresh upward move from the 145.75 zone. The US Dollar gained bullish momentum above 146.55 against the Japanese Yen.
It even cleared the 50-hour simple moving average and 148.00. The pair climbed above 149.00 and traded as high as 149.18. The pair is now consolidating gains above the 23.6% Fib retracement level of the upward move from the 145.74 swing low to the 149.18 high.
The current price action above the 148.50 level is positive. There is also a key bullish trend line forming with support at 148.40. Immediate resistance on the USD/JPY chart is near 149.20.
The first major resistance is near 149.50. If there is a close above the 149.50 level and the RSI moves above 70, the pair could rise toward 150.50. The next major resistance is near 152.00, above which the pair could test 155.00 in the coming days.
On the downside, the first major support is 148.40 and the trend line. The next major support is visible near the 147.90 level. If there is a close below 147.90, the pair could decline steadily.
In the stated case, the pair might drop toward the 147.50 support zone and the 50% Fib retracement level of the upward move from the 145.74 swing low to the 149.18 high. The next stop for the bears may perhaps be near the 146.55 region.
This article represents the opinion of the Companies operating under the FXOpen brand only. It is not to be construed as an offer, solicitation, or recommendation with respect to products and services provided by the Companies operating under the FXOpen brand, nor is it to be considered financial advice.
USD/JPY 4-Hour Chart Analysis4-hour chart displays the price movement of the U.S. Dollar against the Japanese Yen (USD/JPY) from June to August 2025. The chart shows a significant upward trend in July, followed by a correction. Key levels are highlighted, including support at 147.031 and resistance at 150.130, with the current price at 148.809. The chart suggests a potential bullish continuation, as indicated by the upward arrow and green box, targeting higher levels above 150.000.

USDJPY - Time to sell short term i believeHave a pending order waiting to be triggered on UJ
Will see how we go if we get tagged in

USDJPY H1 Support & Resistance Levels🚀 Here are some key zones I've identified on the 15m timeframe.
These zones are based on real-time data analysis performed by a custom software I personally developed.
The tool is designed to scan the market continuously and highlight potential areas of interest based on price action behavior and volume dynamics.
Your feedback is welcome!

Sweet sales✅ Closed below 148.700 = confirmation of bearish pressure.
📉 Structure shows that bulls are losing strength and sellers are stepping in.

usdjpy sell setupPrevious day high swept by day high looking to buy at discount areas near yesterday low so sell setup with stops at yesterday high which has already been swept .In lower tf as seen we are filling imbalance to continue higher while dxy also retrace previous resistance as support we would look to short to the area
USD/JPY:Bulls Eye Break Above 149.50, Yen Remains Under Pressure
The Japanese Yen slipped to its lowest level since April during the Asian session on Wednesday, weighed down by fading expectations of a near term rate hike from the Bank of Japan (BoJ). The market reaction reflects growing concerns over the potential economic fallout from recently imposed higher US tariffs, which has dampened hawkish bets on the BoJ and contributed to the Yen's underperformance in July.
On the flip side, the US Dollar remains well-supported, with the USD Index (DXY) surging to its highest level since June 23 following Tuesday's hotter-than-expected US CPI data. The inflation print reinforced the view that the Federal Reserve may delay rate cuts, thereby underpinning demand for the Greenback.
Technical Outlook
From a technical standpoint, USD/JPY’s breakout above the June high at 148.50 and a subsequent move beyond the May swing high around 148.65 has triggered fresh bullish momentum. This bullish bias remains intact as long as the pair holds above the 148.50 support zone.
Immediate Support: 148.50, followed by 148.00
Key Demand Zone: 147.55 horizontal level that could act as a pivot. Break below here might open the door to a deeper pullback toward the 146.30 and 146.25 area.
Immediate Resistance: 149.00, followed by 149.35 and 149.40 zone.
Key Hurdle: 150.00 is a psychologically significant level where bulls may encounter strong resistance. A sustained move and daily close above 149.50 could act as a catalyst for further gains, possibly setting the stage for a test of 150.00 in the near term.
The forecasts provided herein are intended for informational purposes only and should not be construed as guarantees of future performance. This is an example only to enhance a consumer's understanding of the strategy being described above and is not to be taken as Blueberry Markets providing personal advice.

USD/JPY 4-Hour Forex Chart4-hour performance of the U.S. Dollar (USD) against the Japanese Yen (JPY) from late June to mid-July 2025, sourced from FOREX.com. The current exchange rate is 147.436, with a 1.178 (+0.81%) increase. Key levels include a sell price of 147.393 and a buy price of 147.479. The chart shows a recent upward trend with a resistance zone highlighted between 147.436 and 148.092, and support around 146.598. Candlestick patterns indicate volatility, with notable price movements around early July.

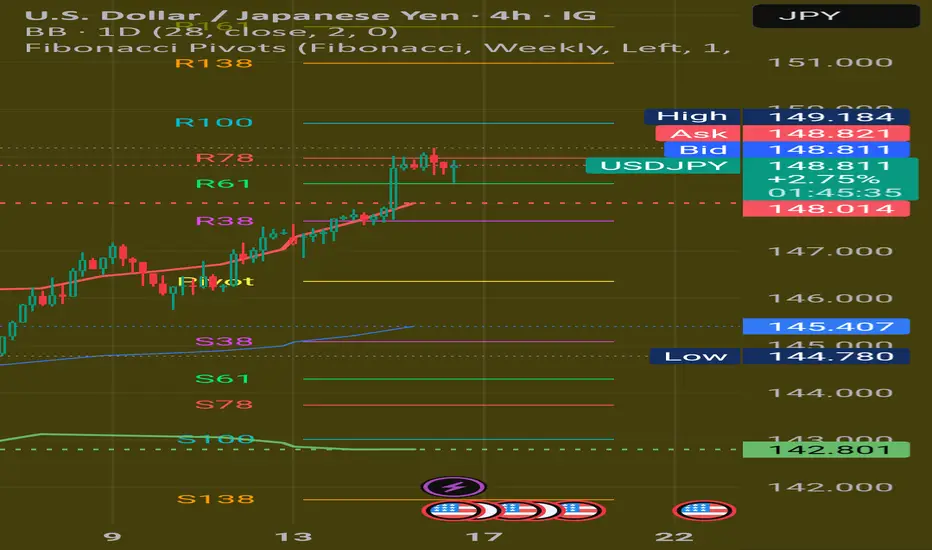
Fundamental Market Analysis for July 16, 2025 USDJPYEvent to Watch Today:
15:30 EET. USD – Producer Price Index
USDJPY:
USD/JPY has stabilized around 148.900, maintaining upside potential due to:
Interest Rates: The Fed keeps yields elevated (10-year bonds at 4.46%), while the Bank of Japan maintains an ultra-loose policy, keeping real yields negative.
Political Uncertainty: Upcoming elections in Japan and possible fiscal tightening reduce the yen’s appeal.
Dollar Demand: Trade frictions and geopolitical risks drive safe-haven flows into the dollar.
A break above 149.000 could open the path to 149.500. Support at 148.600 remains a critical barrier for the bullish scenario.
Trade Recommendation: BUY 149.000, SL 148.700, TP 149.900

USDJPY (Daily Analysis) 16/07please see my daily review of usdjpy. hope all the information has been outlined. please note this is not financial advice. happy trading
