USDJPY M15 I Bullish Bounce Based on the M15 chart analysis, the price is falling toward our buy entry level at 142.69, a pullback support that aligns with the 61.8% Fibonacci retracement.
Our take profit is set at 143.31, a pullback resistance.
The stop loss is placed at 142.53, a pullback support.
High Risk Investment Warning
Trading Forex/CFDs on margin carries a high level of risk and may not be suitable for all investors. Leverage can work against you.
Stratos Markets Limited (tradu.com ):
CFDs are complex instruments and come with a high risk of losing money rapidly due to leverage. 63% of retail investor accounts lose money when trading CFDs with this provider. You should consider whether you understand how CFDs work and whether you can afford to take the high risk of losing your money.
Stratos Europe Ltd (tradu.com ):
CFDs are complex instruments and come with a high risk of losing money rapidly due to leverage. 63% of retail investor accounts lose money when trading CFDs with this provider. You should consider whether you understand how CFDs work and whether you can afford to take the high risk of losing your money.
Stratos Global LLC (tradu.com ):
Losses can exceed deposits.
Please be advised that the information presented on TradingView is provided to Tradu (‘Company’, ‘we’) by a third-party provider (‘TFA Global Pte Ltd’). Please be reminded that you are solely responsible for the trading decisions on your account. There is a very high degree of risk involved in trading. Any information and/or content is intended entirely for research, educational and informational purposes only and does not constitute investment or consultation advice or investment strategy. The information is not tailored to the investment needs of any specific person and therefore does not involve a consideration of any of the investment objectives, financial situation or needs of any viewer that may receive it. Kindly also note that past performance is not a reliable indicator of future results. Actual results may differ materially from those anticipated in forward-looking or past performance statements. We assume no liability as to the accuracy or completeness of any of the information and/or content provided herein and the Company cannot be held responsible for any omission, mistake nor for any loss or damage including without limitation to any loss of profit which may arise from reliance on any information supplied by TFA Global Pte Ltd.
The speaker(s) is neither an employee, agent nor representative of Tradu and is therefore acting independently. The opinions given are their own, constitute general market commentary, and do not constitute the opinion or advice of Tradu or any form of personal or investment advice. Tradu neither endorses nor guarantees offerings of third-party speakers, nor is Tradu responsible for the content, veracity or opinions of third-party speakers, presenters or participants.
USDJPY trade ideas

Bullish bounce off pullback support?USD/JPY has bounced off the support level which is a pullback support that lines up with the 61.8% Fibonacci projection and could rise from this level to our take profit.
Entry: 142.27
Why we like it:
There is a pullback support level that lines up with the 61.8% Fibonacci projection.
Stop loss: 141.62
Why we like it:
There is a pullback support level.
Take profit: 144.05
Why we like it:
There is a pullback resistance that lines up with the 38.25 fibonacci retracement.
Enjoying your TradingView experience? Review us!
Please be advised that the information presented on TradingView is provided to Vantage (‘Vantage Global Limited’, ‘we’) by a third-party provider (‘Everest Fortune Group’). Please be reminded that you are solely responsible for the trading decisions on your account. There is a very high degree of risk involved in trading. Any information and/or content is intended entirely for research, educational and informational purposes only and does not constitute investment or consultation advice or investment strategy. The information is not tailored to the investment needs of any specific person and therefore does not involve a consideration of any of the investment objectives, financial situation or needs of any viewer that may receive it. Kindly also note that past performance is not a reliable indicator of future results. Actual results may differ materially from those anticipated in forward-looking or past performance statements. We assume no liability as to the accuracy or completeness of any of the information and/or content provided herein and the Company cannot be held responsible for any omission, mistake nor for any loss or damage including without limitation to any loss of profit which may arise from reliance on any information supplied by Everest Fortune Group.

Risk, Rates, and Reversals: What’s Next for USD/JPY?CMCMARKETS:USDJPY FX:USDJPY USD/JPY rebounded slightly to 143.10 but remains under pressure after slipping from the 144.50 on BoJ-Fed divergence and rising geopolitical tensions. While the BoJ appears cautious about accelerating its balance sheet tapering beyond FY2026, it still signals further rate hikes amid persistent domestic inflation, offering the yen structural support.
Technically, price is reacting off the lower trendline TL2, aligned with the 142.30–142.40 significant support zone. This area has held multiple times in the past and may offer a bullish pullback toward the 143.80 or even 146.15 resistance zones. However, failure to break above these levels could expose USD/JPY to renewed downside toward the 140.89 demand base.
Short-term recovery depends on Friday’s NFP and risk sentiment around trade tensions. A break below 142.30 would invalidate the bullish rebound and open downside to support near 140.89.
Resistance : 143.87 , 146.14
Support : 142.36 , 140.89

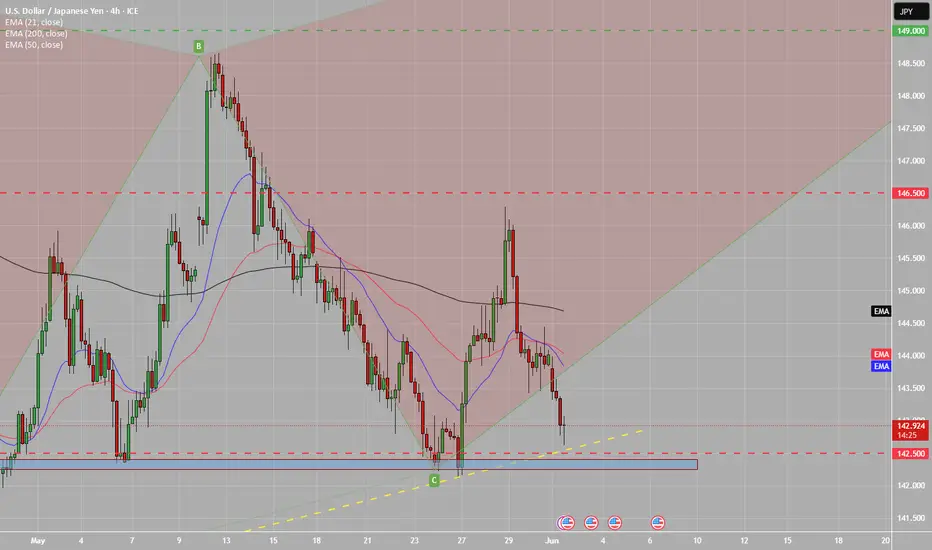
Short I opened a short position yesterday at the price of 147.50.
Currently the price is 146.18. The price has dropped quite a bit but I think it still has a good short entry opportunity with a reasonable risk reward.
Reasons for short trade:
The price has reached the major support level around 149 on the 22nd April. Since then, the price has moved up to the fair value gap area between 149.2 and 148.2 (blue rectangular box), and also the order block.
That area is also the Fib 0786 area. I look at Fib 0.786 as the last line of defence and it is usually a hard line to break.
The price hit the area and started to move to the downside. Momentum indicators are still in the bull territory but the lines have crossed and clearly moving to the downside.
My macro bias for USD is bearish and the current price set up support my bias. The risk reward is good enough for me to enter.
My trade set up:
Entry: 147.51Stop: 148.95Target: 142.478 (Fib 0.236)
Risk:Reward= 1:3.5
Currently the price is 146.17. It just broked below Fib 0.618. Entry now can give you 1:1.5 risk reward.

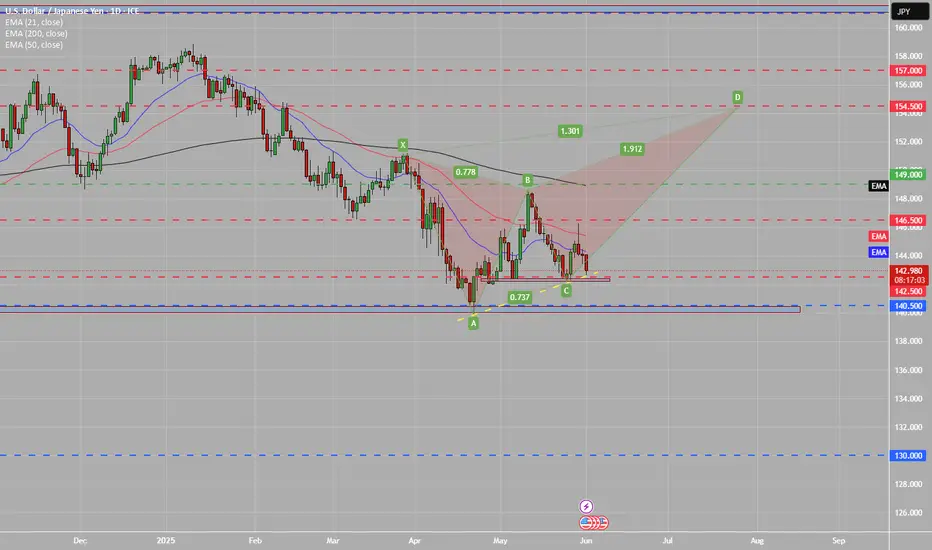
USDJPY | ABCD Harmonics | Bullish ReversalUSDJPY has displayed bullish divergence at the bottom and now may initiate a bullish trend.


Buy opportunity UJPure price action strategy
Listing to the chart and take action accordingly
Let's do it

YEN/$USA topped in the target 144/146 and now supported into fibThe chart posted is the USA $/YEN chart it is key to all things as to the sp 500 and debt markets A few weeks back I posted The chart of a MASSIVE HEAD N SHOULDER TOP formation !!! we are still forming the Right shoulder in a rather complex wave STRUCTURE This is the hourly model and forecast so far spot on . best of trades WAVETIMER

USDJPY I Trading Plan and Forecast Welcome back! Let me know your thoughts in the comments!
** USDJPY Analysis - Listen to video!
We recommend that you keep this pair on your watchlist and enter when the entry criteria of your strategy is met.
Please support this idea with a LIKE and COMMENT if you find it useful and Click "Follow" on our profile if you'd like these trade ideas delivered straight to your email in the future.
Thanks for your continued support!Welcome back! Let me know your thoughts in the comments!

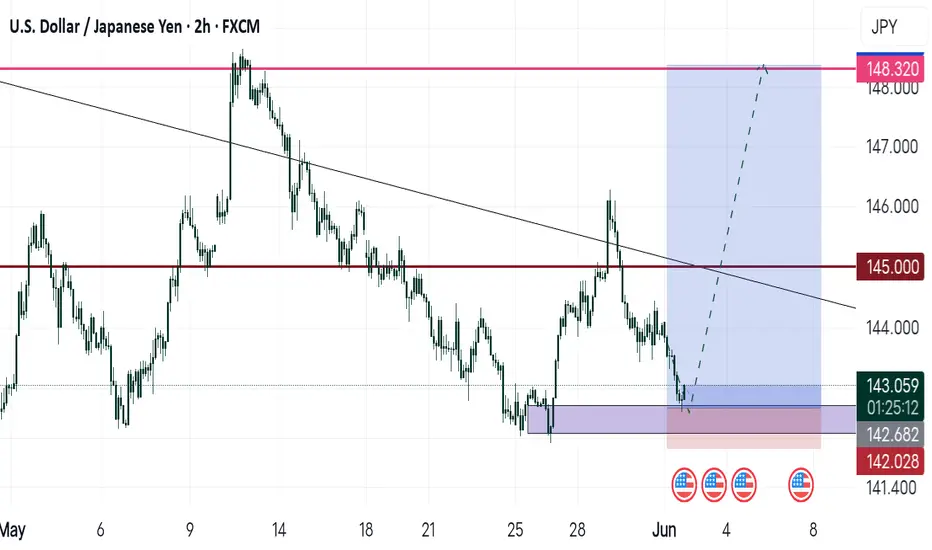
A rebound is inevitable. Execute!During the European session, the USD/JPY price trended lower overall, with prices gradually declining from higher levels, indicating that bearish forces remained dominant. The pair started its downward movement from near 144.049 and continued to move lower. Notably, the USD/JPY exchange rate faced resistance at the 146.00 psychological level and is currently moving toward the support zone at 142.35. If prices reach this area, buyers are expected to enter the market after setting clear risk parameters below the support level, preparing for a potential rebound toward the 148.00 resistance level. On the flip side, sellers will look for prices to break below this level to increase bearish bets, with a further downside target set at the 140.00 threshold.
Humans need to breathe, and perfect trading is like breathing—maintaining flexibility without needing to trade every market swing. The secret to profitable trading lies in implementing simple rules: repeating simple tasks consistently and enforcing them strictly over the long term.
Trading Strategy:
buy@142.20-142.50
TP:145.50-146.00


UJ Harmonic C-D legCloser look into the price action. Bulls in favor as long as support stands strong, as mentioned on previous post. 4H bullish trendline along side a Daily support. If price break below will favor Bears. However overall trend on Higher timeframes is bulls market.
UJ BULLISH PIVOT C-D LEG Price seems to be testing Daily support. Will be favoring bulls over bears. Additionally will post 4h chart to monitor price action. As long as support stands strong bulls will be favored.
USDJPY LONG USDJPY tested my demand on h4 at 142.750 quarter level and i see it going all the way to at least 146 flat DYOR
UJ will continue its declinein trend UJ is in decline seen swing high adds to the potential to continue the decline
SL: 143.7 (25 pips)

USD/JPY Technical OutlookA Head and Shoulders pattern has formed on the 4-hour timeframe, suggesting a potential bearish reversal. The key neckline zone lies between 142.400 and 142.000 .
A confirmed break below this neckline, followed by a clean retest, would present a high-probability short opportunity. This pattern indicates a possible shift in momentum, with sellers beginning to gain control of the market.

Usdjpy I was expecting a break out from that zone and we have gotten the break out am expecting market to retrace back to the zone we're it broke out from then I sell
Buy
### Important and main block order ### can cause a return and reaction to the level. ### In the low time frame, wait for the first ceiling to break and trade when

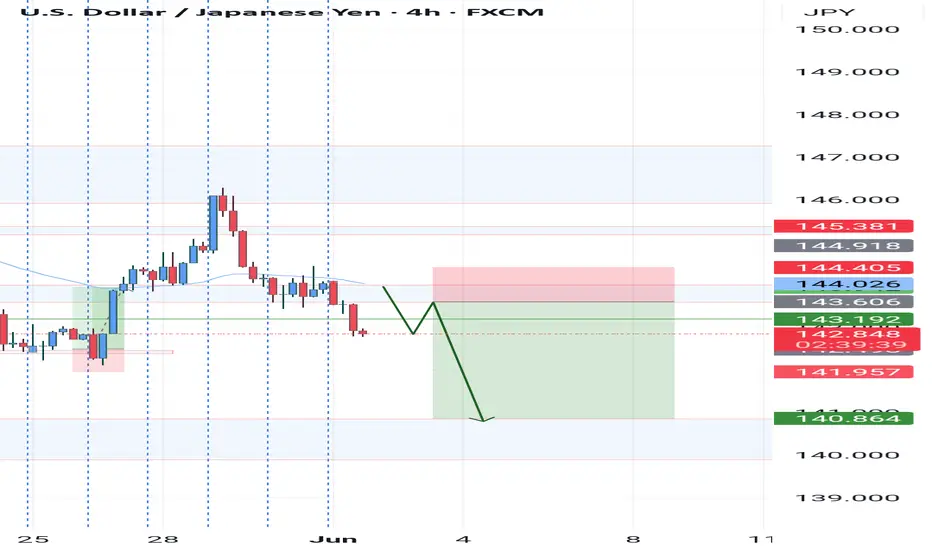
Monday thoughts and reports Our initial trade of the week was a success no drawback. The currency pair has created a new level and is now in a testing zone that I view as either a possible reversal or continuation of a downtrend validated by the 4 hour and daily timeframes. My points of interaction.
Sell: Open and close below 142.579
Buy: Reversal at 142.579
Even though these are the points I'm interested keep in mind it is early in the week and there is a chance for consolidation so beware of overtrading.
Monday June 2nd Reports: ISM Manufacturing PMI (Purchasing Managers' Index)
For May of 2025 it reported at about 48.7% which indicates a continued contraction in the manufacturing sector. Aprils was 49% So we are looking at a slower pace. The current prediction is 49.5%. This is the ninth consecutive month with the index below 50% which is below the neutral threshold of 50%.
New Orders decreased to 48.6% from 55.1%
Production: Slowed to 50.7% from 52.5%
Employment: Fell into contraction at 47.6% down from 50.3%
Prices: Accelerated to 62.4% the highest since June 2022, due to increased cost from tariffs
Supplier Deliveries: Slowed to 54.5% from 50.9%, indicating longer lead times
Inventories: Remained stable at 49.9%
Backlog of Orders: Contracted less at 46.8% compared to 44.9% (backlogs are still declining, but not as sharply)
The manufacturing sector is experiencing the initial operational impacts of the new administrations tariff policies, leading to increased prices and supply chain disruptions
How does this impact USD/JPY?
PMI below 50 signals economic weakness it signals contraction in the manufacturing sector.
This puts a cloud over the confidence in US economic strength and may lead traders to lower expectations for future fed rate hikes (or even expect cuts)
A lower PMI reduces investor confidence in US economy which cloud lead to a weaker dollar
This will result in a stronger yen (safe haven currency) against the us dollar
Pay attention to: Fed and BOJ monetary policy outlooks, geopolitical risk appetite, interest rate differentials, and upcoming US jobs data report

USD/JPY – Rejection at Resistance | Bullish Setup Brewing? The USD/JPY pair has just rejected from the 143.50 zone and is currently sitting around 142.89, showing signs of short-term weakness after a bullish attempt. However, the higher timeframe demand zone between 140.55 – 142.00 is holding strong 👀
🔍 Key Levels:
Demand Zone: 140.550 – 142.000 🟧
Mid-Range Resistance: 148.419 🔵
Major Supply Zone: 155.589 🔵
Current Price: 142.896 🔴
📊 Technical Breakdown:
Price bounced multiple times from the strong demand zone, forming a potential triple bottom.
If bulls defend this area again, we could see a push toward 148.41 and eventually a retest of the 155.58 supply zone 🔼
Momentum is gradually shifting – watch for a break above recent highs (~143.50) for confirmation of bullish continuation.
🧠 What to Watch:
Bullish confirmation above 143.50 = Long potential toward 148.41 and 155.58 🎯
Bearish breakdown below 140.55 = Caution! Opens downside risk 🚨
💬 Your Turn:
How are you trading USD/JPY this week?
Do you expect a breakout or another bounce from this demand zone?
📌 Drop your analysis or setups below! Let's trade smarter together.
#USDJPY #Forex #PriceAction #SupplyAndDemand #SmartMoney #FXTrading #TechnicalAnalysis #LuxAlgo #4HChart #TradingView #JPY

Market next move 🔄 Disruptive Bullish Scenario Analysis
1. Oversold Conditions & Possible Reversal
The current price at 143.028 shows an aggressive drop.
This could indicate the pair is entering oversold territory on lower timeframes (not visible here but common post-drop).
If confirmed with RSI or stochastic indicators, a reversal or retracement could be imminent before reaching the 141.000 target.
2. Demand Zone at 142.500–142.000
Historically, this area (near 142.5–142.0) may act as a support zone.
Buyers could step in here, especially if fundamentals (e.g., U.S. data releases or BOJ comments) support dollar strength.
3. Volume Divergence
Declining selling volume despite price falling (visible from lower red bars) may hint at weakening bearish momentum.
This divergence often precedes a bullish correction or range formation.
4. False Breakdown Possibility
The sharp projection to 141.000 could trigger stop hunts.
After trapping breakout sellers, price may sharply rebound to retest 143.500–144.000 zones.

USDJPY Forecast for NFP Week | Price at a Critical Turning PointIn this video, I’m diving into the USDJPY setup ahead of a high-impact week filled with major economic news like the NFP, ADP Employment, and speeches from the BoJ Governor.
We’ll walk through the technical zones I’m watching, discuss potential buyer and seller reactions, and outline the key catalysts that could move the market.
🔔 Don’t forget to like the video in support of my work.
Disclaimer:
Based on experience and what I see on the charts, this is my take. It’s not financial advice—always do your research and consult a licensed advisor before trading.
#USDJPY #ForexForecast #NFPWeek #ForexMentor #TechnicalAnalysis #ForexTrading #BoJ #TradeSetups #PriceAction #MarketBreakdown

USDJPY Short: On the Wave 3 Train RideOver in this video, I go through in detail the breakdown of the Elliott Waves and the rationale for counting the waves as I did. In this video, i talk about setting the stop at around 144.10 and the short-term take profit target at around 139.92.
At the end, I remind us of the big picture head-and-shoulders where the longer-term target is around 127.21.
Thank you and Good Luck in your Trading!
