waiting for the reversal on higher timeframesin higher time frames USDJPY at a strong support and hope we can catch the reversal,
entry - 146.393
SL - 146.223
TP - 147.096
USDJPY trade ideas

USDJPY – Potentially More Volatility AheadUSDJPY experienced a significant move higher at the end of April/beginning of May, as first, the Bank of Japan (BoJ) started to indicate caution towards further interest rate hikes due to the uncertainty caused by the introduction of President Trump’s trade tariffs, a potential negative for the JPY. This was followed by dollar demand linked to Monday’s announcement by US and China trade representatives of a significant de-escalation of tariffs on imports from each country for a 90 day period.
This upside squeeze saw USDJPY trade from a low of 139.89 on April 22nd to a high of 148.65 on Monday May 12th, as FX traders were forced to pare back weak short positions as short term upside resistance levels were broken.
Since then, however, the rally has come to an abrupt halt with USDJPY falling to a low of 145.60 on Wednesday, with a potential catalyst for this drop being a news report outlining currency policy discussions between US and South Korean governments at the start of May which may have led to increased speculation that President Trump’s administration may be open to a weaker dollar.
Looking forward, this pick up in USDJPY volatility may not be finished as traders now have to digest 2 scheduled events today and one overnight that may impact where this popular currency finishes the week.
The first 2 events, includes the earnings and forward guidance from the US retail colossus Walmart (due today before the open) and US Retail Sales data (1330 BST today), which will provide FX traders with an important update on the current appetite of US consumers to spend through the recent trade war upheaval.
Then, overnight the Japanese Preliminary Q1 GDP growth update is due at 0050 BST (Friday). This release could either support the current BoJ caution over further rate hikes, or lead to a potential resurgence of market rate hike expectations, if it comes in stronger than anticipated, with knock on implications for USDJPY volatility into the weekend.
Technical Update: Being Prepared For Further Volatility
It has certainly been an impressive rally in USDJPY, with traders perhaps focusing on the recent close above 145.92 as a potential positive. This level was equal to the May 2nd session high, which might be viewed by some, as opening further attempts to extend recent price strength.
However, within financial markets, psychological round numbers in price can influence trader sentiment, meaning as impressive as latest upside may appear, it might still have to close above 150.00, equal to the round price number evident just above recent activity.
What if the 150.00 resistance holds and fresh weakness emerges?
This week’s activity has so far, seen a price high established at 148.65, posted on Monday, which coupled with the 150.00 psychological resistance, may be an area traders could be focusing on as next possible resistance. They may feel, this 148.65/150.00 range could continue to hold price strength, even attract selling pressure.
A pattern for USDJPY activity in 2025, has been attempts at price strength failing under the previous recovery price highs, as indicated by the pattern of lower highs since the January 10th upside extreme, highlighted on the chart below.
It is far too early to say if this is the case again, but the 38.2% Fibonacci retracement of April to May price strength, which stands at 145.31, might prove an important support.
If this 145.31 level were to give way on a closing basis, it could point to a possible phase of more extended declines, and potential weakness towards 144.28, the deeper 50% level, even 143.24, the 61.8% retracement.
What if 145.31 Support Holds?
If the 145.31 support holds current price weakness, it could be argued, the 148.65/150.00 range is a resistance area we should perhaps watch on a closing basis, if it is challenged over coming sessions.
While not a guarantee of a more sustained phase of price strength, if closes above 148.65/150.00 were to materialise, traders might then look for potential to test higher resistance levels.
Focus could for instance then turn towards tests of the next price failure high, which is represented by 151.21, posted on March 28th 2025, possibly further if this in turn gives way.
The material provided here has not been prepared in accordance with legal requirements designed to promote the independence of investment research and as such is considered to be a marketing communication. Whilst it is not subject to any prohibition on dealing ahead of the dissemination of investment research, we will not seek to take any advantage before providing it to our clients.
Pepperstone doesn’t represent that the material provided here is accurate, current or complete, and therefore shouldn’t be relied upon as such. The information, whether from a third party or not, isn’t to be considered as a recommendation; or an offer to buy or sell; or the solicitation of an offer to buy or sell any security, financial product or instrument; or to participate in any particular trading strategy. It does not take into account readers’ financial situation or investment objectives. We advise any readers of this content to seek their own advice. Without the approval of Pepperstone, reproduction or redistribution of this information isn’t permitted.

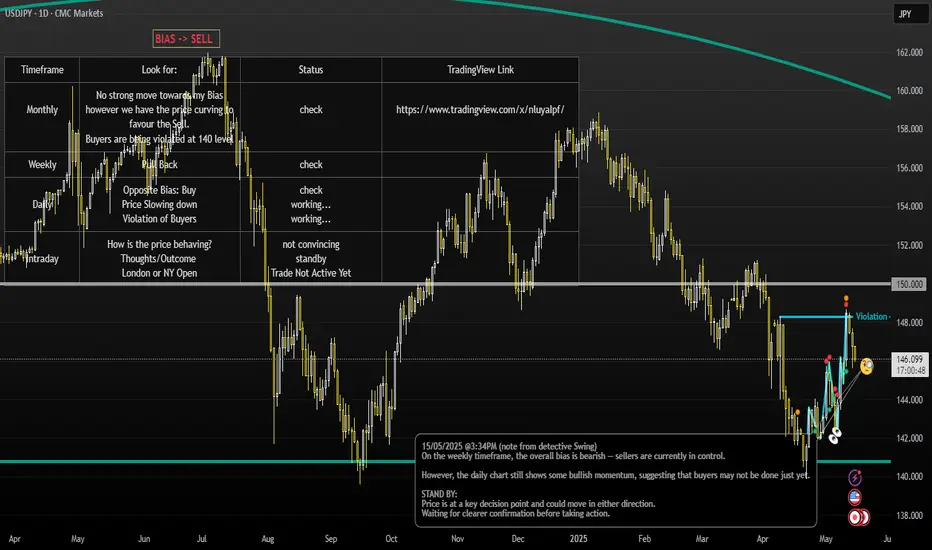
USDJPY - Potential Sell (Swing Trading), Short Term Buy tooHi Traders,
📊 Price Action Analysis:
Price on the weekly chart has been bouncing off the 140.0 level multiple times, forming lower highs — a classic sign of seller strength.
We’re closely monitoring the daily chart to see when buyers lose momentum and the sell trend resumes.
⚠️ While there’s still potential for short-term buys on the daily, caution is advised — the overall structure leans bearish.
Good luck and trade smart!
USDJPY Bullish Reversal Forming Off 4HR Order Block USDJPY is currently showing signs of a **bullish reversal** after reacting to a key 4-hour Order Block. The second leg of a W-pattern has just formed and was accompanied by a clean tweezer bottom on the 1-hour timeframe, signaling potential smart money accumulation.
Yesterday (Wednesday), the first leg developed without any macro news influence, and we saw an internal, irregular W structure with a weak tweezer — possibly engineered to trap early longs and sweep liquidity.
Today, Thursday, the second leg printed with much better symmetry and stronger price action. A textbook tweezer bottom formed on the 1H, supported by clear rejection from the OB and a liquidity sweep — setting up an ideal reversal zone.
Confluences:
✅ Price tap into 4H Order Block
✅ Completed W-pattern with strong second leg
✅ Clean 1H tweezer bottom
✅ Liquidity sweep of previous lows
✅ Upcoming USD CPI News @ 1:30 PM — likely catalyst
Expectations:
Position entered long after tweezer confirmation. A short-term retrace into an unmitigated 15m OB or FVG may occur as part of news-driven volatility, but overall bias remains bullish for continuation unless structure fails.
Invalidation:
Clean 1H/4H candle close below the OB and W-pattern second leg low will invalidate this setup and shift bias back to neutral or bearish.
⚠️ Risk Note:
This analysis is for educational purposes and does not constitute financial advice. Always assess your personal risk tolerance and use proper risk management.
For intraday traders, ensure stop loss is placed beyond the OB or liquidity sweep, and risk no more than 1–2% of your capital per position. News-driven setups carry additional volatility — trade cautiously and never chase price.

USD/JPY LONGPull back again to donchian channel. Red arrows show previous pull backs to continue its bullish momentum and pivot.

USD/JPY : More Bullish Move Ahead ? (READ THE CAPTION)By analyzing the USD/JPY chart on the daily timeframe, we can see that the price moved exactly as expected — first correcting down to the 142.5 area, and then rallying strongly to hit the 146.2 target. Currently, this pair is trading around 145.2, and if the price can hold above 145, we can still expect further upside movement on USDJPY. The next potential targets are 148.7 and 150 respectively. This analysis will be updated. The total return of this analysis so far has been over 720 pips!
Please support me with your likes and comments to motivate me to share more analysis with you and share your opinion about the possible trend of this chart with me !
Best Regards , Arman Shaban

USDJPY INTRADAY downtrend continuation below 147.00USD/JPY remains in a bearish trend, as the longer-term downtrend continues to dominate market sentiment.
The key level to watch is 147.00, which marks the recent swing high and a strong resistance area. If the pair rises toward this level and gets rejected, it could resume its downward move toward support at 144.60, with further downside targets at 143.00 and 142.35 over time.
However, if the price breaks above 147.00 and posts a daily close above it, this would challenge the bearish outlook. In that case, the pair may continue higher, aiming for 147.60 and then possibly 148.50.
Conclusion:
The trend for USD/JPY is still bearish. A rejection at 147.00 could lead to more downside. But if the pair breaks and closes above 147.00, it may shift to a bullish move in the short term. Traders should watch how the price reacts around the 147.00 level for clues on the next direction.
This communication is for informational purposes only and should not be viewed as any form of recommendation as to a particular course of action or as investment advice. It is not intended as an offer or solicitation for the purchase or sale of any financial instrument or as an official confirmation of any transaction. Opinions, estimates and assumptions expressed herein are made as of the date of this communication and are subject to change without notice. This communication has been prepared based upon information, including market prices, data and other information, believed to be reliable; however, Trade Nation does not warrant its completeness or accuracy. All market prices and market data contained in or attached to this communication are indicative and subject to change without notice.

CHECK USDJPY SIGNAL READ CAPTAINusdjpy signal technical analysis satup 👇🏼
(usdjpy) buy zone
( TRADE SATUP)
ENTRY POINT (145.900) to (145.800) 📊
FIRST TP (146.250)📊
2ND TARGET (146.800) 📊
LAST TARGET (147.300) 📊
STOP LOOS (145.300)❌
FALLOW RISK MANAGMENT

USDJPY to continue uptrendUSDJPY is forming has broken out of the downward channel and formed a new upward channel/trend. Expect a break of the trendline around 145.850 and continue upward from area
of support to resistance zone/are of interest at 150.734. This resistance area extends all the way back to 10/2023 and appears quite strong. The 1h chart is also showing a potential crossover of the RSI/RSI EMA. The ADX is falling, the DMI is divergent. The MACD is divergent and downward momentum is slowing.
15/5/2025 0226 PDT

Japan Pushes Back on Auto TariffsThe Japanese Yen strengthened to around 146 per dollar, marking its third straight gain as global trade concerns weighed on the U.S. Dollar. Asian currencies broadly rose with speculation that the U.S. may be favoring a weaker Dollar to aid trade talks. Trump’s administration argues that undervalued Asian currencies create unfair competition for American exporters.
Meanwhile, Japan continues U.S. trade negotiations, with PM Shigeru Ishiba pushing for a deal that includes the auto sector and the removal of the 25% car tariff.
USD/JPY faces resistance at 148.60, with further levels at 149.80 and 151.20. Major support is seen at 139.70, then 137.00, and 135.00.

USDJPY and GBPJPY Further drop?Hello traders, this is a complete multiple timeframe analysis of this pair. We see could find significant trading opportunities as per analysis upon price action confirmation we may take this trade. Smash the like button if you find value in this analysis and drop a comment if you have any questions or let me know which pair to cover in my next analysis.

Uptrend targetsUSD/JPY filled the May 10–11 gap and is now showing signs of a bullish bounce from the 145.36 zone. Buyers are testing higher, but 146.50 remains key resistance. A break above could open room toward 147.50, while failure may trigger another drop. Price is currently neutral-bullish; wait for confirmation before entering.

Bullish Engulfing Pattern: A Strong Reversal SignalBullish Engulfing Pattern: A Strong Reversal Signal
The bullish engulfing pattern is a two-candlestick formation that suggests a possible reversal from a downtrend to an uptrend in the financial market. This particular pattern holds immense value for traders and technical analysts as it equips them with the means to discern potential buying opportunities. In this article, we will explain how traders implement this pattern in their trading strategies.
What Is a Bullish Engulfing Pattern?
The bullish engulfing is a technical analysis pattern consisting of two candles. This formation emerges when a large bearish candlestick is succeeded by a larger green one that entirely engulfs it.
What does the bullish engulfing mean? The bullish engulfing indicates a potential shift in market sentiment, suggesting that buying pressure might surpass selling pressure in the near future and highlighting a possible reversal from a downtrend to an uptrend.
Traders can find the bullish engulfing candlestick pattern across various financial instruments, including currencies, stocks, cryptocurrencies*, ETFs, and indices.
Bearish Engulfing vs Bullish Engulfing
The bullish engulfing pattern has a counterparty - bearish engulfing. The bearish engulfing pattern occurs during an uptrend, indicating a change in market sentiment and potential price reversal to the downside. It consists of two candles, where the second is larger and bearish and completely engulfs the body of the preceding candlestick.
How Can You Trade the Bullish Engulfing Pattern?
Here are some steps traders consider when trading with the bullish engulfing:
- Identification: Look for a clear bullish engulfing setup on a price chart at the end of a downtrend.
- Entry Point: Although candlestick patterns don't provide precise entry and exit points as chart patterns do, there are general rules you could use.
The entry point could be set slightly above the high of the bullish engulfing formation. In the conservative approach, traders enter the market after several candles close higher. In a risky approach, traders open a buy position after the pattern is formed.
- Exit Point: A stop-loss level could be below the low of the engulfing candle or below a nearby support level. A take-profit level could be based on a trader’s risk/reward ratio or key resistance levels.
- Risk Management: You can consider a risk management strategy to potentially limit losses. Traders focus on appropriate position sizing and risk-to-reward ratios to maintain a balanced approach to trading.
- Trade Monitoring: Once you have entered the trade, monitor price action and market conditions. Pay attention to any sign of reversal confirmation or potential obstacles that may invalidate the signal.
- Stop-Loss and Take-Profit Adjustment: As the trade progresses, you may consider adjusting your stop-loss level to protect potential returns. Similarly, you may consider adjusting your take-profit level if the price signals a strong uptrend.
Live Market Example
Let's consider an example of a bullish engulfing on the forex chart. The bullish engulfing candle in the example below is marked with 1 and 2. The trader sets the entry point above the green candle and a stop-loss level below it. The take profit is at the closest resistance level.
How Do Traders Confirm a Bullish Engulfing Candlestick Pattern?
Confirming this pattern enhances the reliability of its signals and helps traders make informed decisions. Here are key steps to confirm it:
- Volume Analysis: Traders typically look for increased buying trading volume accompanying the candle. Higher volume suggests stronger buyers’ interest and validates the reversal signal.
- Follow-Up Candlesticks: Waiting for subsequent closes can confirm the upward momentum. A series of higher closes strengthens its credibility.
- Support Levels: If it forms near a significant support level, this adds context to the reversal, as buyers are stepping in at a critical price point.
- Technical Indicators: Complementary indicators like the Relative Strength Index (RSI), Stochastic Oscillator, or a pair of moving averages can confirm the shift in sentiment.
- Market Context: Traders assess the overall market trend and news to ensure the formation aligns with broader market conditions.
Bullish Engulfing and Other Patterns
Let’s take a closer look at how this pattern compares to other chart formations, like the piercing and harami.
What Is the Difference Between a Bullish Engulfing and a Piercing Pattern?
A bullish engulfing pattern occurs when a large bearish bar is followed by a larger candlestick that completely overtakes the former's body. This indicates a strong potential reversal from a downtrend to an uptrend.
In contrast, a piercing formation also signals a potential reversal but is slightly weaker. It forms when a bearish candle is followed by a bullish candle that closes above its midpoint but doesn’t envelop it entirely.
What Is the Difference Between a Bullish Engulfing Pattern and a Bullish Harami Pattern?
The bullish harami pattern consists of a large red candle followed by a smaller green candle that is completely contained within the body of the red candle. This formation suggests a potential reversal but is generally considered less strong than the bullish engulfing candle pattern, as the latter completely envelops the previous bearish bar, showing more decisive buying pressure.
Final Thoughts
While this pattern offers valuable insights into potential trend reversals, it's essential to complement it with technical indicators and robust risk management for effective use. Also, be sure to explore other patterns as they may look very similar but provide different signals.
FAQ
What Is a Bullish Engulfing Pattern?
A bullish engulfing pattern is a two-candlestick formation in technical analysis that suggests a potential reversal from a downtrend to an uptrend. It occurs when a large bearish candlestick is followed by a larger bullish candlestick that completely engulfs the body of the preceding bearish candle.
How Reliable Is the Bullish Engulfing Pattern?
The reliability of the bullish engulfing pattern as a reversal signal depends on various factors, including the overall market context, confirmation from other technical indicators, and the timeframe being analysed. While it can be a strong indication of a potential trend reversal, it is not foolproof and should be used in conjunction with other tools and fundamental analysis.
What Is a Bullish Engulfing Candle Trading Strategy?
The bullish engulfing candle strategy involves identifying this pattern at the end of a downtrend as a signal for a potential sentiment shift. Traders typically enter a buy position slightly above the high of the closing bar, with stop-loss levels set below the low or beneath nearby support levels. Take-profit levels are determined based on risk/reward ratios or key resistance levels.
Do Wicks Matter in Engulfing Candlesticks?
Yes, wicks matter in the formation. The wicks provide insights into price rejection and volatility. For a strong confirmation, the absence of long upper wicks suggests sustained buying pressure, reinforcing its validity as a reversal signal.
*Important: At FXOpen UK, Cryptocurrency trading via CFDs is only available to our Professional clients. They are not available for trading by Retail clients. To find out more information about how this may affect you, please get in touch with our team.
This article represents the opinion of the Companies operating under the FXOpen brand only. It is not to be construed as an offer, solicitation, or recommendation with respect to products and services provided by the Companies operating under the FXOpen brand, nor is it to be considered financial advice.


USD/JPY 4H Chart Analysis – Potential Breakdown or Reversal
**USD/JPY 4H Chart Analysis – Potential Breakdown or Reversal**
**Technical Summary:**
The chart shows USD/JPY trading within a rising channel, with recent price action indicating a possible bearish shift. Liquidity above a recent high has been taken, followed by a **change of character (CHoCH)** suggesting potential bearish intent.
**Key Highlights:**
* **Liquidity Grab:** Price swept prior highs, likely triggering buy-side liquidity.
* **CHoCH Identified:** Structure broke to the downside, indicating a bearish shift in market sentiment.
* **Critical Level:** A **4H close below 144.802** is crucial for confirmation of further downside movement.
* **Channel Support:** Price is currently testing the lower boundary of the ascending channel.
* **Scenarios:**
* **Bullish Case:** If the price respects the channel and pushes higher, targets near **150.000** could come into play.
* **Bearish Case:** A confirmed breakdown below **144.802** opens the path toward the **139.000 demand zone**.
**Outlook:**
* Monitor for 4H candle close below 144.802 for bearish confirmation.
* Alternatively, bullish continuation is valid if support holds and structure shifts upward again.
**Disclaimer:** This analysis is for educational purposes only. Always conduct your own research before making trading decisions.

USDJPY Setup: Weak Highs, Smart Money Buys Liquidity!!📊 USDJPY is showing signs of a Smart Money reversal from the discount zone.
This 30-minute chart reveals institutional intentions hiding in plain sight — with clear signs of engineered liquidity grabs and the potential for a strong bullish continuation.
🧠 What’s Happening on the Chart:
✅ Price has swept sell-side liquidity below the recent lows
✅ Retraced cleanly to the 61.8% Fibonacci level at 146.26, a classic Smart Money entry zone
✅ The current price is hovering around the 50% retracement, forming a potential higher low structure
📈 Bullish Confluence:
Price is rebounding from a discount zone (golden ratio: 61.8% Fib)
There’s a clearly defined "weak high" marked around 147.00 — Smart Money typically targets these areas
Above that, there are two stacked buy-side liquidity levels:
147.670
148.282
Final target? The liquidity pool near 148.654 — a clean magnet for price
🎯 Trade Idea:
Long Bias from 146.26–146.43 zone (Smart Money re-entry)
Targets:
TP1: 147.00 (Weak High)
TP2: 147.670 (Buy Side Liquidity)
TP3: 148.282 – 148.654 (Full Liquidity Sweep)
Invalidation: Clean break below 146.20 with strong bearish volume
📌 Why This Setup Works:
This setup uses Smart Money Concepts (SMC):
Weak Highs often signal institutional targets
Fair Value Gap (FVG) + Fib confluence adds strong bullish probability
Retail shorts get trapped, thinking the rally was a pullback — while institutions accumulate at discount
🧠 Pro Tip:
Watch for confirmation with a bullish engulfing candle or break of short-term structure before full entry.
Front-running the Smart Money leads to losses. Let them move first.
💬 Comment "USDJPY MOVE" if you're planning to trade this setup
💾 Save this chart for later — this is how the big players trade FX.

USDJPY re-test RBS to flyI'm expecting UJ to retest RBS and fly to the moon.
wait smaller time frame to confirm reversal movement.
No reversal movement, no buy.
good luck
calculate your own risk & reward.

USDJPY is going down, selllimitShort after successfully breakout support line with a short -term target of at least 10%+ from here.

UPDATED ANALYSIS ON USD/JPYUSD/JPY 4H - AS you can see price has recently come to clear a FVG that was left over from the last impulsive wave that drove price lower. We have now seen price correct itself trading us up and into this area.
I now want to see price break down, confirming that the corrective wave trading us into this inefficiency has finished and a new bearish wave trading us lower is ready be printed.
We will get the confirmation we need one price has broken structure more fractally to the downside. I have marked out the last protected low within the corrective wave. Once we have a break here we have our confirmation.
This is because within bullish structure we break highs and protect lows, so by breaking a low we are not longer following the laws of bullishness but rather following the laws of bearishness, confirming this next bearish impulse.

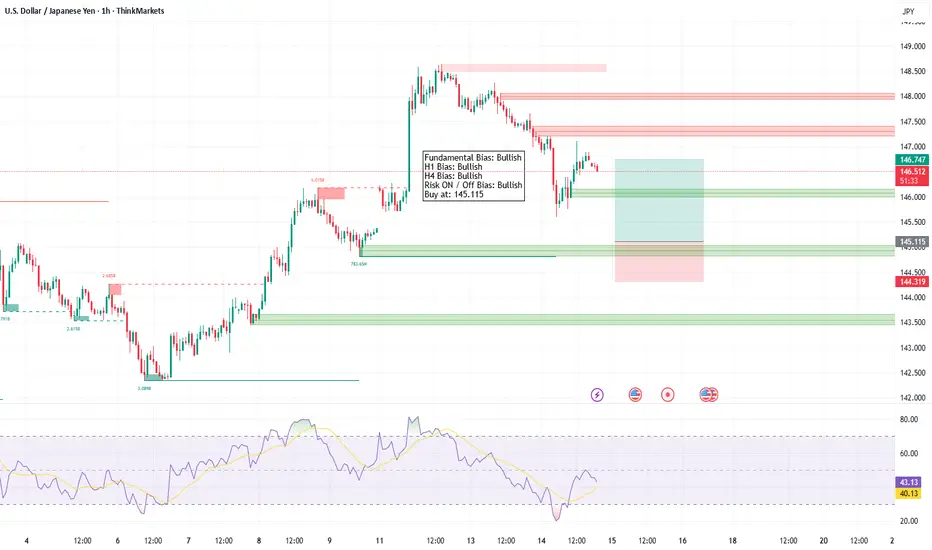
USDJPY - Buy on 145.115 - 15/05/2025Fundamentals: The yen depreciated as global risk appetite improved, reducing demand for safe-haven assets.
Technical: Bullish momentum persists, with resistance at 146.50 and support at 145.00.
USDJPY: Continue to short after risingUSDJPY's downward trend has not ended, wait for it to rise before continuing to short
Accurate signals are sent every day, all profitable and free. Account management services are also provided.
USDJPY sell@148-148.5
tp:146-145

USD/JPY Support Test at Prior Resistance + Trendline in-PlayUSD/JPY came into the week with a full head of steam, testing above the 148 level after having found support at 145 last Friday. The pullback on Tuesday was pronounced, helped along by a weak U.S. CPI report, but so far USD/JPY and USD bulls have stepped up at key spots of support. In DXY, prior neckline resistance from the inverse head and shoulders pattern has come into play and in USD/JPY, it's a confluent spot at 145.92 and 146.20 that's stepped-in to hold a possible higher-low.
There's also the trendline projection which, notably, held resistance after both the BoJ meeting two weeks ago and the FOMC rate decision last week. That trendline is shown in red and it's coming into play as support.
For next resistance - the 200-day moving average seems important and that plots about 40 pips below the 150.00 handle. Given the numerous traps that have printed on both sides of the Yen this year, chasing still seems dangerous and attempting to work with pullbacks in trends remains an attractive way forward. - js

Too Many Bullish Clues — Greed Activated📍Current Price: 143.437
TimeFrame 30Min
Bullish Reasons:
+ Strong Support
+ Psychological Level
+ Tweezer Bottom
+ Bullish RSI Divergence
+ Channel Bottom
= Potential Bullish Reversal
Support & Resistance Levels:
• 142.000 – Strong Support + Psychological Level
• 140.000 – Strong Support + Psychological Level
• 148.000 – Psychological Level + Price Target
• 150.000 – Psychological Level
"Trade smart – always follow your risk management.
Protect your account first, profits will follow.
Happy trading!"
