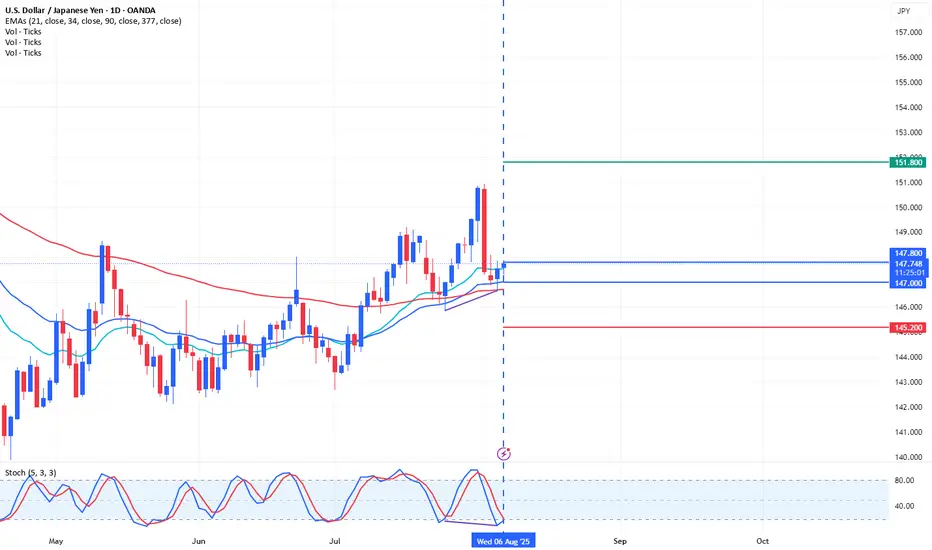
Trading Ideas USDJPY 1D [Disc On]Technical Analysis:
There is a hidden bullish stochastic divergence on the 1D timeframe, indicating a potential continuation of the previous trend. The price has also entered the Fibonacci 0.618 retracement area.
Conclusion:
There is a high probability of seeking BUY positions in the range of 147.800 – 147.000, with a Take Profit target at 151.800 and a Stop Loss at 145.200.
USDJPY trade ideas
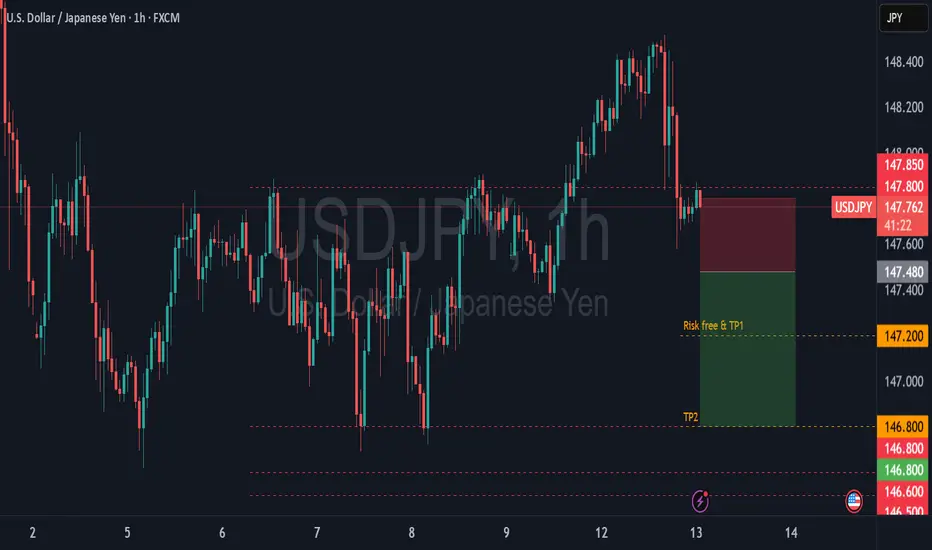
USD/JPY – 15M | OB Rejection SetupPrice is approaching the Order Block (OB) zone.
Scenario to watch:
📉 Bearish – Reject from OB (~148.75) → Break below P1D High (~148.20) → Target Swing Low (~147.80) and P1D Low (~147.15).

Bullish Continuation We are in a bullish market , structure broken to the upside and now price is at premium, anticipating bullish movement to take out the high

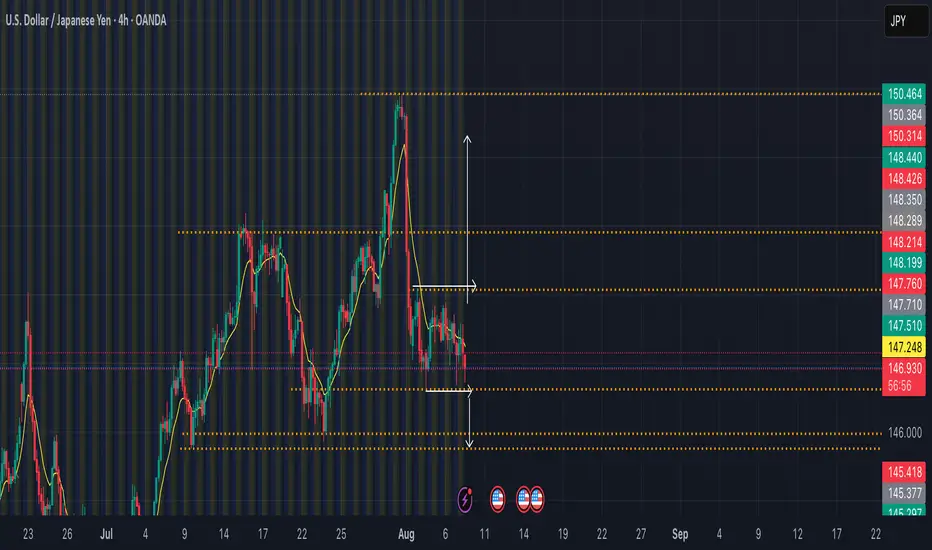
USDJPY- STRONG BUY NEAR 1D MA50
After our June 13 buy signal hit 148.675 target, USDJPY now forms a Channel Up, supported again by the 1D MA50 (blue line).
As long as this Higher Low holds, expect a new bullish leg with a +4.14% upside toward 152.500.
The 1D RSI confirms strength, holding a higher lows trend-line.
Subscribe ✍️ & BOOST 🙌 if you like this setup!

USDJPY – Anticipating Pullback to 149.068 for Short SetupUSDJPY is showing signs of exhaustion after its recent bullish run. Price is currently hovering near resistance zones, and I’m anticipating a pullback into the 149.068 level, which aligns with a previous structure zone and potential supply area.
Here’s my outlook:
Market Structure: On the higher timeframes, USDJPY remains in an extended uptrend, but we are starting to see lower timeframe weakness and potential reversal signals.
Key Zone: 149.068 is a confluence area where price previously reacted strongly, making it a valid watch zone for bearish entries.
Trade Plan: I will patiently wait for price to retrace into this level. If I see rejection candles, bearish engulfing patterns, or momentum shift confirmation on the 4H timeframe, I will look for short opportunities.
Targets: Short-term target at 148.500, with extended targets towards 147.800 if bearish momentum sustains.
Risk Management: I’ll place my stop loss above the recent swing high to protect against unexpected breakouts.
⚠️ Note: This is not financial advice just my personal trading plan. Always trade with a risk management strategy in place.
📊 Key Levels to Watch:
Resistance: 149.068

USD/JPY, CAD/JPY, CAD/JPY Technical OutlookSome interesting setups are forming on the daily charts of USD/JPY, CAD/JPY and CHF/JPY. Keep in mind that USD/JPY will be more sensitive to the incoming US inflation report, which leaves the potential for some divergences to form among the Japanese yen pairs. Overall, my bias is for them to move lower in due course.
Matt Simpson, Market Analyst and City Index and Forex.com


USDJPY - BEARISHOverall USDJPY looks bearish.
holding shorts since last few days.
adding one more fresh short entry aggressively today with a small SL

Pending saleIf downward momentum occurs again, we can expect this position to be activated and be able to reach the target.
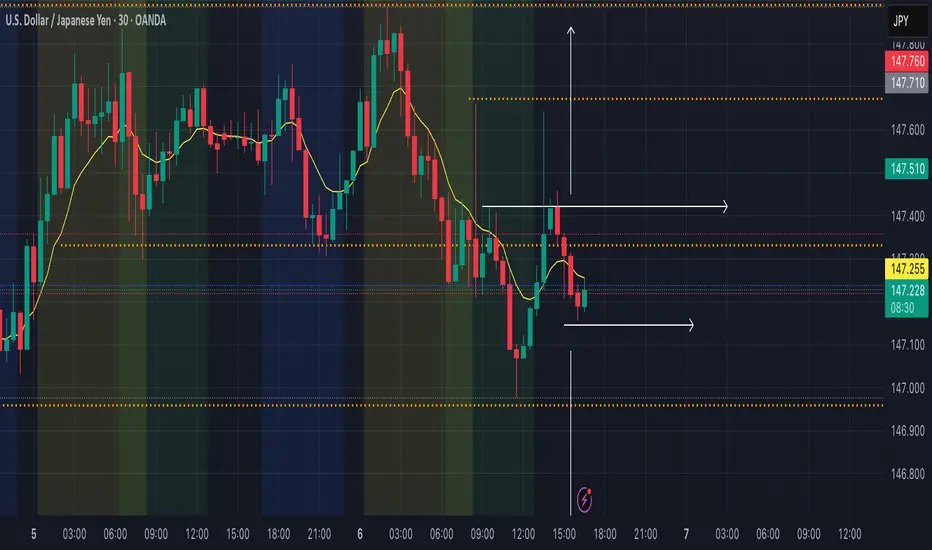
Trade Idea: Aug 7 - Asian Session - Possible both directionsHTF: D/4Hr - The daily looks like an uptrend, however on the 4h we are seeing lows being target which would be equal to previous lows, hinting a range market possibility.
MTF: 30m - Using the key levels from the HTF, we spot break of structure areas for trade entries on the range being formed. We identified targets for price to go.
ETF: 5m - Place the limit orders on the outside of the break of structure with a stoploss in areas we feel should act as resistance or support to the target direction.
Trade Idea: Aug 6 - USDJPY - Both DirectionsHTF: D / 4HR - Seems to be in a consolidation, I feel I should just sit on the side line, but trying it out.
MTF: 30m - Identified key areas of support and resistance
ENT 5 - Enter on breaks of structure, manage risk dynamically
Bullish returndaily shows break of channe resistance trend line, choch and bos REVERSE HEAD AND SHOULDER

USDJPY 30Min Engaged (Bullish Reversal Entry Detected )➕ Objective: Precision Volume Execution
Time Frame: 30-Minute Warfare
Entry Protocol: Only after volume-verified breakout
🩸 Bullish Reversal : 147.450
➗ Hanzo Protocol: Volume-Tiered Entry Authority
➕ Zone Activated: Dynamic market pressure detected.
The level isn’t just price — it’s a memory of where they moved size.
Volume is rising beneath the surface — not noise, but preparation.
🔥 Tactical Note:
We wait for the energy signature — when volume betrays intention.
The trap gets set. The weak follow. We execute.

USD/JPY Update - Potential TargetsDear Friends in Trading,
How I see it,
** CPI Release tomorrow - BE SAFE!
Keynote:
Testing "BEARISH" barrier, at this time.
CPI has the potential to give a clearer picture.
I sincerely hope my point of view offers a valued insight
Thank you for taking the time study my analysis.

USD/JPY on different movelets follow up each and every break outs and see how we follow and master the skill please allow your self to check and read candle moves

USDJPY (Monthly/Weekly/Daily analysis)hi everyone welcome back to another week hope everyone had a great weekend and as always happy trading


AUDUSD – SHORT POSITION TRADE BREAKDOWN Q3 | W32 | D6 | Y25📊 AUDUSD – SHORT POSITION TRADE BREAKDOWN
Q3 | W32 | D6 | Y25
Daily Forecast 🔍📅
Here’s a short diagnosis of the current chart setup 🧠📈
Higher time frame order blocks have been identified — these are our patient points of interest 🎯🧭.
It’s crucial to wait for a confirmed break of structure 🧱✅ before forming a directional bias.
This keeps us disciplined and aligned with what price action is truly telling us.
📈 Risk Management Protocols
🔑 Core principles:
Max 1% risk per trade
Only execute at pre-identified levels
Use alerts, not emotion
Stick to your RR plan — minimum 1:2
🧠 You’re not paid for how many trades you take, you’re paid for how well you manage risk.
🧠 Weekly FRGNT Insight
"Trade what the market gives, not what your ego wants."
Stay mechanical. Stay focused. Let the probabilities work.

USDJPY| Bullish Setup After OB MitigationBias: Bullish
Pair: USDJPY
Higher Timeframe Context (4H & 2H)
• Major 4H high at 149.211 was broken, pushing price to a new high at 150.910.
• Expected pullback has played out, with price mitigating a refined 4H internal structure order flow zone between 146.735 – 145.864.
• This refined order flow zone has historical reaction points from previous weeks, indicating strong demand.
Lower Timeframe Context (30M & 5M)
• On the 30M chart, key high at 148.819 preceded a sell-side liquidity sweep at 148.595.
• Following the sweep, price dropped and mitigated the refined 30M order block between 147.893 – 147.812, showing strong reaction.
• Currently awaiting a 5M lower high break as confirmation for bullish continuation.
Execution Plan
• Standby for a confirmed 5M lower high break and a sweep of minor sell-side liquidity into next week.
• Look for entry after mitigation of the refined OB for a bullish continuation.
• Targets: 5M highs and 30M highs, depending on structure delivery.
Key Levels
• 4H High (broken): 149.211
• New High: 150.910
• 4H Refined Order Flow Zone: 146.735 – 145.864
• 30M High: 148.819
• 30M Liquidity Sweep: 148.595
• 30M Refined OB: 147.893 – 147.812
Summary:
USDJPY remains in bullish structure after breaking major highs and pulling back into strong demand. The higher timeframe structure supports continuation, but execution will wait for lower timeframe confirmation — specifically a 5M lower high break and liquidity sweep into refined demand. Patience here sets up a clean, high-probability long entry into next week.

THE RISE: Technical Analysis: USD/JPY vs. DXY
Upon reviewing the DXY (U.S. Dollar Index) in correlation with USD/JPY (UJ), current price action suggests a potential continuation toward new highs in USD/JPY. The strength in the DXY supports a bullish outlook, indicating sustained dollar momentum. Price structure on the USD/JPY chart aligns with this narrative, showing a clear uptrend with higher highs and higher lows, and no immediate signs of reversal. Overall, the technical setup appears favorable for further upside in USD/JPY.

USDJPY – DAILY FORECAST Q3 | W32 | D7 | Y25📊 USDJPY – DAILY FORECAST
Q3 | W32 | D7 | Y25
Daily Forecast 🔍📅
Here’s a short diagnosis of the current chart setup 🧠📈
Higher time frame order blocks have been identified — these are our patient points of interest 🎯🧭.
It’s crucial to wait for a confirmed break of structure 🧱✅ before forming a directional bias.
This keeps us disciplined and aligned with what price action is truly telling us.
📈 Risk Management Protocols
🔑 Core principles:
Max 1% risk per trade
Only execute at pre-identified levels
Use alerts, not emotion
Stick to your RR plan — minimum 1:2
🧠 You’re not paid for how many trades you take, you’re paid for how well you manage risk.
🧠 Weekly FRGNT Insight
"Trade what the market gives, not what your ego wants."
Stay mechanical. Stay focused. Let the probabilities work.
FX:USDJPY

trade idea: aug 6 london - longhtf: 4h long bias
mtf: 30m key levels
etf: 5min break of structure enter trade

153 next target USDJPYUSDJPY buyers are targeting 153. BEFORE we sell.
The buyers are showing some confidence at the current levels.
