Can PCE data rescue the dollar? JPY, EUR, GBP setup in playThe latest U.S. PCE report is set for release at 8:30am EDT, with both headline and core inflation expected at 0.1% month-on-month.
As the Fed’s preferred inflation measure, today’s figures could influence interest rate expectations. A stronger print may reduce the case for a July rate cut, while a softer result could add pressure on the U.S. dollar.
The dollar has already weakened this week amid speculation over central bank independence (trump is reportedly considering nominating Fed chair Jerome Powell’s successor earlier than normal in order to undermine the current chair).
Pairs to watch include, EUR/USD, GBP/USD, USD/JPY with symmetrical triangle formations suggesting breakout potential in either direction for all once the data hits.
USDJPY trade ideas

Is USDJPY in a Downtrend?USDJPY is supported by the trendline and the price is facing the resistance zone of 144.500. If the candle cannot close above this resistance zone, the sellers can push the price to break the trendline and head towards the support zone of 142.700. This support zone plays an important role in shaping the trend if broken the downtrend can be extended and no support zone can be strong enough to push the price of the pair until 140.300.
There is still a high possibility of a reaction so the BUY strategy at the support zone of 142.700 is still ready
On the other hand, if the candle closes above the resistance zone of 144.500, the uptrend is still maintained and heading towards this week's peak around 147.500. Pay attention to the price reaction at 146.000.

UJ correlating with the dollar?We see price creating LL's and LH's heading to the downside. Structure retested at a LH with a perfect bearish engulfing printing right after the retest of support which turned resistance! Counter trend line was broken. I was also looking at multiple brokers & it looks like the 4hr bearish engulfing only printed on a select few brokers . . Although we did align on a 15 min which is lower time frame. Trade management is key, we shall see what happens next!

USDJPY is ready to go down to 143.834USDJPY is ready to follow my strategy and is already going down to 143.834

The trend is more important than the exact high to shortCatching the precise high to short is a tough game. I prefer to leave this to the expert. In the day chart, we have a nice bearish candle and here in the 1H chart, you can see my short position is more than halfway from the exact fall (coz I really can't predict the market movement).
So, I have two targets for those keen to short, the 2nd one upon breaking down from the bullish trend line.
Again, I stressed the volatility of this pair so if you cannot stomach it, it is better to go for my EURUSD pair. See next chart.

USDJPY Analysis (prediction)Hi everyone sorry I am sick so just have to bear with me. Please note this is not financial advice and for my own educational purposes. happy trading evertone

USD/JPY Trendline TestAs USD has broken down against most major currencies, USD/JPY continues to hold on to higher-lows as taken from a trendline connecting April and early-June swing lows.
The intra-day reversal on Monday was stunning, with price rejected at 148.00 and going all the way down to 145.00 for a mild bounce on Tuesday morning. But sellers reacted to that, as well, holding highs at 145.92 on the way to fresh lower-lows.
That 145.00 level is now set up as short-term lower-high resistance potential; and for those looking for Yen-weakness, there could be more attractive setups elsewhere, such as EUR/JPY or GBP/JPY.
For USD/JPY, there's data on both sides of the pair as Tokyo CPI is set for release later tonight, followed by U.S. Core PCE tomorrow morning. - js

Bearish drop off pullback resistance?USD/JPY is rising towards the resistance level which is a pullback resistance that lines up with the 23.6% Fibonacci retracement and could drop from this level to our take profit.
Entry: 144.61
Why we like it:
There is a pullback resistance level that aligns with the 23.6% Fibonacci retracement.
Stop loss: 146.11
Why we like it:
There is a pullback resistance level that aligns with the 50% Fibonacci retracement.
Take profit: 142.70
Why we like it:
There is a pullback support level that aligns with the 100% Fibonacci projection.
Enjoying your TradingView experience? Review us!
Please be advised that the information presented on TradingView is provided to Vantage (‘Vantage Global Limited’, ‘we’) by a third-party provider (‘Everest Fortune Group’). Please be reminded that you are solely responsible for the trading decisions on your account. There is a very high degree of risk involved in trading. Any information and/or content is intended entirely for research, educational and informational purposes only and does not constitute investment or consultation advice or investment strategy. The information is not tailored to the investment needs of any specific person and therefore does not involve a consideration of any of the investment objectives, financial situation or needs of any viewer that may receive it. Kindly also note that past performance is not a reliable indicator of future results. Actual results may differ materially from those anticipated in forward-looking or past performance statements. We assume no liability as to the accuracy or completeness of any of the information and/or content provided herein and the Company cannot be held responsible for any omission, mistake nor for any loss or damage including without limitation to any loss of profit which may arise from reliance on any information supplied by Everest Fortune Group.

Market next move Disruption of the Bullish USD/JPY Analysis
1. Weak Bullish Momentum
The current bullish attempt is showing small-bodied candles with low follow-through.
Disruption: This suggests a lack of conviction from buyers. If there’s no strong bounce soon, it could indicate distribution rather than accumulation.
2. Volume Imbalance
Notice the recent spike in bearish volume (red bars), especially during the last price drop.
Disruption: Volume is supporting the downtrend, not the rebound. This suggests sellers are still in control.
3. Lower High Structure
The price recently failed to form a higher high and continues forming lower highs and lower lows.
Disruption: This pattern is a classic sign of a continuing bearish trend, contradicting the bullish target.
4. Fundamental Headwinds
The U.S. economic icon (flag) suggests an upcoming high-impact event — likely NFP, GDP, or rate decision.
Disruption: If U.S. data is weak or if there's talk of the Fed pausing rate hikes, USD could weaken, pushing USD/JPY further below 144.000.

Yen rises sharply, Tokyo Core CPI nextThe Japanese yen has posted strong gains on Thursday. In the North American session, USD/JPY is trading at 144.14, down 0.55% on the day. Earlier, USD/JPY fell as low as 143.75, its lowest level since June 13.
Tokyo Core CPI, a leading indicator of nationwide inflation trends, will be released early Thursday. Tokyo Core CPI hit 3.6% in May, its highest level in over two years. The market estimate for June stands at 3.3%.
The Bank of Japan has signaled that more rate hikes are on the way, provided that inflation continues to move towards the BoJ's level of a sustainable 2%. However, trade talks between the US and Japan have hit a snag, with Japan saying it can't accept US tariffs of 25% on automobiles. The clock is ticking, as US reciprocal tariffs will take effect on July 9 without a deal.
The markets are eyeing a possible rate hike in July, which would be the first rate hike since January. The BoJ meets next on July 31, and if the two sides can reach a trade deal before then, it could cement a rate hike at that meeting. Even if the BoJ maintains rates at the upcoming meeting, investors will be keen to see the new inflation and growth forecasts.
The BOJ's summary of opinions from the June meeting, released Wednesday, didn't provide much insight into the BoJ's rate path. Board members were divided over whether to raise rates in a period of economic uncertainty over the impact of US tariffs on Japan's economy.
There is support at 144.59 and 143.93
145.27 and 145.93 are the next resistance lines

USDJPY – Uptrend Still Intact, But Waiting for a BounceUSDJPY is currently pulling back toward the key support zone at 142.244 after being rejected from the 148.000 resistance area. This recent drop reflects strong selling pressure from the dense FVG zones near Resistance 2.
However, the overall structure remains bullish, with a series of higher highs and higher lows still intact. The current support zone is crucial—if it holds, USDJPY could rebound toward 145.800 and potentially retest the 148.000 level.
On the news front:
– A fragile ceasefire between Iran and Israel has improved global risk sentiment, reducing demand for USD as a safe haven.
– The Bank of Japan kept interest rates unchanged and signaled caution in reducing bond purchases—supporting the yen, but not enough to reverse the dollar's edge.
– The wide interest rate differential still favors the USD.
Strategy: Watch for bullish confirmation at 142.244. If buyers step in clearly, it may present a long opportunity in line with the dominant uptrend.


USDJPY: Bullish Forecast & Bullish Scenario
The recent price action on the USDJPY pair was keeping me on the fence, however, my bias is slowly but surely changing into the bullish one and I think we will see the price go up.
Disclosure: I am part of Trade Nation's Influencer program and receive a monthly fee for using their TradingView charts in my analysis.
❤️ Please, support our work with like & comment! ❤️

USDJPYCOT Report: Shows net shorts on the USD, suggesting a bearish outlook for USD/JPY as institutional traders expect the JPY to strengthen against the USD. Bias: A break below support

USDJPY Analysis – Bearish Retracement SetupPrice is currently hovering around 144.340, and I'm anticipating a short-term pullback into the 144.786 zone — a key area of interest that aligns with a premium supply zone and possible order block on the H1/H4 timeframe.
This retracement may serve as a liquidity grab before price resumes its bearish move toward 142.526, which sits near a higher timeframe demand zone or liquidity pool.
If bearish confirmation (e.g., M-formation, bearish engulfing, or break of internal structure) appears at 144.786, I’ll be looking to short down to 142.526.
🔹 Short-term bias: Bullish retracement
🔻 Mid-term bias: Bearish continuation
🔍 Key Levels:
Retracement zone: 144.786
Target zone: 142.526
Current price: 144.340
📌 Risk Management Note: This is not financial advice. Always use proper risk-to-reward (RR) setups, manage your lot size wisely, and never risk more than 1–2% of your account per trade. Trading involves risk — protect your capital first.

USDJPY: Classic Bearish PatternThe USDJPY has developed a significant head and shoulders pattern on the 4-hour time frame.
We see a confirmed breach of the neckline and an intraday candle closing below it.
The pair is likely to keep falling, with the next target at 143.05.

USD/JPY) bearish Trand analysis Read The captionSMC trading point update
Technical analysis of USD/JPY on the 3-hour timeframe, highlighting a breakdown from trendline resistance and projecting a move toward a significant downside target.
---
Technical Breakdown
1. Trendline Rejection
Price sharply rejected from the descending resistance trendline near 148.00 (red arrow), forming a potential lower high.
This suggests continuation of the broader downtrend structure.
2. Break Below EMA 200
Price has broken below the 200 EMA (144.752), signaling a shift in momentum from bullish to bearish.
EMA is likely to act as dynamic resistance if price attempts a pullback.
3. Bearish Projection
The chart outlines a measured move downward toward the target point at 139.955, implying a drop of over 5.36% (approximately 770 pips).
The projected path shows lower highs and lower lows, confirming bearish structure.
4. RSI Confirmation
RSI (14) is currently at 29.98, indicating oversold conditions, but this often supports strong momentum in trending markets—suggesting a possible continuation lower after minor retracements.
Mr SMC Trading point
---
Conclusion / Idea Summary
Bias: Bearish
Entry: After trendline rejection and EMA 200 break (~144.75)
Target: 139.955
Invalidation: Break above 148.00 resistance trendline
---
Please support boost 🚀 this analysis)

* No bullish defense yet, and volume is not showing divergence.The probability of continuation **to the downside is still high**, especially if the price closes a strong bearish candle below **143.90** in the next few hours.

USDJPY LAST LIQUDITY GRAB BEFORE WE FLY TO THE MOONI took this 15m @ 144.623 i believe this is last LIQUIDITY GRAB before we fly
Risk reward is very good lets hope our probability works
I will hold this till main target or get decline formation
I will update either way, WIN/LOST
Wish me luck
Thanks

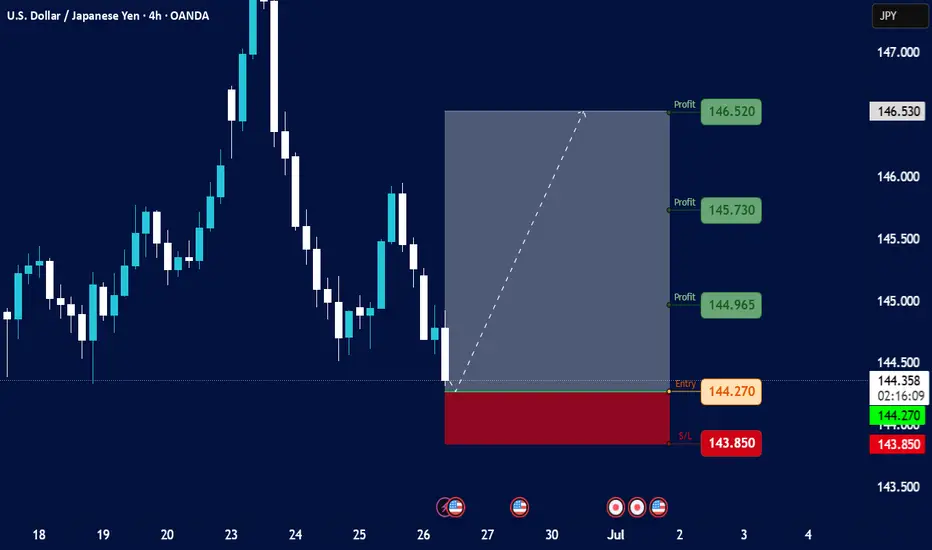
USDJPYCurrent Price Action:
The USD/JPY pair is trading at 144.414, down -0.842 (-0.588%).
The price is hovering near the 20-period BMA (144.384) and OXIDA level (141.784), suggesting a potential inflection point.
Support and Resistance Levels:
Immediate Resistance: 144.500, 145.000, 145.500.
Strong Resistance: 146.000, 146.530, 147.000 (profit target).
Immediate Support: 144.000, 143.850 (double-bottom level), 143.500.
Strong Support: 144.270 (near current price), 143.850 (critical).
Technical Indicators:
BMA (20-period): The price is slightly above the BMA at 144.384, indicating neutral momentum.
OXIDA: The OXIDA level at 141.784 is far below, acting as a long-term support.
Market Sentiment:
The downtrend is mild (-0.588%), but the proximity to key support (143.850-144.000) suggests potential consolidation or reversal if buyers step in.
A break below 143.500 could signal further downside, while a rebound above 145.000 may target 146.000-147.000.
Trading Strategy:
Bullish Scenario: If price holds above 144.000, consider longs with targets at 145.000, 145.500, and 146.000. Stop loss below 143.850.
Bearish Scenario: A break below 143.850 could lead to a test of 143.500. Shorts may target 143.000 with a stop above 144.270.
Conclusion:
The pair is in a short-term downtrend but near critical support. Watch for reactions at 144.000-144.500 to determine the next directional move. Risk management is key given the tight range.
USDJPY 15M LAST OPPOTUNITY TO FLYHere where we re-invest THE HALF LOT we close earlier today on the trade that we took yesterday (THE REMAINING HALF STILL RUNNING {https://www.tradingview.com/chart/USDJPY/vYQEgzZy-USDJPY-LAST-LIQUDITY-GRAB-BEFORE-WE-FLY-TO-THE-MOON/} LINK),
Same TARGET OF 149.79 But as usual will keep TAKING PROFIT along the way
Will update every time i change something
Please comment welcome and if you have any question just Halaa :)
All the best and good night

USDJPY LONG Market structure bullish on HTFs DH
Entry at Daily AOi
Weekly Rejection At AOi
Daily Rejection at AOi
Previous Daily Structure point
Daily EMA Retest
Around Psychological Level 145.000
H4 EMA Retest
H4 Candlestick rejection
Rejection from Previous structure
Levels 3.67
Entry 95%
REMEMBER : Trading is a Game Of Probability
: Manage Your Risk
: Be Patient
: Every Moment Is Unique
: Rinse, Wash, Repeat!
: Christ is King.

USD JPY --->>> SHORT!Sell on dollar against yen. Analysis based on the daily chart. Entry based on the hourly time frame.
