Stop loss for USDJPYNow , if you have not followed the story of this pair, USDJPY, please go read my strategy here
That is the big big picture, like looking at the forest from the helicopter view.
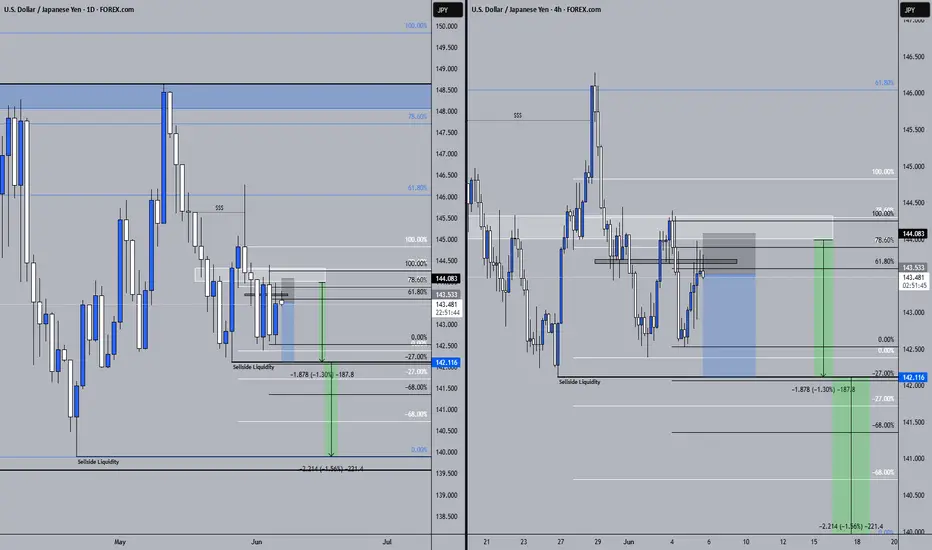
Now, let's go into the woods to see clearer. In the 4H chart, we can see that we are now locked in a range between 142.46 and 144.48 price level.
Assuming you want to short after you are convinced of my take on US dollar story and safe haven assets like Yen, Euro,etc , then where would you put your SL ?
25 May and 4 Jun - there were two resistance points where price fails to break above. Now, our price is going to revisit this resistance zone again. If you based on the high of 29 May candle as the point to place your SL, it appears too high. It was a false breakout on hindsight.
I am placing my own SL on the 3rd red candle around 145.433. I calculated I can short 0.8 contract with a 50 points SL and I would need to pay around 189 . This fulfils my 2% per trade principle based on 1000 capital.
With this in mind, to add on to my winners, I would have to make sure that I do not allow my emotions of greed and fear to magnify my SL nor increase my position size unnecessarily. This is very important. No matter how confident you think the market is going with you, anything can happen in the market and if you are WRONG, how much are you willing to pay? If you do it on impulse with pre calculation, then your emotions will take over especially if you get stopped out and wanted to do a revenge trade. Oh, tell me about it, so many times I have done that and lost money !
Hope this is useful for some of you.......
USDJPY trade ideas

Buying Yen against the DollarI first mentioned briefly about this pair here and safety assets here which I got it right in the rough direction.
I have been stopped out several times for this volatile pair but the losses taught me something. If we look at this line chart closely, we can see that it took only 2 months from July 2024 to Sept 2024 to fall from a peak of 161 to 140. If you missed this opportunity, the second time was 158 on 8 Jan 2025 and fell to 140 on 22 Apr 2025 (3 months).
The green bullish trend line is KEY , if the price action fails to hold above this line, then there are several profit targets for you as shown on chart.
Since I have not shorted at the peak of 161 or 158 , then looking back on hindsight serves no benefits but the fall from current price to 127 is equally rewarding.
I will be shorting in tranches of 1 - 3 contracts to capture my winners instead of taking profits at those levels and shorting at lower price each time and get stopped out due to retracement. Price action will not move in a linear fashion like the arrows I drew (fat hope, haha).
So , do adjust your SL slightly wider and manage your own risk capital. Again, this is a much volatile pair and may not suit those with lower risk tolerance. Trade what you can afford to lose.

Another short for USDJPYThe same story, USD dollar remains weak in the upcoming months........Let's bring it down further !

USDJPY FALLAs per the analysis the trend is down in 1 hour and 1 day chart, USDJPY is retesting its resistance level again, time to take the trade with good risk reward.
RSI + EMA + FVG + Order Block + Volume = ✔

What Is the Hanging Man Candlestick Pattern: Meaning & Trading?What Is the Hanging Man Candlestick Pattern, and How Can You Trade It?
In the world of technical analysis, candlestick patterns play a vital role in helping traders decipher market trends and potential reversals. Among the many setups, the hanging man holds particular significance. This distinctive formation captures traders' attention as it often serves as a warning sign of a possible trend reversal. This article will go through the technical analysis of the hanging man formation and explain how traders can trade with it.
What Is a Hanging Man Pattern?
The hanging man candlestick pattern is characterised by a small body near the top of the candlestick, a long lower shadow, and little to no upper shadow. It resembles a figure hanging from its head, hence the name "Hanging Man."
Psychology Behind the Hanging Man
The psychology behind the hanging man candlestick pattern reflects a shift in market sentiment. After a sustained uptrend, the appearance of this pattern indicates that buyers are losing momentum. The long lower shadow shows that sellers were able to push prices down significantly during the trading session. Although buyers managed to drive prices back up, the close near the open price suggests weakening bullish sentiment. This pattern signals that selling pressure is increasing, potentially leading to a bearish reversal as confidence among buyers diminishes.
The hanging man is a versatile formation that can be applied across a wide range of financial instruments, including stocks, cryptocurrencies*, ETFs, indices, and forex, on different timeframes.
Identifying a Hanging Man Candlestick on Trading Charts
To spot a hanging man pattern in stocks and other financial instruments, you may follow these key steps:
Look for an existing uptrend: Start by identifying a prevailing upward price movement on the chart.
Locate a candlestick with specific characteristics: Search for a candlestick with a small body near the top, a long lower shadow, and little to no upper shadow. This formation resembles a figure hanging from its head. The colour of the candle doesn’t matter, but if it’s bearish, the signal is stronger.
Consider supporting indicators: Utilise other technical indicators or oscillators to further validate the potential reversal. These can include trendlines, moving averages, or momentum indicators that align with the bearish interpretation.
Note that there is no such thing as an inverted hanging man candlestick or a bullish hanging man candlestick pattern.
Trading the Hanging Man Pattern
Those trading the hanging man reversal pattern need to apply a systematic approach in order to increase the likelihood of successful trades. Here are a few steps traders usually follow to trade this pattern:
- Identification: Identify the setup by using the steps mentioned above.
- Look for confirmation signals: The setup alone is not sufficient for making trading decisions. Seek additional confirmation through subsequent candlestick patterns or technical indicators. This can include bearish candlestick patterns (e.g. bearish engulfing or shooting star), a breach of support levels, or the convergence of other indicators signalling a potential reversal.
- Define your entry point: An entry point can be either when the next candlestick confirms the bearish sentiment or when the price breaches a significant support level.
- Consider risk management: Assess the risk-reward ratio of the trade and ensure it aligns with your risk tolerance. For efficient risk management, you may adjust your position size accordingly. Risk management tools like position sizing, setting stop-loss orders, and diversification may help protect your capital. You may set a stop-loss order above the hanging man pattern to limit potential losses if the trade goes against you.
- Identify profit targets: The candlestick itself doesn't provide specific targets. Traders can identify profit targets by looking at previous support levels, Fibonacci retracement levels, or other technical analysis tools like moving averages or pivot points.
- Monitor the trade: Keep a close eye on your position as it progresses. Pay attention to any changes in market conditions or additional signals that may invalidate the trade.
- Learn from outcomes: Regardless of the outcome of the trade, analyse it afterwards to identify areas for improvement. Assess whether the setup provided accurate signals and identify any factors that may have affected its success. This analysis will help refine your trading strategy over time.
Live Market Example
Consider the example of a hanging man on the forex USDJPY pair. An entry is placed on the next bearish candlestick with a stop loss just above the hanging man. The take profit order is at the next level of support marked by the orange line.
Limitations of the Hanging Man Candlestick
The hanging man candlestick pattern, while useful, has certain limitations that traders need to consider:
- False Signals: The hanging man can produce false signals, especially in volatile markets where price movements are erratic.
- Market Context: The effectiveness of the pattern varies depending on the broader market context and prevailing trends.
- Timeframe Sensitivity: Its reliability can differ across various timeframes; what works on a daily chart may not be as effective on an intraday chart.
- Not Standalone: It should not be used in isolation but as part of a comprehensive trading strategy that includes other indicators and risk management tools.
Comparing the Hanging Man to Similar Candles
Understanding how the hanging man pattern differs from similar candlestick patterns helps in accurate technical analysis. Here's a brief comparison of the hanging man with related patterns.
What Is the Difference Between a Hanging Man and a Hammer?
Both have the same candle structure. However, the hanging man candlestick occurs in an uptrend and signals a potential bearish reversal, while the hammer occurs in a downtrend, indicating a potential bullish reversal. Interestingly, it is possible to see a hanging man candlestick in a downtrend, often as part of a bullish retracement. Both candles require confirmation from subsequent price movements. They should be analysed within the context of the overall market trend and other technical indicators.
What Is the Difference Between a Pin Bar and a Hanging Man?
A pin bar and a hanging man are both single-candlestick patterns with small bodies and long shadows, but they serve different purposes in technical analysis. The pin bar has a small body and a long tail, indicating a reversal, but it can appear in any market condition. Its long tail shows a strong rejection of a certain price level, with the body pointing in the direction of the anticipated reversal.
The hanging man, however, specifically occurs after an uptrend and signals a potential bearish reversal, characterised by a small body at the top and a long lower shadow, indicating selling pressure.
What Is the Difference Between a Shooting Star and a Hanging Man Candlestick?
The shooting star and the hanging man are both bearish reversal patterns, but they differ in their appearance and context. A shooting star occurs after an uptrend and features a small body at the bottom with a long upper shadow, indicating that the price was pushed up significantly but fell back down, showing strong selling pressure.
The hanging man also appears after an uptrend but has a small body at the top with a long lower shadow, suggesting that sellers dominated the session despite an initial push by buyers. Both require confirmation from subsequent candlesticks to validate the reversal.
Final Thoughts
While the hanging man alone is insufficient for making trading decisions, it serves as a warning signal that buyers may be losing control and that selling pressure could increase. Traders seek additional confirmation through subsequent candlestick patterns, support and resistance levels, and other technical indicators to validate the potential reversal.
By understanding the implications of the setup within the broader market context and employing proper risk management strategies, traders can enhance their decision-making process and improve their chances of identifying different trading opportunities.
FAQ
What Does the Hanging Man Pattern Indicate?
The hanging man trading pattern in technical analysis typically indicates a potential trend reversal in an uptrend. It suggests that the buyers, who have been driving the market higher, are losing control, and the selling pressure may increase.
The hanging man is represented by a small body near the top of the candlestick, a long lower shadow, and little to no upper shadow. It resembles a figure hanging by the neck. This visual representation conveys the potential bearish sentiment.
Can a Hanging Man Candle Be Bullish?
No, there is no such thing as a bullish hanging man candlestick pattern. The bearish hanging man pattern indicates a potential trend reversal from an uptrend to a downtrend.
Is the Hanging Man Pattern Reliable?
The reliability of the formation, like any candlestick pattern, can vary depending on several factors. While the setup is widely recognised and considered a potential bearish reversal signal, it should not be relied upon as the sole basis for trading decisions. It is crucial to consider other factors and confirmation signals to increase its reliability.
What Is the Confirmation Candle for the Hanging Man?
A confirmation candle for the hanging man is a bearish candlestick that follows the pattern, confirming the reversal. This can include a bearish engulfing candle or a candlestick closing well below the hanging man's body, indicating increased selling pressure.
Is the Hanging Man Pattern Bearish?
Yes, it is generally considered a bearish pattern in technical analysis. It is formed when the price’s open or close is near or at its high, there is a significant decline during the trading session, and it closes not far from the opening price. The pattern resembles a hanging man with his legs dangling.
*Important: At FXOpen UK, Cryptocurrency trading via CFDs is only available to our Professional clients. They are not available for trading by Retail clients. To find out more information about how this may affect you, please get in touch with our team.
This article represents the opinion of the Companies operating under the FXOpen brand only. It is not to be construed as an offer, solicitation, or recommendation with respect to products and services provided by the Companies operating under the FXOpen brand, nor is it to be considered financial advice.

Bullish rise off pullback support?USD/JPY has bounced off the pivot and could rise to the 1st resistance that aligns with the 61.8% Fibonacci projection.
Pivot: 143.45
1st Support: 143.08
1st Resistance: 144.42
Risk Warning:
Trading Forex and CFDs carries a high level of risk to your capital and you should only trade with money you can afford to lose. Trading Forex and CFDs may not be suitable for all investors, so please ensure that you fully understand the risks involved and seek independent advice if necessary.
Disclaimer:
The above opinions given constitute general market commentary, and do not constitute the opinion or advice of IC Markets or any form of personal or investment advice.
Any opinions, news, research, analyses, prices, other information, or links to third-party sites contained on this website are provided on an "as-is" basis, are intended only to be informative, is not an advice nor a recommendation, nor research, or a record of our trading prices, or an offer of, or solicitation for a transaction in any financial instrument and thus should not be treated as such. The information provided does not involve any specific investment objectives, financial situation and needs of any specific person who may receive it. Please be aware, that past performance is not a reliable indicator of future performance and/or results. Past Performance or Forward-looking scenarios based upon the reasonable beliefs of the third-party provider are not a guarantee of future performance. Actual results may differ materially from those anticipated in forward-looking or past performance statements. IC Markets makes no representation or warranty and assumes no liability as to the accuracy or completeness of the information provided, nor any loss arising from any investment based on a recommendation, forecast or any information supplied by any third-party.

USD/JPY H1 | Overlap Resistance at 78.6% Fibonacci RetracementUSD/JPY is rising towards an overlap resistance and could potentially reverse off this level to drop lower.
Sell entry is at 143.88 which is an overlap resistance that aligns close to the 78.6% Fibonacci retracement.
Stop loss is at 144.55 which is a level that sits above the 50.0% Fibonacci retracement and a multi-swing-high resistance.
Take profit is at 143.02 which is a swing-low support.
High Risk Investment Warning
Trading Forex/CFDs on margin carries a high level of risk and may not be suitable for all investors. Leverage can work against you.
Stratos Markets Limited (tradu.com ):
CFDs are complex instruments and come with a high risk of losing money rapidly due to leverage. 63% of retail investor accounts lose money when trading CFDs with this provider. You should consider whether you understand how CFDs work and whether you can afford to take the high risk of losing your money.
Stratos Europe Ltd (tradu.com ):
CFDs are complex instruments and come with a high risk of losing money rapidly due to leverage. 63% of retail investor accounts lose money when trading CFDs with this provider. You should consider whether you understand how CFDs work and whether you can afford to take the high risk of losing your money.
Stratos Global LLC (tradu.com ):
Losses can exceed deposits.
Please be advised that the information presented on TradingView is provided to Tradu (‘Company’, ‘we’) by a third-party provider (‘TFA Global Pte Ltd’). Please be reminded that you are solely responsible for the trading decisions on your account. There is a very high degree of risk involved in trading. Any information and/or content is intended entirely for research, educational and informational purposes only and does not constitute investment or consultation advice or investment strategy. The information is not tailored to the investment needs of any specific person and therefore does not involve a consideration of any of the investment objectives, financial situation or needs of any viewer that may receive it. Kindly also note that past performance is not a reliable indicator of future results. Actual results may differ materially from those anticipated in forward-looking or past performance statements. We assume no liability as to the accuracy or completeness of any of the information and/or content provided herein and the Company cannot be held responsible for any omission, mistake nor for any loss or damage including without limitation to any loss of profit which may arise from reliance on any information supplied by TFA Global Pte Ltd.
The speaker(s) is neither an employee, agent nor representative of Tradu and is therefore acting independently. The opinions given are their own, constitute general market commentary, and do not constitute the opinion or advice of Tradu or any form of personal or investment advice. Tradu neither endorses nor guarantees offerings of third-party speakers, nor is Tradu responsible for the content, veracity or opinions of third-party speakers, presenters or participants.

USDJPY 05/06/2025Weekly:
-Bearish W pattern.
-Previous week high iqudity sweep.
Daily:
-H&S pattern.
-Natural W pattern.
4H:
-H&S pattern.
USDJPY is Nearing an Important ResistanceHey Traders, in today's trading session we are monitoring USDJPY for a selling opportunity around 143.700 zone, USDJPY is trading in a downtrend and currently is in a correction phase in which it is approaching the trend at 143.700 support and resistance area.
Trade safe, Joe.

USDJPY - Setting Up for a Potential LongAnalysis:
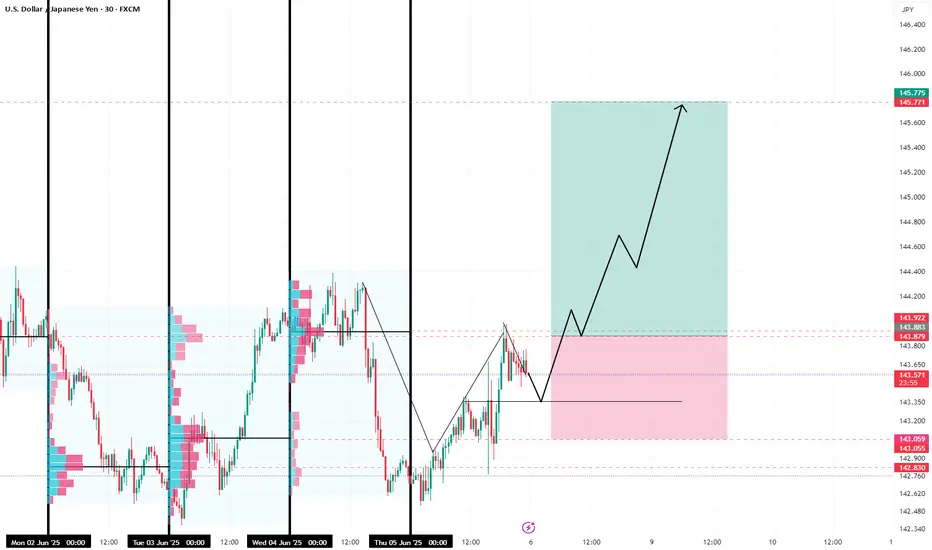
On the USDJPY 30-minute chart, we're observing price action that suggests a potential continuation of the bullish trend after a recent pullback. Applying "Smart Money Concepts" to our analysis, here's what we're seeing:
Previous Structure Break & Bullish Order Flow: Looking left, we can see that price has recently broken significant previous highs, indicating a shift towards a bullish market structure. The general order flow has been upwards, despite recent retracements.
Liquidity Sweep & Institutional Interest (Potential): The sharp move down on June 5th, while looking bearish to some, could be interpreted as a "liquidity sweep" or a "stop hunt" by larger players. This often happens to absorb sell-side liquidity before a significant move higher. Price then moved back into an area of interest.
"Fair Value Gap" / Imbalance Filling: Price has recently come back into (or is approaching) an area where there was a rapid move up, leaving behind what's often referred to as a "Fair Value Gap" or an "Imbalance." Smart money often revisits these areas to "fill" or "mitigate" these gaps before continuing the trend. This suggests that the current pullback might be a retest of such an area.
"Order Block" / Demand Zone: We've identified a potential "order block" or a strong demand zone (the highlighted pink box) where institutional buying pressure was likely present previously. Price is currently interacting with this zone, and we anticipate a reaction from here. This is an area where we would expect smart money to step back in and push price higher.
Trading Idea:
Entry: We're looking for confirmation of bullish momentum around the current price levels, ideally within or just above the identified demand zone (pink box). A clear break and retest of the immediate resistance at approximately 143.600 could provide a good entry.
Target: Our primary target is the previous swing high around 145.770, representing a potential expansion of the bullish trend.
Invalidation: Our invalidation level (stop loss) would be placed below the identified demand zone, specifically below 143.000. A break below this level would invalidate our bullish thesis and suggest a deeper retracement or a potential trend reversal.
In Summary:
We are anticipating a continuation of the bullish trend on USDJPY, predicated on the idea that the recent pullback was a liquidity sweep and a retest of a significant demand zone/order block. We're looking for price to respect this area and push towards new highs.
Disclaimer: This is for educational purposes only and not financial advice. Trade responsibly and manage your risk.
usd/jpy waiting for it to hit main levels for entry so just a check in for myself where its going to go

Sellers become active.1. **Price tapped into the 143.700–143.800 resistance zone**, just as expected.
2. **Strong bearish reaction followed immediately** after testing that zone:
* Long upper wick.
* A strong bearish candle closed under the previous bullish body → **rejection confirmed** ✅
3. Current candle is now **hovering around 143.600**, showing hesitation.
* This is **normal** after the initial rejection, and could form the **right shoulder** of a micro top structure.

#USDJPY SHORT Liquidity has been grabbed and new bullish manipulationhas been created, clear short in view

Market next move Disruption Points:
1. Bullish Accumulation Underway
The recent candles show higher lows and lower volume on red candles, suggesting selling pressure is decreasing.
> Disruptive scenario: Price may bounce off minor support (around 1.3560–1.3570) and form a higher low, triggering a bullish rally back above 1.3620.
---
2. Fake Bearish Setup (Liquidity Trap)
The three arrows predicting a drop might represent a classic retail trap where too many anticipate the same direction.
> Contrary idea: A false breakdown below 1.3550 may occur just to collect stop-losses, followed by a strong reversal upward.
---
3. Divergence Risk
If momentum indicators (e.g., RSI, MACD) show bullish divergence while price moves sideways or dips, it may signal an upcoming bullish impulse.
> Disruption: Downward arrows may be misinterpreting consolidation as weakness rather than a setup for continuation of the previous uptrend.
---
4. Fundamental Wildcard
The chart shows an upcoming U.S. economic event, likely to impact the dollar.
If the data is weak for the USD, GBP/USD could surge sharply, invalidating the bearish scenario.

USD/JPY Trapped in Consolidation QuagmireDuring the European session, the USD/JPY exchange rate oscillated around 143.10, extending the consolidation pattern triggered by the weak US dollar overnight. Influenced by the worse-than-expected US May ADP and ISM services data, the US Dollar Index fell to a six-week low of 98.60, and the USD/JPY rate also hit a low of 142.53. Subsequently, it rebounded slightly supported by the stable results of Japan's 30-year government bond auction and the decline in yields. Currently, the market is widely focused on the upcoming US May Non-Farm Payrolls (NFP) report and is reassessing the path of the Federal Reserve's monetary policy outlook.
Humans need to breathe, and perfect trading is like breathing—maintaining flexibility without needing to trade every market swing. The secret to profitable trading lies in implementing simple rules: repeating simple tasks consistently and enforcing them strictly over the long term.

UJ - LongsAnd here with the TRAPS indicator - you guys can see how the bears may gave gotten on the wrong side.
When these warning appear - you want to look for entries on the right side of the market and warning only.
