USD/JPY Robbery Route | Enter at Dip, Exit Before Police💥USD/JPY Forex Money Heist Plan 🎯 — Ninja Robbery at 146.000💥
🌟 Hi! Hola! Ola! Bonjour! Hallo! Marhaba! 🌟
Dear Market Bandits, Money Makers & Risky Robbers 🤑💰💸✈️
Welcome to another Thief Trader-style operation. We've cracked open the USD/JPY vault (aka "The Gopher" 💹), and here's the blueprint to pull off this forex heist like true professionals. 💼🎭💵
🚨 Strategy Overview
This isn't just a trade – it’s a well-researched, precision-timed robbery mission based on technicals, macro analysis, sentiment, and the bigger global picture.
Expect action near critical zones – especially the moving average barricade, where police (aka risk) is waiting. Stay sharp.
🔓 Entry Point – Unlock the Vault
📈 Watch for bullish pullbacks near 146.000.
Whether it's a dip, zone test, or wick bounce — you’re looking to layer buy limit orders like a seasoned thief using DCA tactics.
Enter on swings or any bullish confirmation.
Heist Window is Open.
🛑 Stop Loss – Escape Route
📍 SL near 143.000 (1D swing low) — adjust based on your capital and position size.
💡 Don’t go blind — SL is your backup plan, not an optional accessory.
Custom-fit it based on how many entries you’re stacking.
🎯 Target – Vault Exit Point
🏁 151.000 or exit before resistance heat catches on.
No greedy thieves here — precision exit is key.
Lock profits, vanish in style. 🕶️💼💸
🧲 Scalpers Take Note
Only long side raids are valid. Scalping against the trend? That's walking into a trap.
Use trailing SLs and protect your loot.
Small bag or big vault — play your game smart. 🎯💰
📢 Fundamental Boosters
USD/JPY’s bullish run isn’t random — it’s backed by:
📊 Macro shifts,
📈 COT reports,
🧠 Sentiment drivers,
📉 Intermarket trends,
And a whole mix of thief-level intel 🔍
🧭 Dive deeper before acting. The map’s been provided. 🔗🌍
🗞 News Traps Ahead – Move Cautiously
🚫 Avoid new trades during major releases
🔁 Use trailing SLs on open positions
💡 Position management is a thief’s best defense. Risk management keeps you in the game. 🎯🧠
🔥💖 Support the Heist Crew
Smash that ❤️🔥 Boost Button to keep our robbery engine running.
Each boost = strength for our crew.
💬 Share the love, spread the intel, and trade like a rogue with brains. 🤝💵
👀 Stay tuned for more high-profile FX heists from Thief Trader.
Until next time — loot wisely, vanish clean. 🐱👤💨
USDJPY trade ideas

USDJPY SELL LIMIT ENTRIES. week of 8/4/25 BEARISH USD BIASthis USDJPY SELL MODEL is exactly the opposite of the XXXUSD pairs.

USDJPY - on the way to somewhere...USDJPY has always had a reputation of a very "technical" instrument. Certainly it is not anymore.
Somewhat weird policy of the BOJ during pandemic changed a lot.
Now it creates something like THAS (two heads and shoulders :) or Modified Wyckoff Distribution pattern :)
Anyway, what I can see is the following:
- price respected the Support level at FR 61.8 of the uptrend impulse (Jan '23 - Jul '24) and reverted there three times
- Now is approaching the Resistance cluster in between 148.68 and 151.52. Perhaps it will respect it - but who knows?
Just my humble opinion

usdjpy buyGlobal equities rose on Thursday, with Japanese shares hitting a record high, as tech-led gains on Wall Street, upbeat earnings, growing hopes for a ceasefire in Ukraine and expectations for U.S. rate cuts boosted sentiment.

Bearish correcion move 15minbig bearish momentum, move a break of this low will confirm the drop. Price is currently making a corrective move upward within a broader bearish structure. The 15-minute chart shows lower highs and lower lows (LHLs), and the current push up is tapping into previous demand turned supply zones. Liquidity is being swept above minor highs, indicating a likely distribution phase before the next leg down.

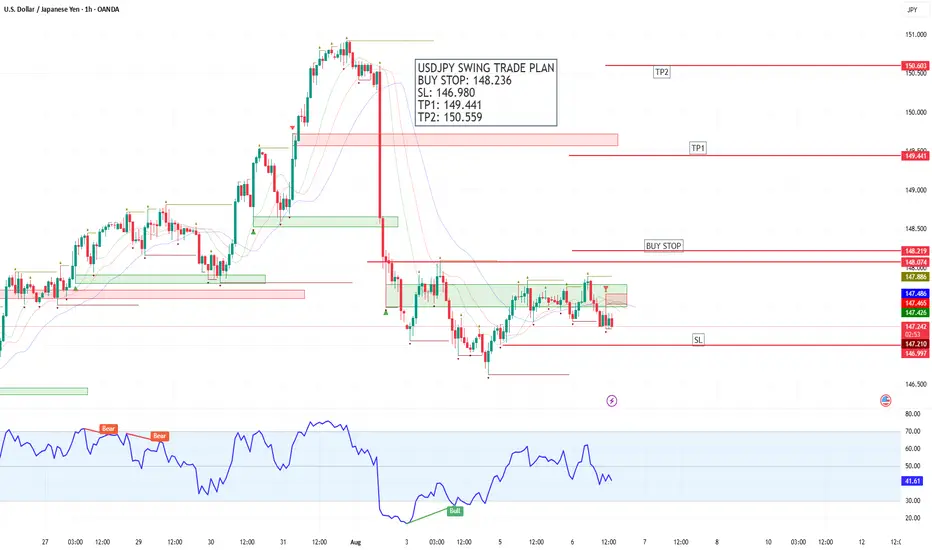
GBPJPY Trade Plan – 1H Chart Technical SetupA bullish breakout setup is forming on GBPJPY, presenting a potential swing trade opportunity:
🔹 Buy Stop: 197.122
🔹 Stop Loss (SL): 196.001
🔹 Take Profit 1 (TP1): 198.206
🔹 Take Profit 2 (TP2): 199.297
Price is consolidating just below the 197.122 resistance zone, which aligns with a supply area. A breakout above this could signal trend continuation, targeting the previous imbalance zones.
📉 The RSI is currently at 61, with recent bullish divergence, indicating strong buying momentum building up.
Key Points
Buy Zone: Marked above current range with entry upon breakout
TP1: Near previous order block and resistance rejection area
TP2: Approaching the next major supply zone
SL: Placed below the last valid demand zone for structure protection
🚨 Trade remains pending until price breaks and closes above 197.122. Risk-to-reward is favorable if confirmed.
💬 Wait for breakout confirmation — be patient, let the market come to you. Manage risk. Stay consistent. Trade smart!
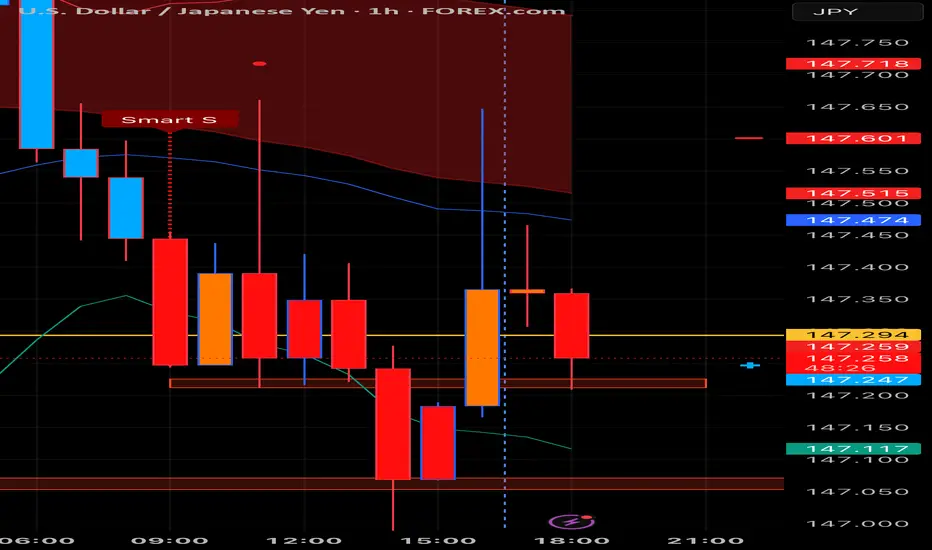
USDJPY: Long Trade Explained
USDJPY
- Classic bullish formation
- Our team expects growth
SUGGESTED TRADE:
Swing Trade
Buy USDJPY
Entry Level - 147.26
Sl - 147.12
Tp - 147.53
Our Risk - 1%
Start protection of your profits from lower levels
Disclosure: I am part of Trade Nation's Influencer program and receive a monthly fee for using their TradingView charts in my analysis.
❤️ Please, support our work with like & comment! ❤️

UsdjpyUsd weak against jpy
As you see bearish momentum is started and we can see gold also rising so
As per my analysis usfjpy should fall it to next support level that is 141.07

USDJPY resistance at 148.90The USDJPY pair is currently trading with a bearish bias, aligned with the broader downward trend. Recent price action shows a retest of the falling resistance, suggesting a temporary relief rally within the downtrend.
Key resistance is located at 148.90, a prior consolidation zone. This level will be critical in determining the next directional move.
A bearish rejection from 148.90 could confirm the resumption of the downtrend, targeting the next support levels at 146.10, followed by 145.40 and 144.60 over a longer timeframe.
Conversely, a decisive breakout and daily close above 148.90 would invalidate the current bearish setup, shifting sentiment to bullish and potentially triggering a move towards 149.75, then 150.20.
Conclusion:
The short-term outlook remains bearish unless the pair breaks and holds above 148.90. Traders should watch for price action signals around this key level to confirm direction. A rejection favours fresh downside continuation, while a breakout signals a potential trend reversal or deeper correction.
This communication is for informational purposes only and should not be viewed as any form of recommendation as to a particular course of action or as investment advice. It is not intended as an offer or solicitation for the purchase or sale of any financial instrument or as an official confirmation of any transaction. Opinions, estimates and assumptions expressed herein are made as of the date of this communication and are subject to change without notice. This communication has been prepared based upon information, including market prices, data and other information, believed to be reliable; however, Trade Nation does not warrant its completeness or accuracy. All market prices and market data contained in or attached to this communication are indicative and subject to change without notice.

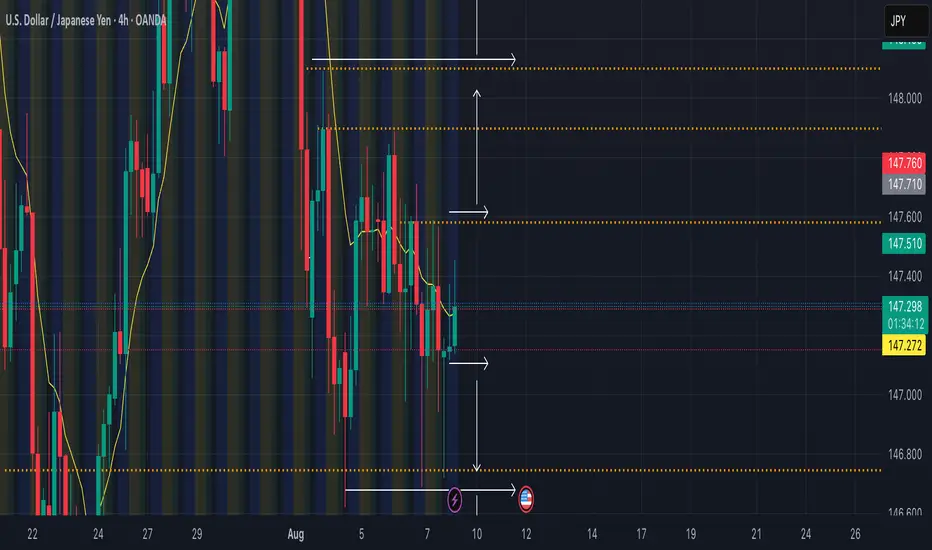
USDJPY – DAILY FORECAST Q3 | W32 | D6 | Y25📊 USDJPY – DAILY FORECAST
Q3 | W32 | D6 | Y25
Daily Forecast 🔍📅
Here’s a short diagnosis of the current chart setup 🧠📈
Higher time frame order blocks have been identified — these are our patient points of interest 🎯🧭.
It’s crucial to wait for a confirmed break of structure 🧱✅ before forming a directional bias.
This keeps us disciplined and aligned with what price action is truly telling us.
📈 Risk Management Protocols
🔑 Core principles:
Max 1% risk per trade
Only execute at pre-identified levels
Use alerts, not emotion
Stick to your RR plan — minimum 1:2
🧠 You’re not paid for how many trades you take, you’re paid for how well you manage risk.
🧠 Weekly FRGNT Insight
"Trade what the market gives, not what your ego wants."
Stay mechanical. Stay focused. Let the probabilities work.
FX:USDJPY

USDJPY - What do you think?- In the monthly (higher timeframes), USDJPY is bullish.
- In the weekly timeframe, USDDJPY is bullish with a clear BOS and a retest.
- In the daily timeframe, it is also in a clear uptrend.
- As convincing as it is to keep our focus on the current bullish price reaction, patience tells us otherwise to wait it out lower below the 1d validation and its preceding price structures.
- We are risking 19 Pips on this trade for a potential 1:30.
USD/JPY 1D CHART PATTERNThe USDJPY chart shows a clear bullish breakout from a long-term descending trendline, signaling a potential shift in momentum. The pair has formed higher lows, marked by multiple rejections near the ascending support trendline, confirming strong buying interest. Price has successfully broken through a key resistance zone, turning it into support, with Ichimoku cloud indicators supporting the upward movement. A bullish continuation is expected as the price maintains strength above the breakout zone. The recent breakout candle and upward arrow suggest bullish sentiment and room for further upside, aligning with the overall trend reversal pattern visible on the chart.
Entry Buy: 148.570
Target point: 151.500
If you found this analysis helpful, don’t forget to drop a like and comment . Your support keeps quality ideas flowing—let’s grow and win together! 💪📈

USDJPY InsightHello to all our subscribers.
Please share your personal opinions in the comments. Don’t forget to like and subscribe.
Key Points
- CNBC reported that President Trump signed an executive order to extend the “tariff truce” with China for 90 days, with the new deadline set for November 9.
- On the 13th, European leaders and Ukrainian President Zelensky are scheduled to hold a virtual meeting with U.S. President Trump. Ahead of this, President Zelensky said, “Russia, which refuses to stop the killing, must not receive any compensation or benefits,” while EU High Representative for Foreign Affairs and Security Policy Kaja Kallas stated, “Unless Russia agrees to a complete and unconditional ceasefire, we must not even discuss any concessions.”
- The U.S. core CPI for July, to be released on the 12th, is expected to rise by 0.3% month-on-month. If the figure exceeds this forecast, the possibility of a Fed rate cut in September is expected to diminish.
Major Economic Events This Week
+ Aug 12: U.S. July Consumer Price Index
+ Aug 13: Germany July Consumer Price Index
+ Aug 14: U.K. Q2 GDP, U.S. July Producer Price Index
+ Aug 15: U.S. July Retail Sales
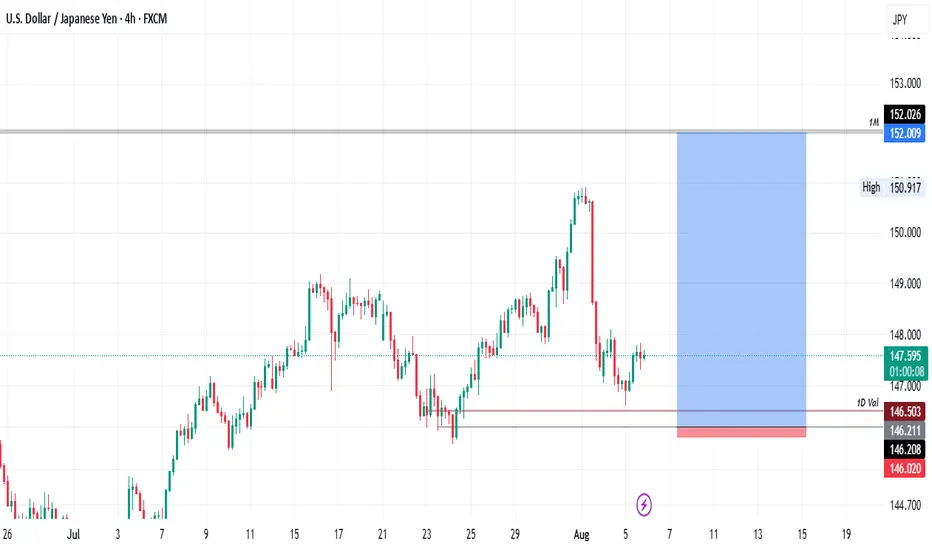
USDJPY Chart Analysis
Support is confirmed at the 147 level, and as predicted last week, an increase toward the 151 level is expected. If the 151 level is successfully breached, further gains toward 154 are anticipated. However, if the pair faces resistance at 151 and turns lower, it could retreat to the 144 level.

USDJPY I’m expecting more upside on this since we’ve broken structure, and also created a shift to the upside

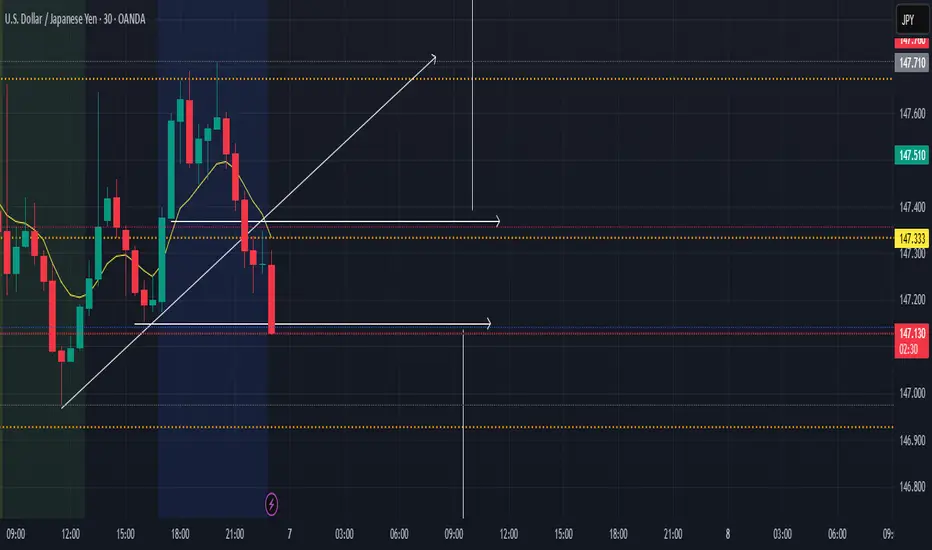
Trade Idea: Aug 8 - London - Range breakHTF: 4H shows that the lower lower formation has changed with the last low being a higher low in the choppy downtrend.
MTF: 30m - Identified key levels of liquidity and aiming for a break above/below those key areas.
ETF: 5m - I am thinking the low will either be taken out and so I will target there or if there is a break of structure, aiming for a long trend.
trade idea: aug 7 london session - both directions/consolidationif within 1.5 hrs no trade signal is present, ignore this session
htf: daily/4hr - consolidating
mtf 30m - marked key levels
etf: 5min enter on breake of structure
Trade Idea: Aug 5 - USDJPY - 1HR/5M - SHORTHTF: 1HR looks like downtrend
MTF: 30m identified support levels to be broken
ETF: 5min enter on break of the 1st support level

USDJPYThis is a high probability in my eyes to run higher if im being honest. Im long on this pair are you?

USDJPY - Now or Never!Hello TradingView Family / Fellow Traders. This is Richard, also known as theSignalyst.
📈USDJPY has been overall bullish trading within the rising channel marked in blue and it is currently retesting the upper bound of the channel acting as an over-bought zone.
Moreover, the green zone is a strong weekly resistance.
📚 As per my trading style:
As #USDJPY is around the red circle zone, I will be looking for bearish reversal setups (like a double top pattern, trendline break , and so on...)
📚 Always follow your trading plan regarding entry, risk management, and trade management.
Good luck!
All Strategies Are Good; If Managed Properly!
~Rich
Disclosure: I am part of Trade Nation's Influencer program and receive a monthly fee for using their TradingView charts in my analysis.

USDJPY key trading level at 148.90The USDJPY pair is currently trading with a bearish bias, aligned with the broader downward trend. Recent price action shows a retest of the falling resistance, suggesting a temporary relief rally within the downtrend.
Key resistance is located at 148.90, a prior consolidation zone. This level will be critical in determining the next directional move.
A bearish rejection from 148.90 could confirm the resumption of the downtrend, targeting the next support levels at 146.10, followed by 145.40 and 144.60 over a longer timeframe.
Conversely, a decisive breakout and daily close above 148.90 would invalidate the current bearish setup, shifting sentiment to bullish and potentially triggering a move towards 149.75, then 150.20.
Conclusion:
The short-term outlook remains bearish unless the pair breaks and holds above 148.90. Traders should watch for price action signals around this key level to confirm direction. A rejection favours fresh downside continuation, while a breakout signals a potential trend reversal or deeper correction.
This communication is for informational purposes only and should not be viewed as any form of recommendation as to a particular course of action or as investment advice. It is not intended as an offer or solicitation for the purchase or sale of any financial instrument or as an official confirmation of any transaction. Opinions, estimates and assumptions expressed herein are made as of the date of this communication and are subject to change without notice. This communication has been prepared based upon information, including market prices, data and other information, believed to be reliable; however, Trade Nation does not warrant its completeness or accuracy. All market prices and market data contained in or attached to this communication are indicative and subject to change without notice.


USDJPY – DAILY FORECAST Q3 | W32 | D5 | Y25📊 USDJPY – DAILY FORECAST
Q3 | W32 | D5 | Y25
Daily Forecast 🔍📅
Here’s a short diagnosis of the current chart setup 🧠📈
Higher time frame order blocks have been identified — these are our patient points of interest 🎯🧭.
It’s crucial to wait for a confirmed break of structure 🧱✅ before forming a directional bias.
This keeps us disciplined and aligned with what price action is truly telling us.
📈 Risk Management Protocols
🔑 Core principles:
Max 1% risk per trade
Only execute at pre-identified levels
Use alerts, not emotion
Stick to your RR plan — minimum 1:2
🧠 You’re not paid for how many trades you take, you’re paid for how well you manage risk.
🧠 Weekly FRGNT Insight
"Trade what the market gives, not what your ego wants."
Stay mechanical. Stay focused. Let the probabilities work.
FX:USDJPY
