Dollar to Weaken Against Yen Over Next 6 MonthsUSD/JPY is showing signs of a potential downtrend after failing to break above key resistance at 152.00. The pair has formed a double-top pattern on the weekly chart, with RSI divergence signaling weakening bullish momentum. A break below 150.00 could accelerate losses toward 145.00 (200-day MA) and possibly 140.00 over the next 6 months.
The US dollar may weaken as the Fed is expected to start cutting rates in late 2024/early 2025, while the BoJ could cautiously tighten policy if wage growth persists. Narrowing US-Japan yield differentials (10-year yields) would reduce JPY carry-trade appeal, supporting yen strength. MoF’s verbal warnings and past interventions near 152.00 suggest strong resistance to further yen weakness.
Sasha Charkhchian
USDJPY trade ideas

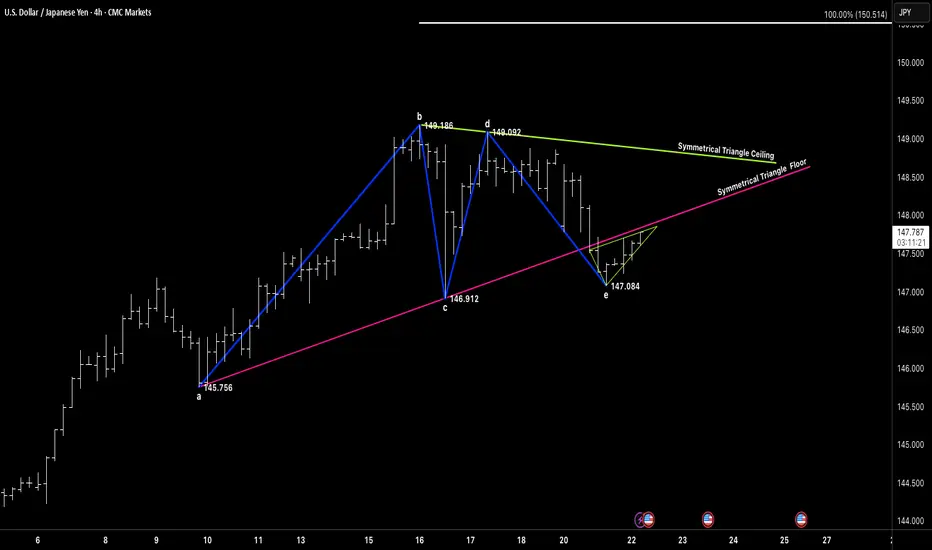
SYMMETRICAL TRIANGLEGood morning and good afternoon traders, wherever you're dialed in from.
Hope y’all are stacking those pips this week — whether you’re trend-riding, countering swings, or just sitting back letting setups come to you. 🔍
We’ve been hitting precise targets lately, and the tape’s been speaking loud and clear. Doesn’t matter what the sentiment says — we follow price, we follow structure.
Right now, we’ve got a clean symmetrical triangle unfolding on USDJPY (4H). Marked up from point a to e, with that little fakeout dip at E (147.084) acting like a trap for the impatient. Textbook spring behavior.
What catches my eye is the way price is coiling tight between the triangle’s ceiling and rising floor. We’re hovering just under 147.80, and a decisive push through that ceiling could unlock a sharp move toward the 150.50 zone (symmetrical projection).
If you missed the earlier leg, don’t chase — let price show you real intent. A confirmed breakout above 148.00 is the trigger. If we break back below 146.90, reassess.
No need to guess — we observe, we react. Let the market come to us.
“We don’t force trades. We trade when the market invites us.”
USDJPY TREND REVERSAL TRADELooking at 4h chart, our short term bearish channel has been broken indicating a possible reversal. Waiting for this sell setup to trigger. Let me know your thoughts.

USDJPY Sell Trade from the ResistanceUJ is at 1H Resistance we can sell correction move towards sell side.
Sentiments are for sell side so in bigger time it can break that zone but we can plan a instraday trade.


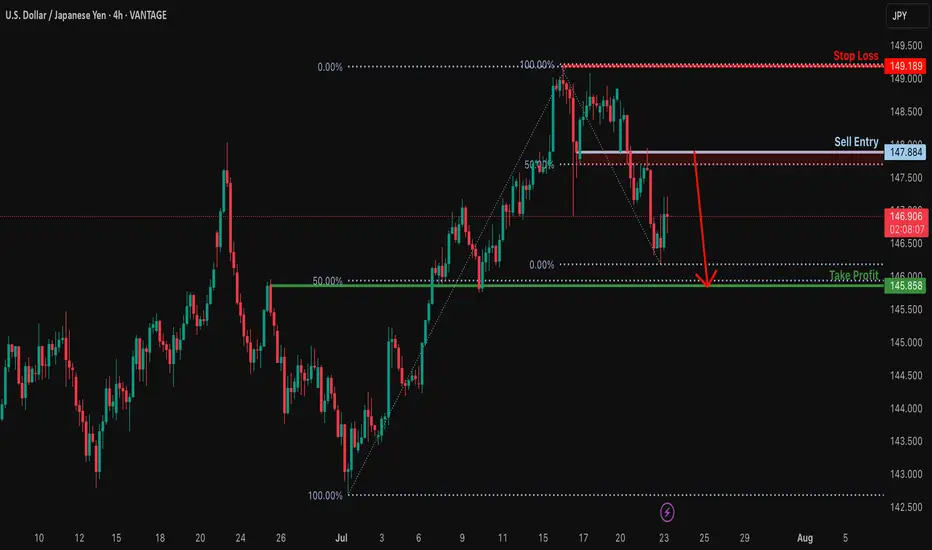
Bearish reversal off overlap resistance?USD/JPY is rising towards the resistance level which is an overlap resitance that is slightly above the 50% Fibonacci retracement and could reverse from this level to our take profit.
Entry: 147.88
Why we like it:
There is an overlap resistance that is slight.y above the 50% Fibonacci retracement.
Stop loss: 149.18
Why we like it:
There is a swing high resistance.
Take profit: 145.85
Why we like it:
There is an overlap support that lines up with the 50% Fibonacci retracement.
Enjoying your TradingView experience? Review us!
Please be advised that the information presented on TradingView is provided to Vantage (‘Vantage Global Limited’, ‘we’) by a third-party provider (‘Everest Fortune Group’). Please be reminded that you are solely responsible for the trading decisions on your account. There is a very high degree of risk involved in trading. Any information and/or content is intended entirely for research, educational and informational purposes only and does not constitute investment or consultation advice or investment strategy. The information is not tailored to the investment needs of any specific person and therefore does not involve a consideration of any of the investment objectives, financial situation or needs of any viewer that may receive it. Kindly also note that past performance is not a reliable indicator of future results. Actual results may differ materially from those anticipated in forward-looking or past performance statements. We assume no liability as to the accuracy or completeness of any of the information and/or content provided herein and the Company cannot be held responsible for any omission, mistake nor for any loss or damage including without limitation to any loss of profit which may arise from reliance on any information supplied by Everest Fortune Group.
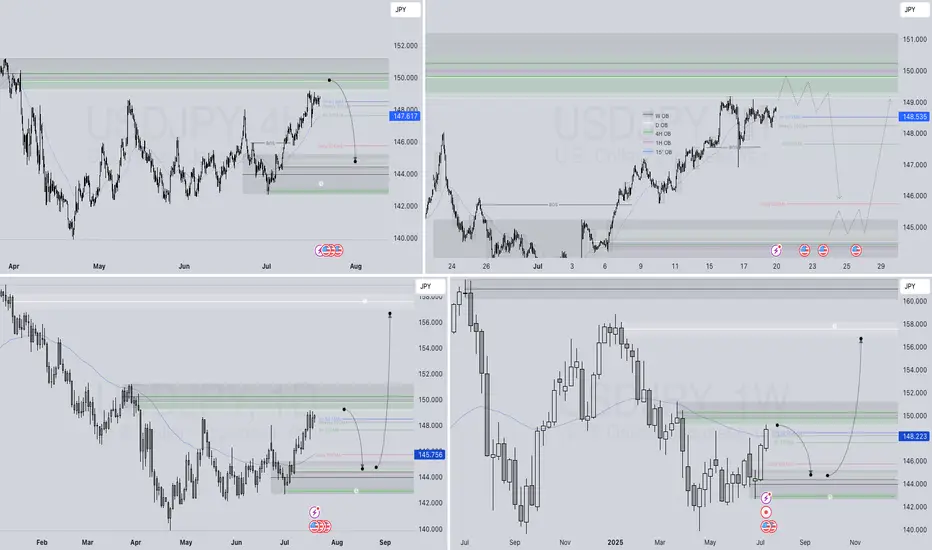
USDJPY / U.S. Dollar – Japanese Yen (1D + 1H) – Multi-Timeframe USDJPY / U.S. Dollar – Japanese Yen (1D + 1H) – Multi-Timeframe Breakdown
Hello awesome traders! 👋
Closing the week with a full top-down look at USDJPY. We’ve got a macro bullish setup developing, but Friday gave us a well-structured intraday bearish opportunity worth studying. Let’s walk through the levels across the timeframes:
🧭 Macro Structure (Daily / 4H)
We start with a textbook Cypher formation on the macro frame, overlapping with a broad ABC bullish correction:
🔹 XA and BC legs are clean and proportionate
🔹 The D point completes just above the 78.6% XA zone
🔹 ABC structure suggests price may be completing a corrective leg within the larger bullish swing
🔍 Medium-Term Focus (4H): Zoom Into the ABC
As we zoom into the ABC leg:
🔸 A = 146.82
🔸 B = 149.08
🔸 C forms near 148.20 with shallow retracement
🔸 Completion shows signs of exhaustion
The ABC pullback aligns with prior resistance and fib confluence zones.
⏱ Intraday Breakdown (1H): Symmetry, Traps, and False Breakouts
This is where the intraday bearish case built up:
🔻 1. Symmetrical Triangle Breakdown
Price formed a clear compression triangle → broke lower → retested → failed again.
🔻 2. Double Top Structure + Cypher Trap
We had a false breakout above 149.08, followed by a rejection. This matches the Cypher reversal zone and classic trap behavior.
🎯 Friday Outlook
✅ Bias: Bearish
📍 Target 1: 38.2% = 148.21
📍 Target 2: 61.8–78.6% = 147.67 – 147.29
We're looking for price to rotate back into these fib support zones before macro structure takes back control. No bullish commitment unless we reclaim the 149.08 highs with strength.
🛡 Risk Management Note
This is short-term momentum inside a larger bullish frame. Treat intraday shorts with tight stops. Macro buyers may step in at the fib wall.
🗝 Final Thoughts
This is the perfect example of why multi-timeframe context matters.
Macro is prepping for a possible long-term continuation, but Friday’s lower timeframe offered an opportunistic short from structure, symmetry, and failed breakout traps.
“The market breathes in waves — one time frame exhales while the other prepares to inhale.”


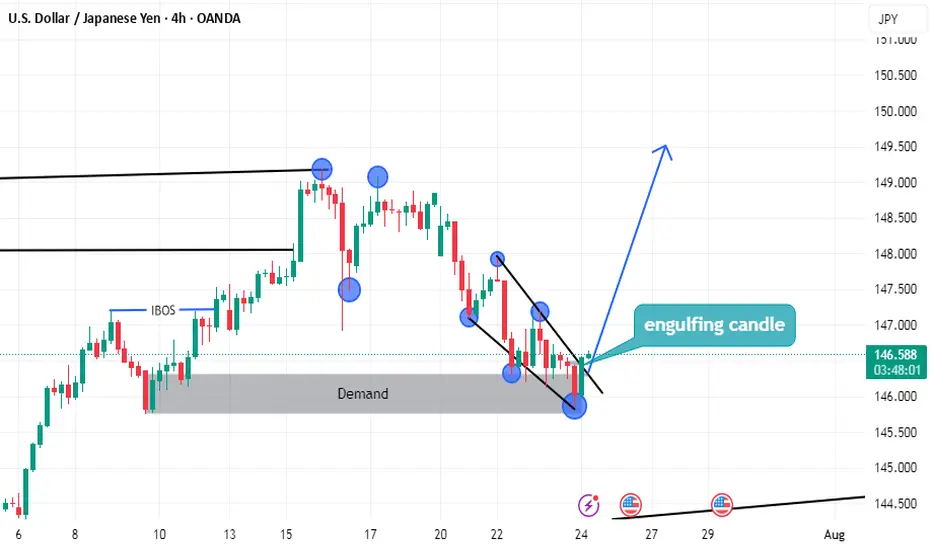
USDJPY LONG setupsimply
we have demand
and the price can't lower low
end we have break of structure on low time frame
and we have more but i don't have enough time to tell you
Look the photo well
USDJPY Technical Analysis – Key Support Zone in Focus!USDJPY Technical Analysis – Key Support Zone in Focus!
As shown in the chart, USDJPY has broken out of its long-term trendline and is now trading within a rising channel structure. Currently, the price is sitting near a crucial support zone at 145.190, which could play a decisive role in the pair’s next move.
🔹 If this support holds, we may see a bullish continuation towards the following key resistance levels:
First target: 151.110
Next target: 160.100 (upper bound of the channel)
🔻 However, if the 145.190 support fails, the price could decline toward the bottom of the rising channel, with the next major support near:
136.000
📌 This area is critical for swing and position traders. Price action in this zone will likely provide strong signals for entry or exit.
📊 Follow for more real-time analysis and trading insights!

USD/JPY – Bearish Rejection After Channel BreakUSD/JPY – Bearish Rejection After Channel Break
🔹 2H Chart Analysis by PULSETRADESFX
USD/JPY has broken down from a rising channel and is now rejecting a key supply zone around 147.000 – 147.250. The pair is showing early signs of bearish continuation after retesting this zone as resistance.
This setup favors short positions targeting deeper levels, especially with price failing to reclaim the broken structure.
📌 Trade Setup:
Entry: 146.808
Stop Loss: 147.350 (Above supply zone)
TP1: 146.000 (Recent low)
TP2: 145.250 (Demand support)
TP3: 144.300 (Major structural zone)
This is a clean break–retest–continuation scenario with risk-to-reward aligning well for short-term and swing traders.
✅ Bearish Confluences:
Rising channel break
Supply zone rejection
Lower high structure
Bearish engulfing reaction
TP levels mapped to recent price memory zones
📅 July 23, 2025
📊 CMC Markets Feed | USD/JPY (2H)
#USDJPY #ForexAnalysis #BearishBreakdown #TechnicalSetup #PriceAction #TradingView #PULSETRADESFX

USDJPY Correction Complete, Is the Bullish Trend Back in play?After pulling back from the recent high near 149.17, USDJPY has shown signs of strength again, rebounding off the confluence support at the ascending trendline. The bullish narrative is supported by a hawkish FOMC tone and news that a U.S. federal court temporarily blocked Trump-era tariffs. The pair now awaits upcoming U.S. economic data for further directional clarity.
🔍 Technical Outlook – Structure & Momentum
✅ Primary trend: Bullish
✅ Correction phase: Completed near CP zone and trendline
✅ Key structural areas: FVG Zone, CP Zone, and trendline remain intact
Price has responded positively from the CP Zone + OBS Buy Zone around 147.438, aligning with the uptrend line. As long as this structure holds, buyers may push the market toward the next resistance zones.
🧭 Trade Scenarios
🔸 Bullish Bias (preferred scenario):
As long as price holds above 147.438, we expect continuation toward the FVG zone, with immediate targets at the GAP + OBS Sell Zone (148.703) and extended potential to the Buy-side Liquidity zone at 149.122.
A clean breakout above 149.122 opens the door to Fibonacci extensions: 149.72 and 150.05.
🔹 Bearish Scenario (if invalidated):
If price breaks below 147.438 and loses the trendline, we may see a deeper drop toward the Liquidity Buy Zone at 146.825, where strong buying interest is expected to re-enter the market.
⚠️ Macro Risk Drivers
Hawkish FOMC minutes continue to support USD strength
Paused trade tariffs reduce political headwinds, improving risk sentiment
Upcoming U.S. economic data could trigger sharp intraday moves → watch closely
📌 Key Price Zones
Liquidity Buy Zone 146.825 Major long re-entry zone
CP + OBS Buy Zone 147.438 Current active support
FVG Zone 148.20 – 148.68 Intraday bullish target
GAP + OBS Sell Zone 148.703 Short-term resistance
Buy-side Liquidity Zone 149.122 Final bullish objective
💬 Structure remains bullish unless the trendline breaks. Stay patient, wait for confirmations at key zones, and follow your plan with disciplined risk management.

Bullish bounce off major support?USD/JPY is falling towards the pivot, which acts as an overlap support and could bounce to the 1st resistance, which is a swing high resistance.
Pivot: 145.96
1st Support: 144.98
1st Resistance: 149.18
Risk Warning:
Trading Forex and CFDs carries a high level of risk to your capital and you should only trade with money you can afford to lose. Trading Forex and CFDs may not be suitable for all investors, so please ensure that you fully understand the risks involved and seek independent advice if necessary.
Disclaimer:
The above opinions given constitute general market commentary, and do not constitute the opinion or advice of IC Markets or any form of personal or investment advice.
Any opinions, news, research, analyses, prices, other information, or links to third-party sites contained on this website are provided on an "as-is" basis, are intended only to be informative, is not an advice nor a recommendation, nor research, or a record of our trading prices, or an offer of, or solicitation for a transaction in any financial instrument and thus should not be treated as such. The information provided does not involve any specific investment objectives, financial situation and needs of any specific person who may receive it. Please be aware, that past performance is not a reliable indicator of future performance and/or results. Past Performance or Forward-looking scenarios based upon the reasonable beliefs of the third-party provider are not a guarantee of future performance. Actual results may differ materially from those anticipated in forward-looking or past performance statements. IC Markets makes no representation or warranty and assumes no liability as to the accuracy or completeness of the information provided, nor any loss arising from any investment based on a recommendation, forecast or any information supplied by any third-party.

**New Buy Signal – USD/JPY** (Recovery Plan)* You **can enter now** or set a **pending buy at 146.400** if price pulls back slightly.

USD/JPY PROBABLY !Waiting for confirmation on candles and Real Volume 5min or 15min (power of Real Volume)-without real volume I am like a blind man in a dense forest :)
Tools:
- real volume (proper interpretation)
- Fibonacci expansion ABC (an additional, new goal every day)
- Fibonacci retracement (combined with the real volume, it shows me the real probable movement for the next hours and days)
- volume support and resistance levels (confirmation of the price recovery level)
- oversold/overbought index (focusing on 1H and 4H something is already overvalued or undervalued)
- candlestick patterns (my entry point for 5 minutes or 15 minutes candlestick formations confirmed by particularly increasing volume).

Retracement then bearsish.Waitn for my setup, potential hns, retrace to the area of my interest. And down down.
hi everyone im away from the desk but we are still waiting for that short area of 147.590 on the short term trade. long term short trade still waiting for that daily FVG / BOS zone of the 4hr. will share chart set up once back. happy trading everyone
refer to video as its showing all the information im looking at on a day to day
9
0 comments
Leave a comment that is helpful or encouraging. Let's master the markets together
Post

USD_JPY STRONG UPTREND|LONG|
✅USD_JPY is in a strong
Long-term uptrend now
And the pair is accumulating
For the next leg up so we will
Be expecting a bullish continuation
On Monday!
LONG🚀
✅Like and subscribe to never miss a new idea!✅
Disclosure: I am part of Trade Nation's Influencer program and receive a monthly fee for using their TradingView charts in my analysis.

USDJPY – WEEKLY FORECAST Q3 | W30 | Y25📊 USDJPY – WEEKLY FORECAST
Q3 | W30 | Y25
Weekly Forecast 🔍📅
Here’s a short diagnosis of the current chart setup 🧠📈
Higher time frame order blocks have been identified — these are our patient points of interest 🎯🧭.
It’s crucial to wait for a confirmed break of structure 🧱✅ before forming a directional bias.
This keeps us disciplined and aligned with what price action is truly telling us.
📈 Risk Management Protocols
🔑 Core principles:
Max 1% risk per trade
Only execute at pre-identified levels
Use alerts, not emotion
Stick to your RR plan — minimum 1:2
🧠 You’re not paid for how many trades you take, you’re paid for how well you manage risk.
🧠 Weekly FRGNT Insight
"Trade what the market gives, not what your ego wants."
Stay mechanical. Stay focused. Let the probabilities work.
FRGNT FOREX ANALYSIS 📊
USD/JPY Bearish Setup Activated - Short from 148.00 Zone!💙 USD/JPY Resistance Rejection ! SELL Setup Activated!
👩💻 Dear traders,
USD/JPY is reacting to a strong supply zone between 147.85 – 148.15. After a sharp bullish move, price is showing early signs of rejection from this area — signaling a possible short setup.
Bias – Bearish
🎯 Target – 147.20
🎯 Target – 146.90
🎯 Final Target – 146.30
🛑 Safe Stop Loss – 148.20
📊 Reasoning:
– Price tapped into a clear resistance zone
– Previous rejections seen around the same level
– Two yellow arrows indicate short-term downside path
– Bearish setup forming after exhaustion push
– High R:R potential for intraday traders
🍀 Stay patient, wait for confirmation, and trade the reaction!

USDJPY Q3 | D24 | W30 | Y25 VIDEO EXPLANATION 📊USDJPY Q3 | D24 | W30 | Y25
Daily Forecast🔍📅
Here’s a short diagnosis of the current chart setup 🧠📈
Higher time frame order blocks have been identified — these are our patient points of interest 🎯🧭.
It’s crucial to wait for a confirmed break of structure 🧱✅ before forming a directional bias.
This keeps us disciplined and aligned with what price action is truly telling us.
📈 Risk Management Protocols
🔑 Core principles:
Max 1% risk per trade
Only execute at pre-identified levels
Use alerts, not emotion
Stick to your RR plan — minimum 1:2
🧠 You’re not paid for how many trades you take, you’re paid for how well you manage risk.
🧠 Weekly FRGNT Insight
"Trade what the market gives, not what your ego wants."
Stay mechanical. Stay focused. Let the probabilities work.
FRGNT

USDJPY LTF Triangle being formedUSDJPY is going down in all TF's
We want to see a SELL position.
On the 15M, we see a Triangle being formed.
If it breaks below, we want to enter into a SELL position.

USDJPY| - Bullish Setup Loading30M price action remains heavy to the upside. Structure is intact — no lows invalidated. Currently sitting on a refined 30M order block, I’m patiently watching for price to dip back into the zone and sweep short-term liquidity (SSL).
Once that sweep happens and we pull back into the OB, I’ll be looking to ride the bullish momentum:
🎯 First target: 5M highs
🚀 Final target: 30M highs
Feeling confident — just waiting on smart money to confirm it’s time.

USDJPY Will Go Lower From Resistance! Sell!
Please, check our technical outlook for USDJPY.
Time Frame: 45m
Current Trend: Bearish
Sentiment: Overbought (based on 7-period RSI)
Forecast: Bearish
The market is approaching a significant resistance area 145.971.
Due to the fact that we see a positive bearish reaction from the underlined area, I strongly believe that sellers will manage to push the price all the way down to 145.357 level.
P.S
Overbought describes a period of time where there has been a significant and consistent upward move in price over a period of time without much pullback.
Disclosure: I am part of Trade Nation's Influencer program and receive a monthly fee for using their TradingView charts in my analysis.
Like and subscribe and comment my ideas if you enjoy them!
