The Mexican Peso is set to explode The USDMXN is trading low and touching a big support around 19.4. Both the Williams %R and the Bollinger Band Percent (BB %B) are trading at the low part, indicating a potential buy zone. I see a possible return to at least 19.7 pesos per Dollar in the short term. Overall, I'm of the idea that the Mexican Peso is going to lose value eventually, as other currencies are doing, it is just a matter of time before the explosion takes place.
USDMXN trade ideas

USDMXN is breaking the supportsUSDMXN remains bearish and it’s now in a sharp intraday decline aboutwe have been warning about in the past. We see pair now breaking the trendline support and its falling below the important 19.70 level. This may cause more more weakness as a higher degree bearish triangle can come to an end. In fact, MXN has been one of the strongest even when USD was up vs GBP, AUD and NOK. So if these are ready to gain, or at least make a pullback, then we think that USDMXN can easily come much lower. Check where USDMXN is despite DXY bull run in the last 12 months.
A bearish HS pattern also signals for more weakness on USDMXN.
Grega

USDMXN Long This looks to be one of those very "safe" plays on the USDMXN this pair has been a consistent money maker on the long side over the past 3years I have been trading. The ADX is in the lower ranges (Indicating that it is not trending), approaching one of 2 very strong supports and the RSI looking good. Look to enter the market at your own discretion but in my opinion, tends to move very quickly to the upside so have a buy level you are comfortable with. I only buy this pair I never sell it because the timing is always tricky on that one. Macro economic: dollar is still strong but I would also look at the VIX as an indication of when to press the go button as these two are more correlated than not.

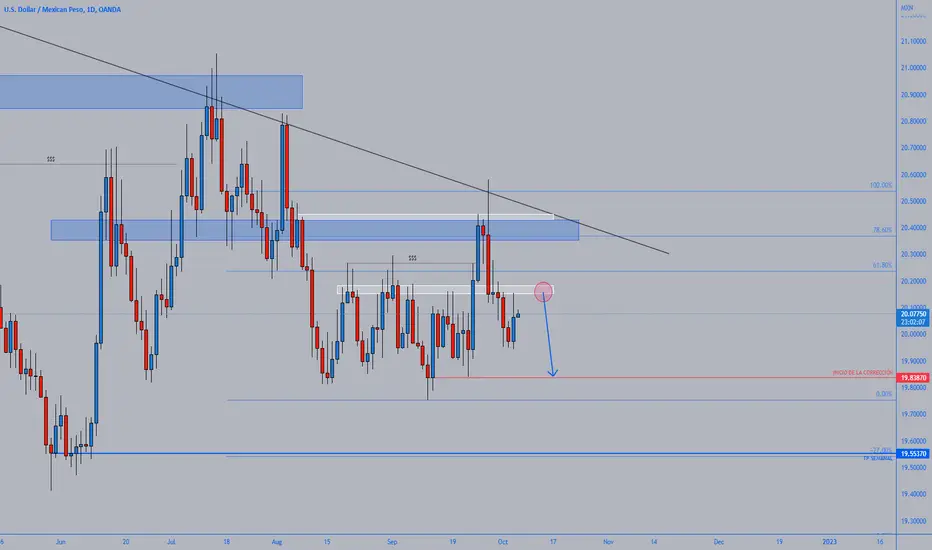
Sell ideaH4 and H1 charts imply breakouts to the downside.
Please also mind RSI structures supporting the next move down.
On H4 the triangle may be larger than shown on the chart, at this point of time it is imho irrelevant.
Trade safe

USDMXN Confirming our long-term pattern. Strong Buy now!The USDMXN pair largely confirmed our last buy signal almost 2 months ago as after it hit its first Support level, it rebounded aggressively to its Lower Highs trend-lines, as shown on the chart below:
We made this accurate projection based on the similarities with the April - June 2021 fractal. The correlation continues to hold as the price is now trading sideways near the Support level, having broken last Friday below its 1D MA50 (blue trend-line). As per the 2021 sequence, we can expect another month (roughly) of neutral/ sideways price action below the 1D MA200 (green trend-line), before the next strong rebound towards the Lower Highs trend-lines. Technically, this is another solid medium-term buy opportunity.
-------------------------------------------------------------------------------
** Please LIKE 👍, SUBSCRIBE ✅, SHARE 🙌 and COMMENT ✍ if you enjoy this idea! Also share your ideas and charts in the comments section below! This is best way to keep it relevant, support me, keep the content here free and allow the idea to reach as many people as possible. **
-------------------------------------------------------------------------------
You may also TELL ME 🙋♀️🙋♂️ in the comments section which symbol you want me to analyze next and on which time-frame. The one with the most posts will be published tomorrow! 👏🎁
-------------------------------------------------------------------------------
👇 👇 👇 👇 👇 👇
💸💸💸💸💸💸
👇 👇 👇 👇 👇 👇

USDMXN on supporti don't see this pair going down too much from here, a good time to buy and wait to hit at least 20.00 to get out

USDMXN good R:R long tradeInsight:
- Central Bank of Mexico said that they will need to stray from Fed soon.
- Fed stay on aggressive hike

USDMXN | BUYING ZONEUSDMXN has once again approached to horizontal support level where bulls once again can show some momentum.
We need bullish candle on the support to go for long.
while break below support zone will be all over for bulls.
Trade your levels accordingly.

Anyone Noticed How Strong The MXN Is?Has anyone noticed how strong the $MXN is?
USD/MXN has hardly moved in the past few months, despite the $USD ripping higher since May.

USDMXN LONG - BIG BULLISH SWING!Waiting for another retest of 19.96417 to long USDMXN back to the 4H Target at 20.21895
If you agree drop alike and if you have any questions drop a comment :)

ShortLarge running flat and a confirmation.
Stop loss tight, just above the h1 flag
May drop hard
Trade safe

USDMXN 05/10/2022Weekly:
-H&S pattern.
-Bearish W pattern.
-IC.
Daily:
-H&S pattern.
-Bearish W pattern.
-IC.
4H:
-Bearish W pattern.
USDMXN LONG Looking at the Weekly and 4hour timeframes, the dollar Mexican peso continues to soar gradually and we should get a retest of the most previous supply at 20.50- 20.56 zone, which is our projected target before we get any significant reaction
The USD/MXN is up on Thursday amid a stronger US dollar across the board. The pair is trading at 20.07, at the highest intraday level. Wall Street is turning from neutral to bearish, favoring the greenback.
On the upside, the immediate resistance is seen at 20.10. A consolidation above could point to further gains and a test of the critical area between 20.17 and 20.20. A daily close above 20.20 would be a positive technical development suggesting more gains ahead, targeting the 20.45 area.
Our projected target is 20.50 given all these factors

USDMXN It is now the perfect time to buy this pair
the zone have been broken and the price needs to come back and retest the zone before it continues going up
tp ans sl provided

USDMXN- 2 MONTH (2 BAR RETRACEMENT)Channel breakout on 4hr confirming high TF Analysis of 1 Week Range breakout
Buy at 4 hr Triangle Breakout


USDMXN is setting up for breakout Watch bottom for long Hi there,
USDMXN is setting up for breakout. Watch bottom on lower time frame and look longer term buying.
Good Luck

USDMXN | ShortWe look at this currency pair from another point of view this time;
This currency pair has been moving in the side area for about 48 days, so we can predict that this side trend will continue.
what do you think?


USDMXN | LongThe USDMXN currency pair has approached a strong support zone by continuing to fall, and after that, signs of reversal can be observed.
what do you think?

USDMXN 15/09/2022Monthly:
Inv h&s
Monthly lows
Weekly:
Bullish M
inv h&s
Daily:
inv h&s
4H:
Bullish M + inv h&s
2 IC to protect the price as well
I put my sl bigger as usual because of the higher spread excotics have


