MXNUSD [14Dec2021]Followup to the plans (below). If you followed you have nice short entries running right now.
I bagged some profit yesterday, and the bearish trend is still strong with DXY showing short term weakness in its bullishness. We might get MXN at the top end of the range soon, looking forward to shorting this again.
Good luck
Redd
USDMXN trade ideas

USDMXNUSDMXN is back to a key area of support . Since we saw a clear, Strong impulse to break out of previous support, now its back to test it before continuing the bullish momentum.
USD/MXN BUY LONG TERMUSD/MXN Analysis; Price will continue buying long term from support zone price $20.90170 up to next daily resistance zone price $21.98530.

MXNUSD [13Dec2021]Background bearish signal is getting stronger as it is approaching the top end of the range. Volatility is still notably high and it is decelerating. Usually this happens when approaching the top end of the range due to volume balancing.
I will wait to short more at the top of the range.
Good luck out there
Redd

Peso correction - USDMXN LongThe Peso has had a smaller run to the upside and institution have been peso long. However last data showed an increase in shorts on the peso and therefor
we think maybe we will see USDMXN going higher.
This is one of our favorite pairs to trade and maybe its because of the tequila =)
Happy smart trading!


MXNUSD [10DEC2021]Follow up to the yesterday's plan (link below).
Vol is slowly dropping and the price is getting closer to the top end of the range. I will look into shorting incrementally. And the plan might come to fruition next weeks, let's see how this goes
Redd

MXNUSD, Immediate term trade and trend [09Dec2021]With slow raising volatility and getting close to the top end of the range is a good setup to start thinking about shorts. Let's see how this goes, I will update here as soon as the signal confirms.
Redd

USDMXNThe last time price reached the 21.80000 resistance area, it was sold off aggressively. This time round, price wasn’t sold off as aggressively when it reached the resistance area. But the fact price still rejected the area, gives me a sell bias for this pair.

USD/MXNUSD INDEX Statistics SPECULATORS | COMMERCIALS
– Percent of OI Longs: 80.5 | 3.1
– Percent of OI Shorts: 11.8 | 80.6
– Net Position: 35879 | -40442
– Gross Longs: 42010 | 1634
– Gross Shorts: 6131 | 42076
– COT Index Reading: Extreme Bullish | Extreme Bearish
Scenario A: Wait for the bears market to turn into a bull market following the major trend, along with testing of the rejection zone.
Scenario B: Bears could slight break rejection zone testing 20.874
Scenario C: Breakout from the rejection zone and continue the downwards movement (Invalid analysis).
Recommendation: Let the price at least test the rejection zone and FAIL before looking for a longing opportunity

USDMXN Bullish Fibonacci PullbackUSDMXN is near completion of a bullish fibonacci pullback pattern. It is extremely important for price to reject the marked area multiple times as price is near a daily high and long opportunities must be open carefully.

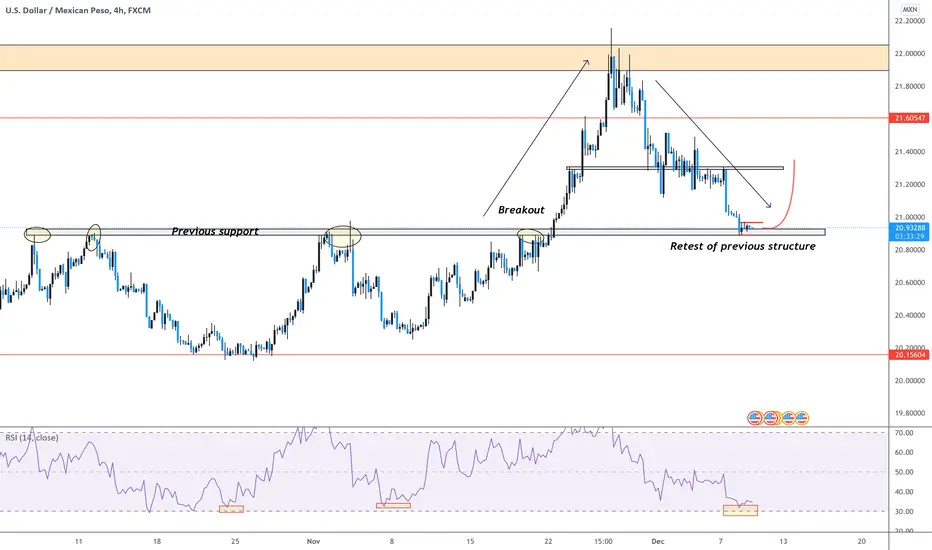
USD/MXN: Movement Lower Trades Near Important Support LevelsThe USD/MXN has experienced a volatile trading range the past handful of days in the wake of the Omicron coronavirus news. After touching a high water mark of nearly 22.16000 on the 26th of November, the USD/MXN has seen selling and a low of 21.11000 approximately was tested yesterday. A reversal upwards was demonstrated after Wednesday’s lowest depths, and the high for yesterday was displayed near the 21.51000 mark afterwards.
However, after hitting this high and seemingly running into a strong amount of headwinds, the USD/MXN did turn lower again and the Forex pair is currently trading slightly below the 21.40000 level. The global Forex market continues to exhibit choppy conditions as financial houses try to achieve a calmer trading landscape, but it is likely the next couple of days will continue to remain rather challenging.
Intriguingly, the USD/MXN did test important support ratios when its low of 21.11000 was made. The USD/MXN was also trading near this juncture on the 23rd and 24th of November, which was before the Omicron news caused a hysterical reaction in the markets. The notion that this level was acting like support before the outbreak of recent headlines suggest the juncture of 21.11000 may be seen as an important inflection point. Traders may believe this level could be tested again in the near term, and use it as a potential target if they are selling the USD/MXN.
However, it should be pointed out that the 21.11000 mark is actually a distance away from the current price of the USD/MXN. Short-term traders may produce solid results speculatively if they wager on selling action when current resistance levels come into sight, and then aim for nearby support around the 21.32000 to 21.29000 marks. Volatility is likely to remain a staple of USD/MXN trading in the short-term and traders should certainly not be over confident.
Bullish traders looking for more upside to develop should also practice caution. Waiting for support levels to be touched and then igniting buying positions may prove to be worthwhile, but like all Forex traders under the present conditions, they are advised not to be overly ambitious. Focusing on the short term for all traders over the next couple of days, may prove to be a healthy trait which helps limit exposure to potentially volatile moves in the USD/MXN.
Mexican Peso Short-Term Outlook
Current Resistance: 21.41000
Current Support: 21.28000
High Target: 21.53000
Low Target: 21.12000

USDMXN - SHORTAfter a few weeks of consecutive upwards movement, we are taking advantage of the short retracement, aslo influenced by our DXY index. Nice swing position, 2 to 3 days.

usdmxn shortswe have a potential sell on usdmxn
this would be a short term sell with trailing stop loss we have prce at a premium and want to take this to lower leverls.

USDMXN MarkupThe news of Omnicorn variant emerging in South Africa caused many countries close their borders and other African travel, which has impacted the price of Crude Oil on fears of lesser demand, of which Mexico is a major exporter, leading to the peso to to a new 1-year high price.
Unless it is quickly discovered that the omicron variant should not be as problematic as feared, it is hard to see how Crude Oil and henceforth the Mexican peso will not make a further sharp fall over the course of this week.
I could see rejection on the .382 or .5 then push to the downside

USDMXN (Short - Live Trade)Bear Signal - Short Call
Dow - Bearish
Lower low - Lower high formed
Candles - Bearish
Bullish Engulfing at Top @ 4 HR
Trend - Bearish
Trend Line Broken
Support & Resistance - NA
Divergence - Bullish
Bulls Vs Bears
01 - 03

Long Opportunity on USDMXNAccording to Price Action
Résistance level Broken
CCI Above 200 Confirmation


USDMXN With this pairs very bullish run on the 4H timeframe, it has made what looks to be a bullish pennant. Hence my buy trade.
USDMXN - PULLOUT FROM A CONSOLIDATION PHASE!USDMXN is bouncing from a long consolidation box and now trading above the fib level of 61%. So we are expecting that bulls are active in it and they have some good targets towards 22.5 followed by 23.00. For bears, there is a support zone to be broken around 21.00 below this area they can activate their trades plans. Good Luck!

USDMXNThis exotic currency pair has been in a bullish trend over the past few weeks, due mostly to USD strength. The news of the origin of a potentially dangerous coronavirus variant emerging in South Africa at the end of last week caused many countries to shut their doors on South African and other African travel, and strongly hit the price of Crude Oil on fears of lesser demand, of which Mexico is a major exporter, causing the Mexican peso to nosedive and send this pair sharply higher to a new 1-year high price on strongly above-average volatility.
Unless it is quickly discovered that the omicron variant should not be as problematic as feared, it is hard to see how Crude Oil and henceforth the Mexican peso will not make a further sharp fall over the course of this week.
The Japanese yen is stronger than the USD so short MXN/JPY will probably be a better trade if your Forex broker offers access to it.

USDMXN!Break of the top doesnt change the direction of the trend.
The correction changed to a complex one of which we cant tell if it will extend more.
But, we see clearly a sell structure.
Trade with care use a stop loss.

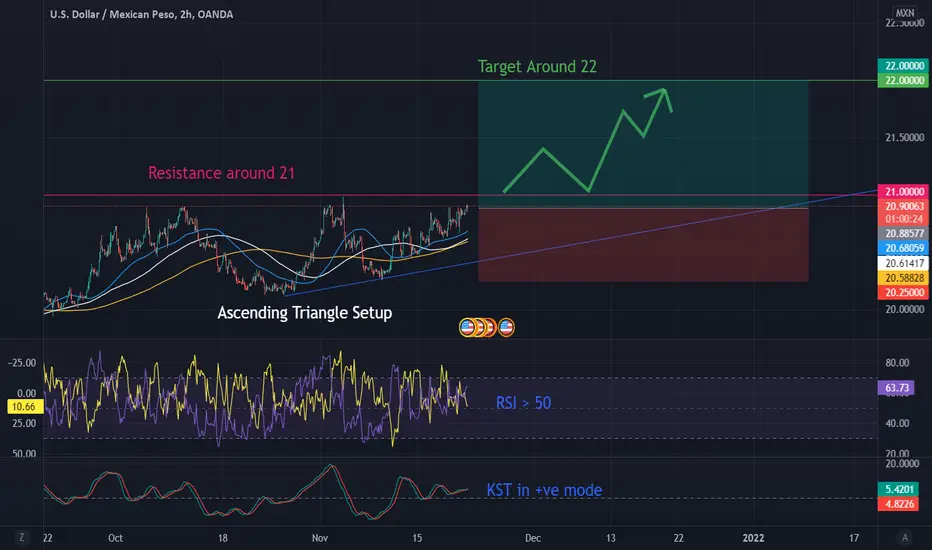
USDMXN to Rally to 22Trend Analysis
The main view of this trade idea is on the 2-Hour Chart. The forex cross USDMXN is currently in an ascending triangle setup with resistance observed around the 21 price level and the support trend line seen around the higher lows of 20.12 and 20.25 respectively. Expectations are for USDMXN to rally towards the 22 price level. Failure of this move will be seen if USDMXN declines below 20.25
On the longer termed Daily Chart USDMXN is trending higher, with the next level of resistance observed around 21.50
Technical Indicators
There has been positive crossovers on USDMXN’s short (50-MA), medium (100-MA) and long (200-MA) term fractal moving averages. USDMXN is also trading above these respective MAs. The RSI is above 50 and the KST is in a positive mode. This indicates a bullish move in USDMXN.
Recommendation
The recommendation will be to go long at market, with a stop loss at 20.25 and a target of 21. This produces a risk/reward ratio of 1.75.
Disclaimer
The views expressed are mine and do not represent the views of my employers and business partners. Persons acting on these recommendations are doing so at their own risk. These recommendations are not a solicitation to buy or to sell but are for purely discussion purposes. At the time of publishing I have exposure to USDMXN.