Mexican PesoPlacing a long term buy position when market opens.
Clear cut set up. If 78.6% doesn’t hold, I’d expect a 100% retracement and then the rise
USDMXN trade ideas


USDMXN!Structure indicates more selling to come.
We were bearish on this pair for several months but there lacked entries.
We see a very low entry.
Trade with care use a stop loss.

Rising Wedge PatternPrice making a rounded bottom on higher timeframe, I'm avoiding the short term sell
and waiting for the major upside push for the peso but price should continue down this week
#ThePatientGame
-LarenzoYouDork

Time to hitch a ride back up!USD/MXN gave me signals that It would drop now we are here for the ride back up!

USDMXN Up 6th Straight Session and Threatens Post-Pandemic WedgeUSDMXN is up nearly 1.5% today - the biggest single-day charge in four and a half months - and working on a sixth straight session's gain. There have been other 6-day rallies over the months, but we haven't seen any more 'productive' advances since the height of the pandemic back in March 2020.
With a large descending wedge's resistance coming into view after this rally, naturally have to consider whether the tempo of the bull run is a contrarian indication. I think the the presence of the FOMC rate decision on Wednesday makes the prospect a 50/50, break or reversal scenario. It falls to how the market's respond to the central bank's message.

View on USD/MXN (27/10)Potential low spotted.
We could likely to see price heads up higher.
Good entry for high RR trade.
Disclaimer:
The information contained in this presentation is solely for educational purposes and does not constitute investment advice. We may or We may not take the trade.
The risk of trading in securities markets can be substantial. You should carefully consider if engaging in such activity is suitable to your own financial situation.
I am not responsible for any liabilities arising from the result of your market involvement or individual trade activity

USD/MXN-FEDSummarize
After 5 wave bearish, the falling trendline is broken.
Considering that the Fed will tapering.
If we add that there is an inflationary environment.
Upward movement is inevitable.

USDMXNIts has started making higher highs with some bullish divergence on multiple indicators as well.
However, both plans are shared for better trading with discipline.

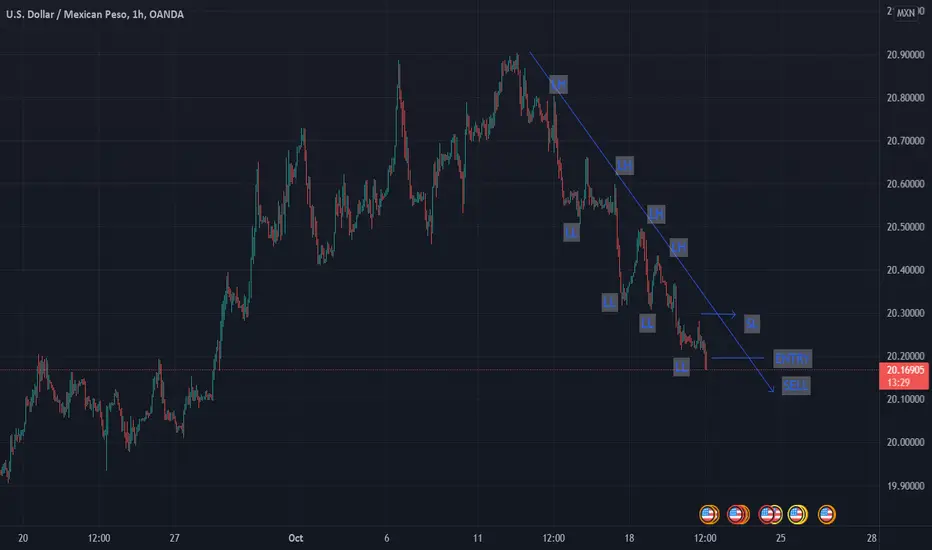
USDMXN SELL INTRADAY TRADE IDEAHello everyone, if you like the idea, do not forget to support with a like and follow.
We have an 1H ICI Momentum pattern, where we will enter on the 15MIN TF, we can see that the area of entry is a structure where it has been tested multiple times in the past, and currently testing it again, once we get a close below the structure we will see a continuation of the bearish for this 1H trade.
Trade Signal
SELL
Entry: 20.19474
Take Profit: 20.12726
Stop Loss: 20.21950
Good luck!
All Strategies Are Good; If Managed Properly!
~FX_SHIFTER


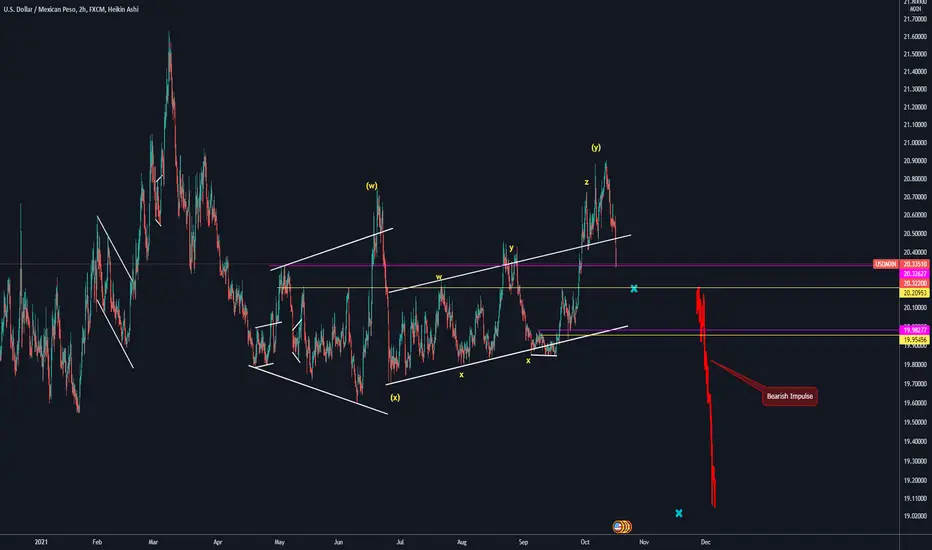
USDMXNWell hear me out here fam, Im really hopeful that USDMXN plays along here because what Ive noticed is how this pair is always present on the Elliot Wave check. So I approach it the Elliot Wave + Fibonacci wave and Im looking to hold as many entries as possible.

Short on USD/MXNI believe the political pressure coming from around the world is forcing the USA to re-evaluate their trading agreements.
Consequently, Either Canada or Mexico will greatly benefit from increase price of petroleum and plastics.
We know the level of security in Canada is miniscule compared to that of the Mexican border, however Mexicans are notorious for their excellent quantum "tunneling" capabilities.
I recommend shorting USD up to at-least a comfortable level of support.
I will not participate on this trade,
however I would just like to pitch the idea for those curious.

Bearish trendLong downward movement and series of lower low and lower high indicate that trend will continue further. Bears have still strong control .


USDMXN!We are anticipating that the next bearish trend wave is on its tracks.
It could be a high risk trade but a promising trade.
Trade with care use a stop loss.


USDMXNIt has stopped making higher highs on hourly time frame and is nearby 0.786 fib levels.
Some divergence could also be in play specially on Klinger.
For safer trades both plans are shared to be act accordingly with discipline.

USDMXN Target Price 20.88690USDMXN Entry Price Range 20.27720 - 20.47720. Wait for price to form a rejection candlestick in a pull back to the EMA 10 EMA 20 and Horizontal Support Resistance Level.

3 Benefits Of A Simple Trading Strategy Keep It Simple Strategy In Forex Does Work:
3 Benefits Of A Simple Trading Strategy
1) More repeatable, more testable, more predictability, better long term results.
2) Easier to execute.
3) Easier to overcome emotions caused by confusion.
