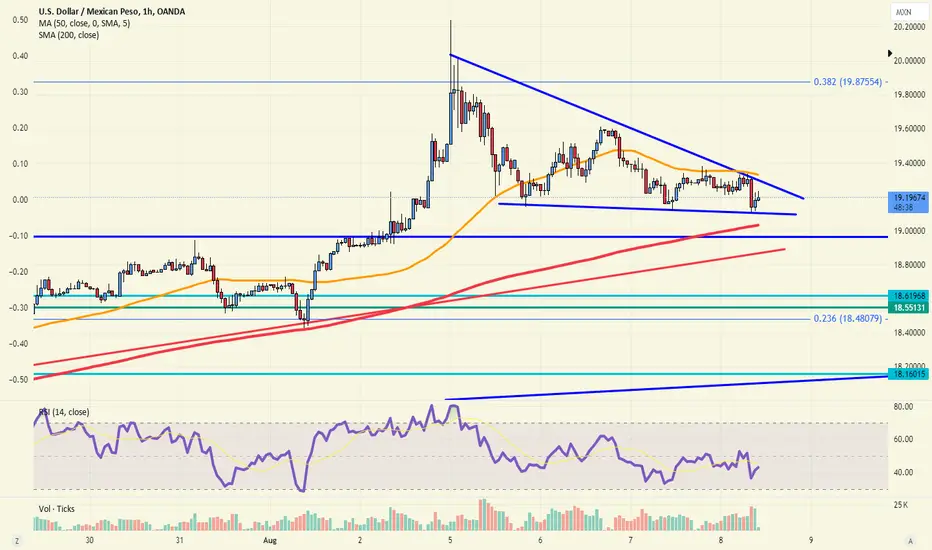
USDMXN testing the 61.8Intraday Update: The USDMXN is holding around the 61.8% retracement near the 19.19 level, which could allow for a bounce. A break of the 19.14 level would target the 19.00 level or channel support.
USDMXN trade ideas

USD/MXN Vulnerable amid Struggle to Test August HighUSD/MXN may threaten the opening range for September as it struggles to test the August high (20.2271).
USD/MXN Rate Outlook
USD/MXN continues to pull back from the monthly high (20.1496) to keep the Relative Strength Index (RSI) below 70, with a break/close below the 19.5620 (78.6% Fibonacci extension) to 19.6280 (23.6% Fibonacci extension) region raising the scope for a move towards 19.1470 (61.8% Fibonacci extension).
Next area of interest comes in around 18.8560 (50% Fibonacci extension) but USD/MXN may track the positive slope in the 50-Day SMA (18.7936) as it holds above the moving average.
Need a close above the 19.8990 (38.2% Fibonacci retracement) to 20.0900 (100% Fibonacci extension) zone to bring 20.3200 (38.2% Fibonacci retracement) on the radar, with the next hurdle coming in around the September 2022 high (20.5804).
--- Written by David Song, Strategist at FOREX.com

Can Inflation Shift the Fed’s Rate Path? This week’s inflation data could be decisive for traders as markets weigh whether the Fed will cut rates by 25 or 50 basis points. Last week’s jobs report did not sway the market from its current consensus.
The US economy added 142,000 jobs in August 2024, falling short of the expected 160,000, based on the latest NFP data. According to the CME FedWatch Tool, the likelihood of a 25-bps rate cut climbed to 73%, while expectations for a 50-bps cut dropped to 27%.
Attention now turns to inflation, with consumer prices expected to fall to 2.6%—the lowest since March 2021—and producer prices anticipated to rise 0.2% month-over-month.
Key USD pairs to watch this week include EUR/USD, with the ECB's upcoming interest rate decision in focus. Additionally, pairs impacted by inflation data releases from Mexico, Brazil, Russia, and India could see significant movement.

USD going to pump hard Real recession incoming, you can smell it in the air. We are due for a huge correction.
Expecting a pump to resistance at around $17.50, thereafter one final drop to ~16.80 and an extreme pump after. $30 by 2028, you heard it here first.

USDMXN may break the 20.20 level soonIntraday Update: The USDMXN is nearing the 20.00 level as Mexico's Lower house approved general text by AMLO which would allow justices to be elected by popular vote. This has kept pressure on the MXN and a break of the 20.0000, then 20.2300 would trigger upside stops. While above 19.6000 the risk remains higher.

Will USDMXN Break Resistance to Continue Uptrend? Wait and see…Interesting pair to watch with major Non Farm Payrolls coming up Friday. A strong beat above estimates could send pair higher, passed previous failure at 20.22 level. Daily channel favors bulls however I expect a tough push higher unless economic data supports USD strength. Bearish for now with light shorts.

USD/MXN Bank Robbery plan to steal the moneyHola ola My Dear,
Robbers / Money Makers & Losers,
This is our master plan to Heist USD/MXN Bank based on Thief Trading style Technical Analysis.. kindly please follow the plan I have mentioned in the chart focus on Long entry. Our target is Red Zone that is High risk Dangerous level, market is overbought / Consolidation / Trend Reversal at the level Bearish Robbers / Traders gain the strength. Be safe and be careful and Be rich.
Note: If you've got a lot of money you can get out right away otherwise you can join with a swing trade robbers and continue the heist plan, Use Trailing SL to protect our money.
Entry : Can be taken Anywhere, What I suggest you to Place Buy Limit Orders in 15mins Timeframe Recent / Nearest Swing Low
Stop Loss : Recent Swing Low using 2h timeframe
Warning : Fundamental Analysis comes against our robbery plan. our plan will be ruined smash the Stop Loss. Don't Enter the market at the news update.
Loot and escape on the target 🎯 Swing Traders Plz Book the partial sum of money and wait for next breakout of dynamic level / Order block, Once it is cleared we can continue our heist plan to next new target.
Support our Robbery plan we can easily make money & take money 💰💵 Follow, Like & Share with your friends and Lovers. Make our Robbery Team Very Strong Join Ur hands with US. Loot Everything in this market everyday make money easily with Thief Trading Style.

USDMXN a sell perspectivePeso on a recent high at monthly levels
divergence and trendline broken indicating down side move

USDMXN Channel Up leading to 21.6500The USDMXN pair eventually gave us on our last analysis (June 27, see chart below) our desired bullish break-out above the multi-year Falling Wedge and the 1W MA200 and its next stop will most likely be our 21.6500 Target:
To view this trend from a more comprehensive perspective, we made today's analysis on the 1D time-frame. The prevailing pattern is a Channel Up, which as you can see is technically on its 3rd Bearish Leg.
Once it hits the 1D MA50 (blue trend-line) at the bottom of the Channel Up along with ideally the 1D RSI hitting its Support Zone, we will have the next short-term bullish signal. The Bullish Legs have so far been fairly symmetrical at a +15% rise. As a result our 21.000 Target is within the range of the expected rise ahead.
-------------------------------------------------------------------------------
** Please LIKE 👍, FOLLOW ✅, SHARE 🙌 and COMMENT ✍ if you enjoy this idea! Also share your ideas and charts in the comments section below! This is best way to keep it relevant, support us, keep the content here free and allow the idea to reach as many people as possible. **
-------------------------------------------------------------------------------
💸💸💸💸💸💸
👇 👇 👇 👇 👇 👇

USDMXN 13:22 14/08/2024No news but I reckon i found a decent 3 RR trade. Exotic markets always looked bullish to me. 19.95 price action target

USD/MXN: Positive Slope in 50-Day SMA in FocusUSD/MXN seems to be consolidating within the opening range for August as it struggles to extend the advance from the start of the week, but the exchange rate may track the positive slope in the 50-Day SMA (18.3576) should it continue to hold above the moving average.
USD/MXN Rate Outlook
Keep in the mind, the decline from the monthly high (20.2271) pulled the Relative Strength Index (RSI) back below 70, and USD/MXN may consolidate over the remainder of the month as the oscillator continues to move away from overbought territory.
Failure to hold above the 18.5090 (23.6% Fibonacci retracement) to 18.6330 (50% Fibonacci retracement) region may push USD/MXN towards the monthly low (18.4291), with the next area of interest coming in around 18.2040 (23.6% Fibonacci extension).
Nevertheless, a break/close above 19.1470 (61.8% Fibonacci extension) may push USD/MXN towards the 19.5620 (78.6% Fibonacci extension) to 19.6280 (23.6% Fibonacci extension) area, with the next hurdle coming in around 19.8990 (38.2% Fibonacci retracement) to 20.0900 (100% Fibonacci extension).
--- Written by David Song, Strategist at FOREX.com

USDMXN Tech Zones Pre Open
USD MXN fell into last week, bring us to key support into Monday,
May see rejection following this and a bounce on local PA levels.

USDMXN at support ahead of Banxico todayIntraday Update: Ahead of the Banxico decision today, a descending wedge may be developing, and a break below the 18.95 level (hawkish hold) or a break back above the 19.38 level (dovish hold/cut) would be the breakout/breakdown points of interest today.
Peso Pressure Ahead of Major MXN Events Mexico's inflation data will be released Thursday morning, closely followed by the Central Bank of Mexico's interest rate decision in the afternoon.
July's headline inflation in Mexico is expected to have accelerated to its highest level in over a year, according to a Reuters poll. However, the core index is anticipated to continue its moderation.
Rising prices in July could complicate any plans for the central bank to lower its key interest rate this week. In late June, the central bank opted to keep its benchmark interest rate unchanged after a rate cut in March, the first since mid-2021 when it began its tightening cycle.
The Mexican Peso has extended its losing streak to four consecutive days against the US Dollar, marking ten losses in the last eleven sessions.
The currency closed above the psychological 19.00 level for two days, having surpassed the previous year-to-date high of 18.99. Market momentum could favor sellers, with the Relative Strength Index indicating overbought conditions. The immediate resistance might stand at the current year-to-date high of 20.22.
On the downside, a breach of the 19.00 support level could open the path to the August stumble close to 18.50, followed by the 50-day Simple Moving Average at 18.20.

USDMXN at key confluence Intraday Update: The USDMXN spike above the 20.00 level screamed past the 61.8% retracement and 161% extension before slipping back below the 20.00 level. Bulls will have to be really careful if we trade back above the 20.00 level intraday.

USDMXN PESO - LONG TERM SELLInitiated a sell trade targeting 18.25. If you're like me and like to trade small and long term this one has a lot of potential. You'll gain interest from the swap! A correction is due around this level. Keep watch and be patient.
Good rule of thumb is to use low leverage and small lot sizes. Small wins are big wins over time.
I like to do .01 for every $1000 usd that I have adding trades along the way (every 200 pips or so).
Thats the plan.

USDMXNThis Weekly FORECAST
Opportunity for USDMXN. This setup trading idea is for intraday. >> TAYOR
Risk Factors:
1. Market conditions, unexpected news, or external events could impact the trade.
2. Always use risk management strategies to protect your capital.

Will the dollar recover its recent losses?Looking lately at the Peso/Dollar relationship, it has seemed as if the high prices for the dollar are here to stay and the super peso has come to past. It was surprising to see that the upward trend that price was on broke. However, price as of lately has been struggling to push downwards. This is because of the 25MA is acting as support on the daily chart. Additionally, seeing the 25MA acting as resistance in the monthly chart put this trade in an uncomfortable situation. Mainly because even though there is an uptrend in important time frames, this trend is being tested on a way larger time frame.
On the other hand, the movement that brought price to these levels was very solid and has a lot of support under it. Considering 18.00 pesos per dollar to be quite a good deal, I would believe that many more people will see it this way and would rather be investing in dollars. In conjunction with the main Mexican index BMV:ME which has failed to recover from the down movement caused by the victory of the newly elected Mexican president. It's officially been a month since the index hasn't been able to break above the 25MA. If price fails to create an uptrend soon, this could lead to another 8% fall in the Index. This would create great buying opportunities in the Mexican market but could also cause investors to panic.
Waiting to see if Mexico is in the verge of collapse makes me think that dominoes may be starting to fall. Meaning there could be something much more serious lurking under the water. This in combination with the high risk that the USA will enter a crisis makes me believe that if price of Mexican stocks doesn't begin to turn around, we could be on the verge of a new recession. The USA still seems to have some fuel left in the tank, which could help the Mexican index recover, as also the recent rainfall has been a blessing for many communities that were affected by the severe droughts all over the country.
Meaning there is a possibility that Mexico will recover, but if it doesn't then this should be a red sign for the USA as your market is overextending. Meaning, if USA enters intro euphoria and Mexico into crisis, then we would have a severe economic divergence in two countries which economies are interconnected. Expect the best, prepare for the worst.

USDMXN - Looking Bullish USDMXN has broken the major downtrend line with some strength and appears to be making a corrective move at the moment. (possible retest)
Now we have to wait how it will react at the Fibonaci levels that converge with the retest of the bearish trendline and with our daily SMMA (Red line), if there is a bullish rejection pattern it could be a good place to open a Long position.

USDMXNI have a bullish bias on this pair. Previous daily high was broken thus indicating to me bullish trend still active .

USD/MXN: Bullish Momentum Expected Amid Demand Area RetestThe USD/MXN currency pair is showing promising signs of a bullish continuation as it retests a recognized demand area. This zone has historically provided strong support and is now positioned to potentially fuel a further upward movement. Large speculators are currently on the bullish side, while retail traders remain bearish, reinforcing our positive outlook for the pair.
Our analysis indicates that the price is making a crucial retest of this demand area before resuming its upward trajectory. This retest is a typical technical pattern that often precedes a bullish continuation, especially when combined with the current market sentiment. The presence of large speculators on the bullish side suggests confidence in the potential for USD/MXN to rise, as these traders often have deeper insights into market trends and fundamentals.
Furthermore, seasonal patterns also support our bullish outlook for the USD against the MXN. Historical data shows that this period typically favors the USD, driven by a combination of macroeconomic factors and market dynamics. Seasonal trends can provide valuable context, enhancing the reliability of technical setups and market sentiment indicators.
Given these factors, we are closely monitoring the price action for a bullish continuation. The demand area retest, combined with bullish speculator positions and favorable seasonality, creates a compelling case for an upward move in USD/MXN. We are looking for the best entry points to capitalize on this potential rise, ensuring a strategic approach to maximize returns while managing risk.
In conclusion, USD/MXN is poised for a bullish continuation following the retest of a significant demand area. The alignment of technical indicators, market sentiment, and seasonal trends all point towards a favorable environment for the USD. Investors should be vigilant for entry opportunities as the price confirms its support and begins its anticipated ascent.
✅ Please share your thoughts about USD/MXN in the comments section below and HIT LIKE if you appreciate my analysis. Don't forget to FOLLOW ME; you will help us a lot with this small contribution.

USDMXN a technical perspective longAs this pair creates bullish momentum after months of sell off
looking for buys at the daily demand and Resistance turned support zone
entry at 61.8 fibo and sweep of liquidity to left
beginning of a rising channel $$$

USDMXN breaking higherIntraday Update: The USDMXN has broken channel resistance and the 38% retracement at 8.1359, which should put the 18.47xx level back in play in the day(s) ahead.
