MXN overvalued but not ready for long term sell.Mexican peso looks overvalued but long term sell signals are still missing. Current support is 15.79 and 17.61 as resistance. MA slow is 18.9 and MA fast is 17.8. Only sell signal is stochastic.
Resistance and MA signals might break after Mexican elections on June 2nd.
USDMXN trade ideas

USD MXN DAILY LONGPurely technically speaking USD MXN got rejected quickly from 16-17 canal and is finding good support on 17. big possibility for a bull run from this area to 18 level or even higher in a long run. this is canceled if it manages to break below 17 once more. US FED interest rate session will create volatility ahead and a good chance for a hike.

USDMXN Strong sell opportunity on the 1D MA200.The USDMXN pair gave us a strong sell signal last time we looked at it (February 19, see chart below):
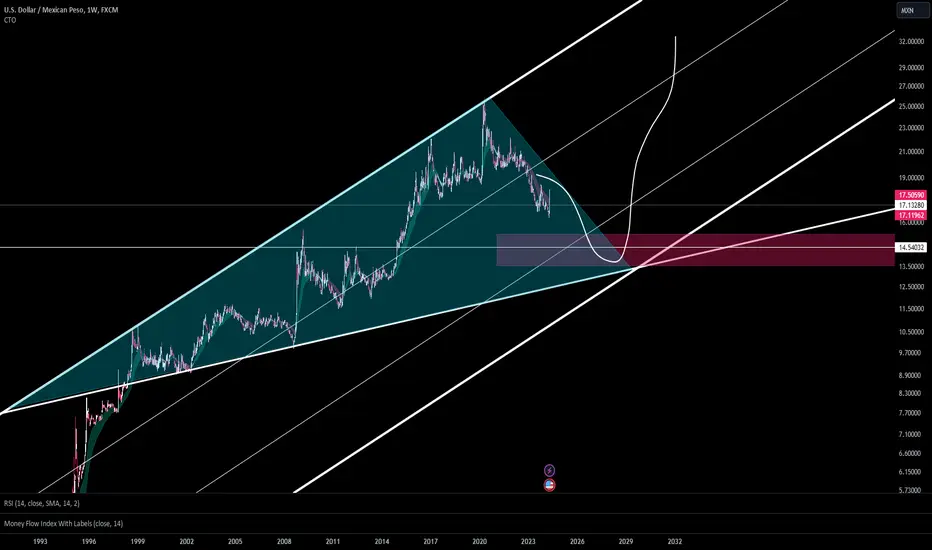
Now a new sell opportunity has emerged as it got rejected heavily at the top (Lower Highs trend-line) of the 2-year Bearish Megaphone pattern and is now trading mostly below the 1D MA200 (orange trend-line).
According to the RSI fractal, this price action is similar to the December 2022 consolidation that kickstarted a heavy decline with first stop the -0.382 Fibonacci extension. As a result, we turn bearish again, targeting 15.7500 (just above the -0.382 Fib).
-------------------------------------------------------------------------------
** Please LIKE 👍, FOLLOW ✅, SHARE 🙌 and COMMENT ✍ if you enjoy this idea! Also share your ideas and charts in the comments section below! This is best way to keep it relevant, support us, keep the content here free and allow the idea to reach as many people as possible. **
-------------------------------------------------------------------------------
💸💸💸💸💸💸
👇 👇 👇 👇 👇 👇

mexico peso usdmxnThe Mexican Peso FX:USDMXN #usdmxn will hit a floor level of 14. A ones in a lifetime opportunity to buy land. get ready. #economy #investor #mexico #mexico usdmxn
Sell your pesos, buy dollarsI was down in Mexico over the past week and most people were commenting about how weak the dollar was against the Peso.
While I was there, the dollar made a move from the low SWB:16S to $18. Most people kept saying that if it gets to $18-$20, you should sell your dollars to buy more pesos, because the dollar will decline against the peso over the long term. List fundamental reasons here= Mexico economy is getting stronger, US is in massive debt, blah blah blah...
Reality is, the chart tells the truth and to me, it looks like the dollar is forming a bottom for a long-term move higher against the peso.
As long as price stays above the blue trendline, price is heading higher. How high? Maybe 2x?
Let's see.

Why Would Countries Devalue Their Currency?Why Would Countries Devalue Their Currency?
Currency devaluation is a nuanced aspect of fiscal policy with profound implications globally. This article demystifies the strategic reasons and consequential effects when nations choose to devalue their currency. From influencing trade balances to adjusting economic strategies, understanding these dynamics is crucial for traders and investors alike. Dive into the complex world of currency devaluation and its far-reaching impact on global economics.
Devalued Currency Definition
So, what is currency devaluation, and how does a country devalue its currency? Currency devaluation is a deliberate downward adjustment of a country's currency value relative to another currency, group of currencies, or standard. This monetary policy decision is typically made by a national government or its central bank. Devaluation is distinct from depreciation, which is a market-driven decrease in currency value.
In a practical sense, devaluation reduces the cost of a country's exports and increases the cost of imports. For countries with fixed or semi-fixed exchange rates, this involves officially lowering the exchange rate by the revaluation of the peg or a change in the pegged currency.
Countries with a free-floating currency system can influence devaluation through monetary policies like lowering interest rates, which can decrease investor demand for the currency, thereby reducing its value. Also, central banks can intervene by buying foreign currency and selling domestic. These fluctuations are visible across many currency pairs in FXOpen’s free TickTrader platform. Additionally, governments might engage in expansive fiscal policies or public statements to sway market perceptions, indirectly impacting the currency's market value.
Devaluation of Currency Example
In 1994, Mexico experienced a notable devaluation of its currency, the peso. This event is often referred to as the Mexican Peso Crisis. Prior to the devaluation, Mexico maintained a fixed exchange rate regime, pegging the peso to the US dollar. However, due to a combination of political uncertainty, economic pressures, and dwindling foreign exchange reserves, the Mexican government found it increasingly challenging to maintain the peso's value.
In December 1994, the government decided to devalue the peso by around 15%. The immediate effect was a dramatic fall in the peso's value, plunging nearly 50% against the dollar within months. This devaluation led to significant economic turmoil, including high inflation and capital flight, but it also eventually helped to make Mexican exports more competitive in the international market.
Why Might a Country Choose to Devalue Its Currency? 3 Reasons
Why would a country devalue its currency? While this move can have widespread implications, there are strategic reasons behind such a decision. Understanding these reasons is crucial in comprehending global economic dynamics.
Reason 1: Boosting Exports
One of the primary reasons for a country to devalue its currency is to make its exports more competitive in the global market. A weaker currency lowers the price of a country's goods and services in foreign markets, making them more attractive to international buyers. This increase in demand for exports can stimulate the country's manufacturing sector and, in turn, boost economic growth. For instance, a country heavily reliant on exports might use devaluation to gain a competitive edge, especially if its major trading partners have stronger currencies.
Reason 2: Reducing Trade Deficits
Devaluation can be a tool to address trade imbalances. A country with a significant trade deficit – where imports exceed exports – might devalue its currency to make imports more expensive and exports cheaper. By doing so, it can reduce the volume of imports as they become costlier for domestic consumers and businesses, while simultaneously increasing exports due to their lower prices on the international market. This adjustment can help in narrowing the trade deficit, bringing more balance to the country's external trade.
Reason 3: Managing National Debt
Countries with high levels of debt denominated in foreign currencies may resort to devaluation as a strategy to reduce the real value of their debt. When a currency is devalued, the amount owed in the local currency increases, but the actual value in terms of foreign currency decreases. This may ease the burden of debt repayment for the government, particularly if the country is facing fiscal challenges. However, this approach can be risky, as it might lead to loss of investor confidence and increased cost of borrowing in the future.
Devalued Currency Effects
The effects of devaluing a currency ripple through various sectors of an economy. In the short term, it often leads to increased inflation. As the cost of imports rises, domestic prices generally increase, affecting the purchasing power of consumers. This inflationary pressure can be particularly challenging for economies that heavily rely on imported goods.
On the business front, while export-oriented industries may thrive due to increased competitiveness abroad, import-dependent businesses face higher costs, which can lead to reduced profit margins or increased prices for consumers. Additionally, the immediate aftermath of devaluation often includes volatility in financial markets, as investors may react to perceived risks by pulling capital out of the country.
In the long term, if managed well, devaluation can lead to a more competitive export sector, potentially resulting in economic growth and job creation. However, the benefits depend on the elasticity of demand for exports and the country's ability to capitalise on the weakened currency.
Finally, devaluation can impact a country's global reputation. Frequent or large-scale devaluations might lead to a loss of investor confidence, affecting foreign investment and the country's ability to borrow money on international markets. Such decisions, therefore, must balance immediate economic needs with long-term fiscal stability and credibility.
The Bottom Line
Understanding currency devaluation's complex dynamics is vital in today's interconnected world. Whether to boost exports, manage debt, or address trade imbalances, nations employ this strategy with varied outcomes. For those looking to take advantage of forex trading, consider opening an FXOpen account to access comprehensive resources and trading opportunities in this dynamic field.
This article represents the opinion of the Companies operating under the FXOpen brand only. It is not to be construed as an offer, solicitation, or recommendation with respect to products and services provided by the Companies operating under the FXOpen brand, nor is it to be considered financial advice.

usdmxn bull runnbig bull run idea off weekly support to weekly resistance. We saw a break of the 88.6 fib level. I expect a retest and continuation. This opportunity is a long term swing there will be several opportunities to leverage more entries as we continue up

USDMXNMarket trading on HTF Supply zone and looking for sell as i shown in picture waiting for confirmation.
Our short term sell can look for a bullish price movement towards the upside before we head any lower.

USD MXN BULLISHUSD MXN break structure on the H4 and price has moved down to a major area on the daily and weekly.
Expecting price to move up in the long term

Potential Bullish IdeaThere's nothing special with this setup, the price has just broken the slanting Trendline and came back to retest, and from the theories of Break and Re-test, this points upstairs. And so, I think we're going upside. Loss and Profit parameters are clearly shown. This is what I think with this Mexican Peso.

Long USDMXN from Bottom?Banxico as started easing and FED turn dovish but not easing yet
First target to 17.3+
I am running on a swap-free account, as swap is very expensive.

USDMXN Falling Wedge w/Bullish Divergence on Daily-Buy BreakoutUSDMXN Daily Chart Falling Wedge with Bullish Divergence on Daily Chart
Buy Stop Placed above the LH with SL below the Lows
TPs calculated based on the falling wedge pattern width
1:1 and 1:2 RR Trade = 1.5RR Total


USDMXN Forecast | Long Term Tech AnalysisHey Traders,
After the 38.2 % retracement on the USDMXN you haven't quite felt the full force of the fall.
That being there is still room for very long term support.
Here are my wider outlook zones for entries/exits.

New Era? Never seen before the uptrend tendency was broken? looks like yes, lest follow our trade from 2 year now and still goin in the same direction. the nest stop will follow the 14.95 ? that's our psychological focus.

USDMXN 25/03/2024Weekly:
-Bearish Weekly imbalance.
-Sellside liquidity acting as magnet for price.
Daily:
-Impulse and correction pattern.
-Bearish daily imbalance.
4H:
-Close below the last bullish imbalance is the confirmation to take shorts.

USDMXN LongAccording with the waves count and considering that we are in a supply zone, we have a long opportunity with this pair.
We will wait the confirmation in lowers timeframes to set our SL

All-Time Low and All-Time High Trading StrategiesAll-Time Low and All-Time High Trading Strategies
In the volatile world of trading, mastering all-time high trading strategies and understanding how to navigate all-time lows are key. This FXOpen article delves into the nuanced tactics and insights that may help you navigate the peaks and troughs of market conditions, offering comprehensive insights if you are looking to leverage these critical areas for trading opportunities.
Understanding All-Time High and All-Time Low Market Conditions
Understanding the dynamics of all-time high and all-time low market conditions is crucial for traders aiming to navigate these pivotal points effectively.
All-time low trading refers to the scenario where an asset has reached its lowest price level in history, often triggering a heightened interest among investors looking for undervalued opportunities or signalling a potential reversal point. Conversely, all-time high trading occurs when assets are trading at their highest historical prices, indicating strong market optimism or potentially overvalued conditions ripe for a correction.
These extremes in market conditions represent significant psychological thresholds for the market participants, as they may lead to increased volatility and liquidity. Traders scrutinise trading at all-time lows to identify the potential for recovery, while those at all-time highs are monitored for signs of sustained momentum or impending pullbacks.
Below, we cover three all-time high and low trading strategies. Consider applying them to live charts in FXOpen’s free TickTrader platform.
Breakout and Consolidation Strategy
When engaging with the market, traders often explore the dynamics of stocks trading at all-time highs or nearing all-time lows. This approach is anchored in the principle that these assets can exhibit significant momentum, potentially setting the stage for trading opportunities.
In learning how to trade all-time-high stocks, one strategy stands out: the Breakout and Consolidation strategy. Its essence lies in monitoring assets that are not only at their all-time high or low but also exhibit a distinct consolidation pattern post-reaching these levels.
Traders typically look for the price to close beyond the all-time high or low, usually on timeframes ranging from 1 hour to daily charts. A subsequent period of sideways movement just beyond the high or low signals a consolidation phase. This phase is crucial as it suggests a potential accumulation or distribution, with traders able to potentially capitalise on a further breakout or upcoming reversal.
Entry
Traders may place a buy-stop order just above the high of the consolidation range if anticipating a continuation of the uptrend.
Alternatively, a sell-stop order can be set just below the low of the range for those expecting a downtrend.
Stop Loss
A stop loss is typically positioned on the opposite side of the consolidation range to manage risk effectively.
Take Profit
Given the absence of a predefined exit point, traders often rely on a specific risk/reward ratio to determine when to exit the position.
Others may prefer using technical analysis tools, such as Fibonacci extensions or momentum-based indicators, to identify potential exit points.
Breakout Retest Strategy
The Breakout Retest strategy offers a nuanced approach for traders looking to understand how to trade all-time high forex pairs. This method is favoured by traders who seek to capitalise on the momentum immediately following the breach of an all-time high or low without waiting for a consolidation phase to confirm the breakout.
In this strategy, the initial step involves identifying a decisive break of the all-time high or low. Unlike the Breakout and Consolidation strategy, which requires a period of sideways movement for confirmation, the Breakout Retest strategy allows traders to act swiftly.
Upon witnessing the break, traders can place an order directly at the level of the broken high or low. This newly established level is now expected to serve as a foundation of support or resistance, guiding future price actions.
Entry
An order may be set at the broken high or low, anticipating it to now act as support (in case of a high break) or resistance (in case of a low break).
Stop Loss
A stop loss may be strategically placed beyond a nearby swing point, offering enough leeway for the price to fluctuate slightly before potentially moving in the anticipated direction.
Take Profit
Profit-taking may be based on a predetermined risk/reward ratio that aligns with the trader's objectives.
Alternatively, traders may employ technical indicators as a signal for exiting the trade.
Candlestick Pattern Reversal Strategy
A Candlestick Pattern Reversal may be particularly effective as part of an all-time low trading strategy. This technique hinges on the premise that a significant price level, such as an all-time low, may mark a turning point where selling pressure exhausts and buying interest begins to dominate. By focusing on candlestick patterns that signal a reversal, traders can identify moments when the market sentiment shifts from bearish to bullish.
The theory states that it’s best to use higher timeframes here, like the daily or weekly chart. Traders watch for specific candlestick formations that indicate a potential reversal. The hammer or morning star patterns are key figures in this analysis, suggesting that sellers have capitulated and buyers are starting to take control.
Once such a candle closes, traders have the option to enter the trade at the closing price or at the opening of the next. Another approach is to wait for a breakout beyond the high or low of the identifying candlestick for confirmation.
Entry
Traders may initiate a position at the close of the reversal candle or upon a breakout of the candle's high or low.
Stop Loss
Setting a stop loss just beyond the extremities of the reversal candle may help in managing risk. Traders consider the risk/reward ratio as they trade on high timeframes, so price fluctuations may be significant.
Take Profit
As this is a reversal strategy aimed at capitalising on a shift in market dynamics, identifying notable support or resistance levels may provide logical targets for exiting the trade.
Evaluating Fundamentals Around All-Time Highs and Lows
Navigating the terrain of all-time highs and lows in both forex and stock markets demands a keen understanding of fundamental analysis. This approach enables traders to assess an asset's intrinsic value and anticipate future movements.
Economic Indicators: For forex, interest rates, inflation, and employment data can help set a bias. In stocks, understanding earnings reports, industry health, and economic conditions can be valuable in analysing direction.
Market Sentiment: Investor sentiment and market trends can significantly impact prices at extreme levels.
Global Events: Political events, economic policies, and global crises can influence market movements, especially at pivotal highs and lows.
Financial News: It may be a good idea to stay updated with financial news and reports that can affect asset valuations and investor behaviour.
The Bottom Line
Mastering how to trade all-time lows and highs is essential for any trader looking to navigate market extremes effectively. By applying the strategies outlined, traders can potentially capitalise on the opportunities these highs and lows present. For those ready to apply these insights in real-world trading scenarios, opening an FXOpen account offers a gateway to the markets, providing the tools and platforms necessary for engaging with all-time high and low trading strategies.
This article represents the opinion of the Companies operating under the FXOpen brand only. It is not to be construed as an offer, solicitation, or recommendation with respect to products and services provided by the Companies operating under the FXOpen brand, nor is it to be considered financial advice.

Fed keeps rates steady, Banxico up next The US Federal Reserve has kept interest rates steady at 5.25%-5.50% while continuing its balance sheet reduction as planned since May 2023.
In contrast, the Bank of Mexico (Banxico) might announce a rate cut tomorrow.
It's anticipated that Banxico could decrease its interest rate from 11.25% to 11%, potentially applying pressure on the Mexican peso. This could drive the USD/MXN rate closer to the 17.00 mark, diverging further from its 10-year low. Some Fib levels from its recent swing higher could also be some interesting, more assessable, targets
However, the possibility of a rate cut from Banxico is not guaranteed, given potential divisions within its Governing Council. Recent speeches by officials indicate a 3-2 split, with some members leaning towards a more accommodative approach, while others like Jonathan Heath and Irene Espinosa Cantellano favor a hawkish stance.


BIG BULL STOP HUNT LOOMINGwell well well, the pesso is one to be worked with care, so it makes since to trap and pull when news hit

Strong downtrendUSDMXN has been under pressure for a few days now and I am not expecting it to stop soon. The US Dollar has been going down because of expected rates cuts to come this year and the mexican peso still benefits from a tighter monetary policy. Now that the fundamentals are in the favor of a continuation to the downside, we can observe on the daily timeframe the formation of a triangle that has been broken to the downside showing that sellers are in control and that they will probably continue to put more volume pushing price down in the future.

USDMXN Bearish BreakoutUSDMXN has had difficulties creating higher structure while slowy going down on every failed attempt to break higher. Price has recently broken below a key support which shows that sellers are in control especially knowing the macro economics circumstances. My target is at 16.82000 .
