USDNOK trade ideas


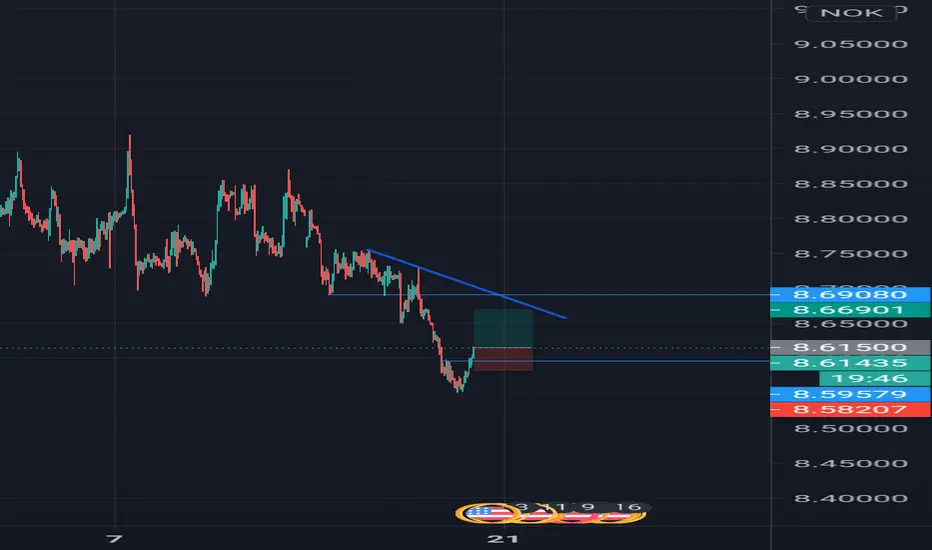
Where does this go next?THe chart pattern tells us that reversal is extremely likely (and the bottom was already hit and USD is becoming stronger. In that case USD follows the YELLOW dashed arrow
However the oil prices going up are making the NOK stronger and this means that the USD should actually go down along the GREEN dashed arrow and break the last support (horizontal green line).
I am not sure which of the two dashed arrows will be true.
What is your opinion?

5 year cycleJanuary 8 marks 5 years and 2 days since a prior major high for USDNOK, this along with the 0 Gann fan from this time point, price reacted nicely to the 2 x 1

USD/NOK: PRICE ACTION + BEARISH HARMONIC GARTLEY 🔔Welcome back Traders, Investors and Community!
Analysis of #USDNOK
If you have found this useful then help us support my page by hitting the LIKE button.
If you are not subscribed yet then please feel free to follow my page for daily updates and ideas. Thank you
It means a lot to us!
***
Strategy: Bearish Gartley on H4 timeframe - We will be waiting for all the confirmations to enter in this trade.
A clear chart is Always the best business card for a trader.
***
Your support and feedback will always welcome
Thank you for your time.
The information contained herein is not intended to be a source of advice or credit analysis
Regards,
Walter

USDNOK BULLISH SENTIMENTGET BULLISH ON USDNOK
BREAK OF STRUCTURE, BREAKOUT OF TREND AND SUCCESSFUL RETEST OF STRONG SUPPORT
LETS ROCK IT


Faked the break and blast offLooks like a quick fake out at the bottom of a long run down. Markets gapped and are looking top make a run up. This is on its way to wave 3 of the first wave up. I see clear green skies ahead.


USDNOK: Technical analysis. Hello traders,
Wave 5 is materialising. It's supposed to be a long journey.
Thanks.

USDNOK,USDPLN & AUDJPY correlation trade on D1 ChartGREETINGS
This articles will be a follow up piece to the educational article I did on correlation trades in the forex market. Check out my article on CORRELATION-DIVERSIFYING-HEDGING-An-elementary-view
Now in a previous article that I wrote I had strongly suggested that the AUDJPY had reached a key level of resistance on the daily and weekly chart and was suggesting a possible short sell. Interestingly this was about 2 weeks ago and the price action hasn't really come down at the magnitude expected, except for today (21/12/2020). As I concluded the previous article I promised to explore the idea of how correlated pairs can be used to confirm break outs and avoid fake outs, and this is what we are going to do with the above currency pairs.
To start of we shall consider that pair that I had last made an analysis on, which was the AUD/JPY. This pair I had concluded had reached a crucial resistance level and therefore was ready for a sell. I realised at the time that currency pairs do not move in isolation so to avoid the risk associated with putting all my eggs in one "trade", I sought negatively correlated pairs to place a trade and potentially double up my profits while giving me the comfort of a diversified portfolio. I came across 2 pairs which had a -98% negative correlation and these pairs were the USD/NOK and USD/PLN.
So how we use such correlated pairs to confirm a break out and not a fake out is to closely monitor both pairs when there is a sudden move in the opposite direction by one pair, you observe the other to see if there is a corresponding move. This I learnt the hard way last week as the prevailing trend on the AUD/JPY was somewhat bullish, whenever it would reverse I would quickly look to put an opposing entry on the USD/NOK. I would not wait for the confirmation on that pair and guess what the USD/NOK would rally further down. this showed that the reversal on the bullish AUD/JPY was a fake out. Sure enough the AUD/JPY would go back up. Now that both pairs seems to be correlating perfectly I think it might be an opportunity here.
I have attached the chart which shows how these pairs look like a mirror image.
Now I will be looking for long positions "only when price action confirms". This confirmation will be in the form of a pin bar or bullish engulfing candle on the daily (D!) chart. So possible a buy stop or just put an alert at the open of the last bearish candle.
My outlook
My outlook for the USD/NOK and USD?PLN is to go long This view is long term and could possibly look beyond Jan 2021
My possible entries could be:
USD/NOK
Buy Stop 8.7416
Take Profit around 9.1400 and maybe let it run to 9.51
USD/PLN
Buy Stop 3.72
Take Profit around 3.88
As I said this could go beyond Jan 2021
Takunda Mudenge is a market analyst based in Zimbabwe, Africa. He writes in his personal capacity for educational and entertainment purposes. This should not be construed, assumed or viewed as investment advise. Please consul a professional for such.


USD/NOK - SELL UPDATEThe Norwegian Kroner continues to strengthen against the U.S Dollar.
Higher Crude Oil prices are increasing the demand for the commodity-linked Norwegian Krone.
The Dollar is weaker due to lower interest rates and the negative balance in the U.S Current account.
In the video we look at selling the exchange rate, with take profit targets, stop loss, and entry price analysis.

ridethepig | NOK for the Yearly Close📌 NOK for the Yearly Close
Now comes the traditional complex NOK and SEK map complex. I have mentioned a number of times SEK was in a very good position for sellers, now NOK is joining the disco because it is unlikely that dollar can manage to force the defence. A very amusing chart, for those with a background in waves we are playing the breakdown on a 5 wave multi-decade flow ending.
Here we are dealing with a remarkable position for sellers, a staggering -12% downside to go to the nearest support ....meaning the manoeuvre is intended to put pressure on our opponent as one might suppose with capitulation. Invalidation can be defined above the latent outside reversal.
Thanks as usual for keeping the feedback coming 👍 or 👎


