NZDUSD Potential UpsidesHey Traders, in today's trading session we are monitoring NZDUSD for a buying opportunity around 0.60000 zone, NZDUSD is trading in an uptrend and currently is in a correction phase in which it is approaching the trend at 0.60000 support and resistance area.
Trade safe, Joe.
USDNZD trade ideas
NZDUSD Pullback in Play – Head & Shoulders Signals More DownsideNZDUSD ( OANDA:NZDUSD ) is currently trading near the Resistance zone($0.612-$0.605) and has also managed to break the Support zone($0.604-$0.602) . We consider the Support zone as the neckline of the Head and Shoulders Pattern .
In terms of classic technical analysis , NZDUSD has managed to form a Head and Shoulders Pattern .
I expect NZDUSD to decline towards the Support zone($0.5968-$0.5946) after completing the pullback .
Note: Stop Loss(SL): $0.6062
Please respect each other's ideas and express them politely if you agree or disagree.
New Zealand Dollar/ U.S. Dollar Analyze (NZDUSD), 1-hour time frame.
Be sure to follow the updated ideas.
Do not forget to put a Stop loss for your positions (For every position you want to open).
Please follow your strategy and updates; this is just my Idea, and I will gladly see your ideas in this post.
Please do not forget the ✅' like '✅ button 🙏😊 & Share it with your friends; thanks, and Trade safe.

NZDUSD beating for a robust up move soon The coming weekdmight be a more volatile week for NZD, Stay put, I feel take out for long positions when you see the Opportunities.

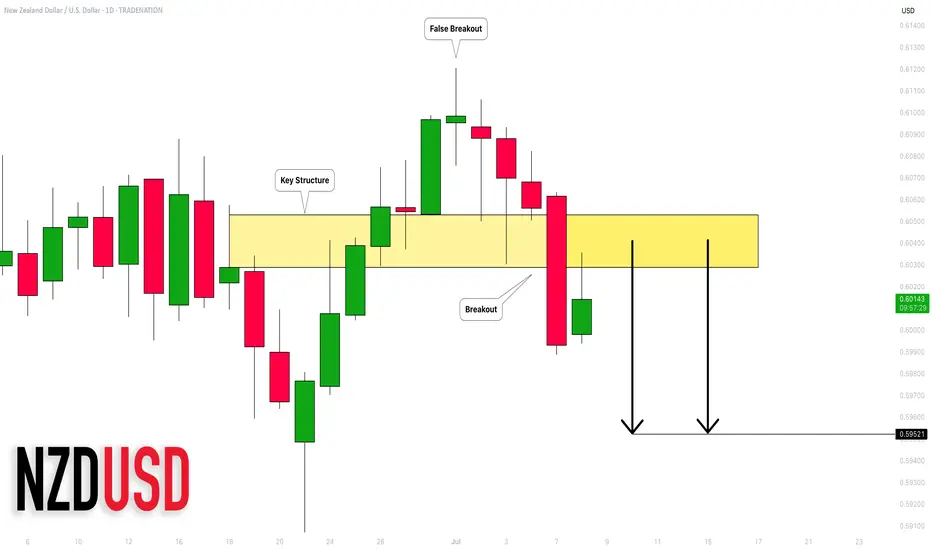
NZDUSD Faces Further Downside Amid Renewed Tariff ConcernsNZDUSD Faces Further Downside Amid Renewed Tariff Concerns
In July, NZDUSD created a false breakout after printing a new higher high.
Initially, the pair appeared set for further gains, but the U.S. dollar regained strength following stronger-than-expected Non-Farm Payrolls (NFP) data.
Today, market sentiment remains fragile as anticipation builds around President Trump's upcoming remarks on tariffs.
Our analysis suggests that the broader outlook remains unchanged—NZDUSD is still positioned for further downside.
You may find more details in the chart!
Thank you and Good Luck!
❤️PS: Please support with a like or comment if you find this analysis useful for your trading day❤️
Disclosure: I am part of Trade Nation's Influencer program and receive a monthly fee for using their TradingView charts in my analysis.

NZD/USD H&S Reversal Pattern Clear,Short Setup To Get 150 Pips !Here is my opinion On NZD/USD On 4H T.F , If we checked the chart we will see that we have a very strong Historical res that forced the price many times to respect it and stay below it and now we have another good confirmation , we have a perfect reversal pattern and we have a clear closure below our neckline so the pattern already confirmed , i`m waiting the price to go up a little to retest my broken neckline and then we can enter a sell trade . only 1 case i will avoid this idea , if we have a daily closure agin above my res with clear closure .

NZD/USD(New Zealand Dollar vs US Dollar) chart on the 1H timefrm NZD/USD (New Zealand Dollar vs US Dollar) chart on the 1H timeframe:
Price has broken below the ascending trendline and is now trading below the Ichimoku Cloud, confirming bearish momentum.
You already have clear two downside target levels marked on the chart.
Based on your chart:
✅ First Target: 0.60200
✅ Second Target: 0.59500
---
Quick Summary:
Bearish breakout confirmed.
Targets are positioned at 0.60200 and 0.59500.
As long as price stays below the Ichimoku Cloud, the bearish trend is valid.
Let me know if you want stop-loss or confirmation levels suggestions.

Bullish bounce?The Kiwi (NZD/USD) is falling towards the pivot and could bounce to the 1st support which has been identified as a pullback support.
Pivot: 0.5937
1st Support: 0.5820
1st Resistance: 0.6098
Risk Warning:
Trading Forex and CFDs carries a high level of risk to your capital and you should only trade with money you can afford to lose. Trading Forex and CFDs may not be suitable for all investors, so please ensure that you fully understand the risks involved and seek independent advice if necessary.
Disclaimer:
The above opinions given constitute general market commentary, and do not constitute the opinion or advice of IC Markets or any form of personal or investment advice.
Any opinions, news, research, analyses, prices, other information, or links to third-party sites contained on this website are provided on an "as-is" basis, are intended only to be informative, is not an advice nor a recommendation, nor research, or a record of our trading prices, or an offer of, or solicitation for a transaction in any financial instrument and thus should not be treated as such. The information provided does not involve any specific investment objectives, financial situation and needs of any specific person who may receive it. Please be aware, that past performance is not a reliable indicator of future performance and/or results. Past Performance or Forward-looking scenarios based upon the reasonable beliefs of the third-party provider are not a guarantee of future performance. Actual results may differ materially from those anticipated in forward-looking or past performance statements. IC Markets makes no representation or warranty and assumes no liability as to the accuracy or completeness of the information provided, nor any loss arising from any investment based on a recommendation, forecast or any information supplied by any third-party.

NZDUSD: Important Breakout 🇳🇿🇺🇸
NZDUSD looks bearish after a false violation of a current daily structure high.
The price dropped with a high momentum bearish candle, violating
a significant support cluster and closing below that.
The pair may fall even more.
Next support - 0.5952
❤️Please, support my work with like, thank you!❤️
I am part of Trade Nation's Influencer program and receive a monthly fee for using their TradingView charts in my analysis.
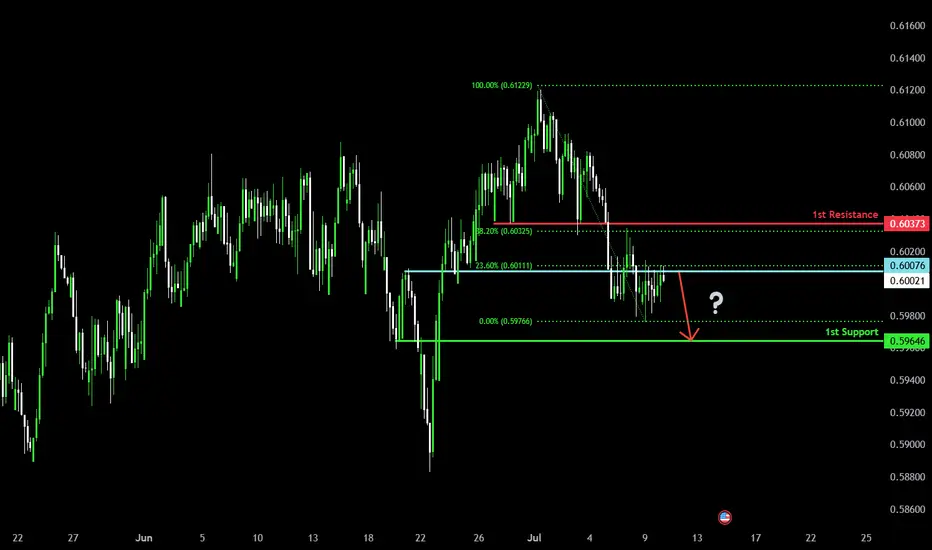
Bearish drop?The Kiwi (NZD/USD) is reacting off the pivot and could drop to the 1st support which is a pullback support.
Pivot: 0.6007
1st Support: 0.5946
1st Resistance: 0.6037
Risk Warning:
Trading Forex and CFDs carries a high level of risk to your capital and you should only trade with money you can afford to lose. Trading Forex and CFDs may not be suitable for all investors, so please ensure that you fully understand the risks involved and seek independent advice if necessary.
Disclaimer:
The above opinions given constitute general market commentary, and do not constitute the opinion or advice of IC Markets or any form of personal or investment advice.
Any opinions, news, research, analyses, prices, other information, or links to third-party sites contained on this website are provided on an "as-is" basis, are intended only to be informative, is not an advice nor a recommendation, nor research, or a record of our trading prices, or an offer of, or solicitation for a transaction in any financial instrument and thus should not be treated as such. The information provided does not involve any specific investment objectives, financial situation and needs of any specific person who may receive it. Please be aware, that past performance is not a reliable indicator of future performance and/or results. Past Performance or Forward-looking scenarios based upon the reasonable beliefs of the third-party provider are not a guarantee of future performance. Actual results may differ materially from those anticipated in forward-looking or past performance statements. IC Markets makes no representation or warranty and assumes no liability as to the accuracy or completeness of the information provided, nor any loss arising from any investment based on a recommendation, forecast or any information supplied by any third-party.
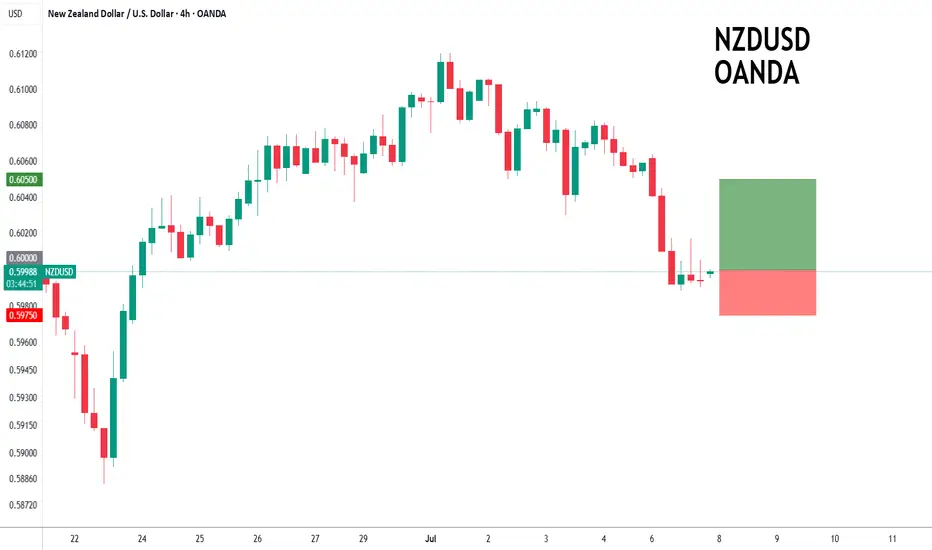
NZDUSD to find buyers at the current market price?NZDUSD - 24h expiry
The correction lower is assessed as being complete.
We expect a reversal in this move.
Risk/Reward would be poor to call a buy from current levels.
A move through 0.6025 will confirm the bullish momentum.
The measured move target is 0.6075.
We look to Buy at 0.6000 (stop at 0.5975)
Our profit targets will be 0.6050 and 0.6075
Resistance: 0.6025 / 0.6050 / 0.6075
Support: 0.6010 / 0.6000 / 0.5975
Risk Disclaimer
The trade ideas beyond this page are for informational purposes only and do not constitute investment advice or a solicitation to trade. This information is provided by Signal Centre, a third-party unaffiliated with OANDA, and is intended for general circulation only. OANDA does not guarantee the accuracy of this information and assumes no responsibilities for the information provided by the third party. The information does not take into account the specific investment objectives, financial situation, or particular needs of any particular person. You should take into account your specific investment objectives, financial situation, and particular needs before making a commitment to trade, including seeking advice from an independent financial adviser regarding the suitability of the investment, under a separate engagement, as you deem fit.
You accept that you assume all risks in independently viewing the contents and selecting a chosen strategy.
Where the research is distributed in Singapore to a person who is not an Accredited Investor, Expert Investor or an Institutional Investor, Oanda Asia Pacific Pte Ltd (“OAP“) accepts legal responsibility for the contents of the report to such persons only to the extent required by law. Singapore customers should contact OAP at 6579 8289 for matters arising from, or in connection with, the information/research distributed.
Market Analysis: NZD/USD SlipsMarket Analysis: NZD/USD Slips
NZD/USD is struggling and might decline below the 0.5980 level.
Important Takeaways for NZD/USD Analysis Today
- NZD/USD is consolidating above the 0.5980 support.
- There is a connecting bearish trend line forming with resistance at 0.6010 on the hourly chart of NZD/USD at FXOpen.
NZD/USD Technical Analysis
On the hourly chart of NZD/USD at FXOpen, the pair also followed AUD/USD. The New Zealand Dollar struggled above 0.6100 and started a fresh decline against the US Dollar.
There was a move below the 0.6050 and 0.6020 support levels. A low was formed at 0.5978 and the pair is now consolidating losses below the 50-hour simple moving average. The NZD/USD chart suggests that the RSI is back below 50 signalling a bearish bias.
On the upside, the pair is facing resistance near the 23.6% Fib retracement level of the downward move from the 0.6120 swing high to the 0.5978 low. There is also a connecting bearish trend line forming with resistance at 0.6010.
The next major resistance is near the 0.6065 level or the 61.8% Fib retracement level. A clear move above the 0.6065 level might even push the pair toward the 0.6120 level. Any more gains might clear the path for a move toward the 0.6150 resistance zone in the coming days.
On the downside, there is a support forming near the 0.5980 zone. If there is a downside break below 0.5980, the pair might slide toward 0.5940. Any more losses could lead NZD/USD in a bearish zone to 0.5910.
This article represents the opinion of the Companies operating under the FXOpen brand only. It is not to be construed as an offer, solicitation, or recommendation with respect to products and services provided by the Companies operating under the FXOpen brand, nor is it to be considered financial advice.

Bearish drop?The Kiwi (NZD/USD) has rejected off the pivot and could drop to the 1st support.
Pivot: 0.6038
1st Support: 0.5938
1st Resistance: 0.6079
Risk Warning:
Trading Forex and CFDs carries a high level of risk to your capital and you should only trade with money you can afford to lose. Trading Forex and CFDs may not be suitable for all investors, so please ensure that you fully understand the risks involved and seek independent advice if necessary.
Disclaimer:
The above opinions given constitute general market commentary, and do not constitute the opinion or advice of IC Markets or any form of personal or investment advice.
Any opinions, news, research, analyses, prices, other information, or links to third-party sites contained on this website are provided on an "as-is" basis, are intended only to be informative, is not an advice nor a recommendation, nor research, or a record of our trading prices, or an offer of, or solicitation for a transaction in any financial instrument and thus should not be treated as such. The information provided does not involve any specific investment objectives, financial situation and needs of any specific person who may receive it. Please be aware, that past performance is not a reliable indicator of future performance and/or results. Past Performance or Forward-looking scenarios based upon the reasonable beliefs of the third-party provider are not a guarantee of future performance. Actual results may differ materially from those anticipated in forward-looking or past performance statements. IC Markets makes no representation or warranty and assumes no liability as to the accuracy or completeness of the information provided, nor any loss arising from any investment based on a recommendation, forecast or any information supplied by any third-party.

Bearish reversal for the Kiwi?The price has rejected off the pivot, which acts as an overlap resistance that lines up with the 38.2% Fibonacci retracement and could drop to the 1st support.
Pivot: 0.6038
1st Support: 0.5938
1st Resistance: 0.6079
Risk Warning:
Trading Forex and CFDs carries a high level of risk to your capital and you should only trade with money you can afford to lose. Trading Forex and CFDs may not be suitable for all investors, so please ensure that you fully understand the risks involved and seek independent advice if necessary.
Disclaimer:
The above opinions given constitute general market commentary, and do not constitute the opinion or advice of IC Markets or any form of personal or investment advice.
Any opinions, news, research, analyses, prices, other information, or links to third-party sites contained on this website are provided on an "as-is" basis, are intended only to be informative, is not an advice nor a recommendation, nor research, or a record of our trading prices, or an offer of, or solicitation for a transaction in any financial instrument and thus should not be treated as such. The information provided does not involve any specific investment objectives, financial situation and needs of any specific person who may receive it. Please be aware, that past performance is not a reliable indicator of future performance and/or results. Past Performance or Forward-looking scenarios based upon the reasonable beliefs of the third-party provider are not a guarantee of future performance. Actual results may differ materially from those anticipated in forward-looking or past performance statements. IC Markets makes no representation or warranty and assumes no liability as to the accuracy or completeness of the information provided, nor any loss arising from any investment based on a recommendation, forecast or any information supplied by any third-party.

A huge FallThis pair is showing signs of reversal on that trend zone, we might see it continue to push down even more

Bearish continuation?The Kiwi is reacting off the resistance level which is a pullback resistance and could drop from this level to our take profit.
Entry: 0.6005
Why we like it:
There is a pullback resistance.
Stop loss: 0.6032
Why we like it:
There is an overlap resistance.
Take profit: 0.5964
Why we like it:
There is a pullback support that is slightly below the 78.6% Fibonacci retracement.
Enjoying your TradingView experience? Review us!
Please be advised that the information presented on TradingView is provided to Vantage (‘Vantage Global Limited’, ‘we’) by a third-party provider (‘Everest Fortune Group’). Please be reminded that you are solely responsible for the trading decisions on your account. There is a very high degree of risk involved in trading. Any information and/or content is intended entirely for research, educational and informational purposes only and does not constitute investment or consultation advice or investment strategy. The information is not tailored to the investment needs of any specific person and therefore does not involve a consideration of any of the investment objectives, financial situation or needs of any viewer that may receive it. Kindly also note that past performance is not a reliable indicator of future results. Actual results may differ materially from those anticipated in forward-looking or past performance statements. We assume no liability as to the accuracy or completeness of any of the information and/or content provided herein and the Company cannot be held responsible for any omission, mistake nor for any loss or damage including without limitation to any loss of profit which may arise from reliance on any information supplied by Everest Fortune Group.

NZDUSD Hits Channel Top Bearish Momentum BuildingNZDUSD pair has touched a key resistance zone near the top of its rising channel and is showing early signs of rejection. This technical inflection point aligns with weakening New Zealand economic sentiment and renewed strength in the US dollar. The stage is set for a bearish rotation, with several support targets now in focus if momentum continues to build to the downside.
📉 Current Bias: Bearish
NZDUSD has failed to break above the 0.6085–0.6090 resistance area, marking repeated rejections at the channel’s upper boundary. Price action and structure suggest a potential move back toward 0.6000 and deeper levels such as 0.5960 and 0.5910 if support fails.
🔍 Key Fundamentals:
RBNZ on Hold and Dovish Leaning: The Reserve Bank of New Zealand has paused its tightening cycle, with Governor Orr signaling no urgency to hike further amid weakening domestic demand and subdued inflation momentum.
US Dollar Support: The USD is gaining traction amid Fed officials maintaining a hawkish hold tone, and with markets paring back bets on near-term rate cuts due to sticky inflation and resilient labor data.
NZ Economic Weakness: New Zealand’s growth has stagnated, with recent trade and retail data underwhelming. Business sentiment remains subdued, adding to downside Kiwi pressure.
⚠️ Risks to the Trend:
Soft US Data: Any major downside surprise in upcoming US labor market or inflation figures could reignite Fed rate cut bets and weigh on the dollar, lifting NZDUSD.
China Rebound: As China is a major trading partner for New Zealand, any strong recovery signs or stimulus headlines out of Beijing could buoy NZD on improved trade expectations.
Unexpected RBNZ Hawkishness: If the RBNZ pivots back to a more aggressive tone due to inflation persistence, NZD could find renewed strength.
📅 Key News/Events Ahead:
US PCE Inflation (June 28): Core metric closely watched by the Fed; any surprise will directly impact USD flows.
NZIER QSBO Survey (July 2): Offers insight into New Zealand business confidence.
US ISM Manufacturing & NFP (July 1–5): Major USD drivers with implications for broader market sentiment.
⚖️ Leader or Lagger?
NZDUSD is currently a lagger, often following directional shifts in USD majors like EURUSD and AUDUSD. However, due to its sensitivity to Chinese data and Fed rate expectations, it may accelerate moves once broader USD sentiment is established.
🎯 Conclusion:
NZDUSD looks poised for a bearish pullback from the channel top, with a confluence of macro and technical factors suggesting pressure toward 0.6000, 0.5960, and potentially 0.5910. While downside momentum builds, attention must remain on US data, China headlines, and RBNZ commentary for any sentiment shift. Bears hold the upper hand for now, but risk events ahead could challenge the momentum.

NZDUSD H4 ShortIt's a Down trend in the Weekly price under 200 EMA, Pin Par in the weekly time fram. strong Resistant to break to the upside.

NZDUSD Inside a Large ABCDE PatternNZDUSD Inside a Large ABCDE Pattern
The US dollar is lower across the board today as President Trump may accelerate the announcement of a successor to Federal Reserve Chairman Jerome Powell, as reported by the WSJ.
Investors are wary of the lack of independence from the Federal Reserve and expect interest rates to move significantly lower.
It is strange that the market did not move up and down in a crazy way at a time when we were close to a possible World War III and it's really funny that all the charts are moving because Powell could be replaced.
We have to be careful because these are just rumors at the moment and no one can replace Powell if he doesn't want to. Otherwise, Trump would have made this decision a long time ago.
Technical Analysis:
The price is testing a strong resistance area near 0.6100 again
It looks like we are inside a larger pattern and potentially NZDUSD could move down again once these rumors disappear.
Key level zones: 0.6000, 0.5955, and 0.5910
You may find more details in the chart!
Thank you and Good Luck!
❤️PS: Please support with a like or comment if you find this analysis useful for your trading day❤️
Disclosure: I am part of Trade Nation's Influencer program and receive a monthly fee for using their TradingView charts in my analysis.

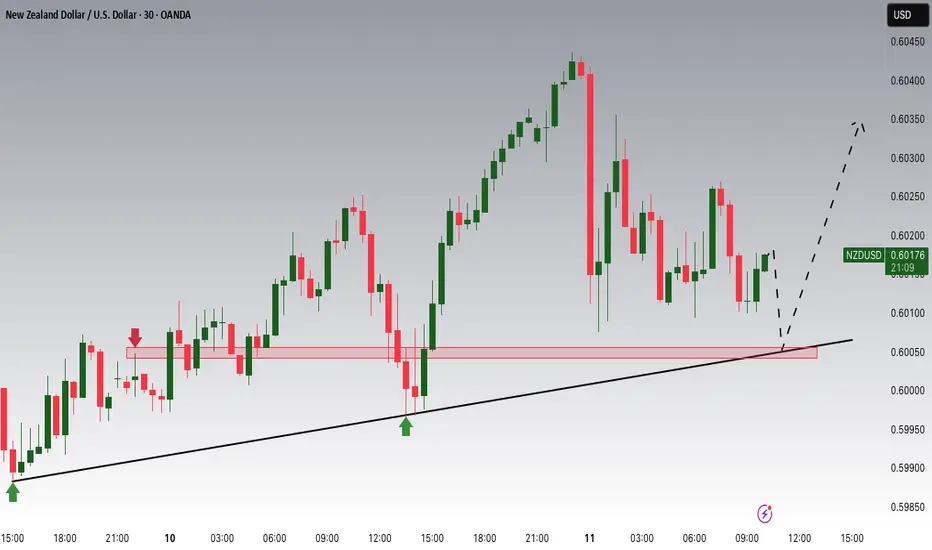
NZD/USD showing a potential bullish setupNZDUSD 4H Trade Breakdown – Bullish Reversal in Play 🔥📈
This setup is a textbook example of a smart money reversal backed by structure, market psychology, and clear technicals.
1. Change of Character (CHoCH):
- The market was previously in a downtrend.
- Price broke above the last lower high, signaling a CHoCH – the first sign that buyers are gaining control.
- This is a key point where many smart traders start paying attention.
2. Trendline & Channel Respect:
- Price tapped perfectly off the ascending trendline, confirming the long-term bullish channel.
- This adds confluence (multiple confirmations) to the bullish bias.
3. Market Structure Shift:
- After the CHoCH, price formed a higher low and started pushing up.
- This shows a shift to bullish structure (higher highs and higher lows).
4. Projected Move:
- The blue arrow shows a likely path: a bullish break, possible pullback to retest the broken structure, then continuation up.
- Targeting above 0.61200, with potential for further highs.
Why this trade stands out:
✅ Structure break (CHoCH)
✅ Strong support off trendline

NZDUSD is BullishPrice is in a strong downtrend, and respecting the descending trendline, however the matured bullish divergence with a double bottom reversal pattern hints the control of bulls. If the trendline and previous lower high are broken with good volume then we can expect a bullish reversal as per the Dow theory. Targets are mentioned on the chart.


NZDUSD M15 I Bullish Bounce Off Based on the M15 chart analysis, the price is approaching our buy entry level at 0.6014, a pullback support.
Our take profit is set at 0.6053, a pullback resistance that aligns with the 100% Fib projection.
The stop loss is placed at 0.5975, a swing low support.
High Risk Investment Warning
Trading Forex/CFDs on margin carries a high level of risk and may not be suitable for all investors. Leverage can work against you.
Stratos Markets Limited (tradu.com ):
CFDs are complex instruments and come with a high risk of losing money rapidly due to leverage. 63% of retail investor accounts lose money when trading CFDs with this provider. You should consider whether you understand how CFDs work and whether you can afford to take the high risk of losing your money.
Stratos Europe Ltd (tradu.com ):
CFDs are complex instruments and come with a high risk of losing money rapidly due to leverage. 63% of retail investor accounts lose money when trading CFDs with this provider. You should consider whether you understand how CFDs work and whether you can afford to take the high risk of losing your money.
Stratos Global LLC (tradu.com ):
Losses can exceed deposits.
Please be advised that the information presented on TradingView is provided to Tradu (‘Company’, ‘we’) by a third-party provider (‘TFA Global Pte Ltd’). Please be reminded that you are solely responsible for the trading decisions on your account. There is a very high degree of risk involved in trading. Any information and/or content is intended entirely for research, educational and informational purposes only and does not constitute investment or consultation advice or investment strategy. The information is not tailored to the investment needs of any specific person and therefore does not involve a consideration of any of the investment objectives, financial situation or needs of any viewer that may receive it. Kindly also note that past performance is not a reliable indicator of future results. Actual results may differ materially from those anticipated in forward-looking or past performance statements. We assume no liability as to the accuracy or completeness of any of the information and/or content provided herein and the Company cannot be held responsible for any omission, mistake nor for any loss or damage including without limitation to any loss of profit which may arise from reliance on any information supplied by TFA Global Pte Ltd.
The speaker(s) is neither an employee, agent nor representative of Tradu and is therefore acting independently. The opinions given are their own, constitute general market commentary, and do not constitute the opinion or advice of Tradu or any form of personal or investment advice. Tradu neither endorses nor guarantees offerings of third-party speakers, nor is Tradu responsible for the content, veracity or opinions of third-party speakers, presenters or participants.

NZDUSD Trade Idea. Key Levels for a Potential NZD/USD Short📉 NZD/USD is trending strongly bearish, and I’ve just posted a new breakdown on TradingView 🎥. The current price action looks overextended, and the pair remains under heavy selling pressure 🔻.
I’m watching for a potential retracement into the Fibonacci 50%–61.8% zone 🔄 — the equilibrium area where I’ll be eyeing a possible short entry 🎯.
The video covers entry ideas, stop-loss placement, and target levels 🎯📍.
⚠️ This is not financial advice — for educational purposes only.
