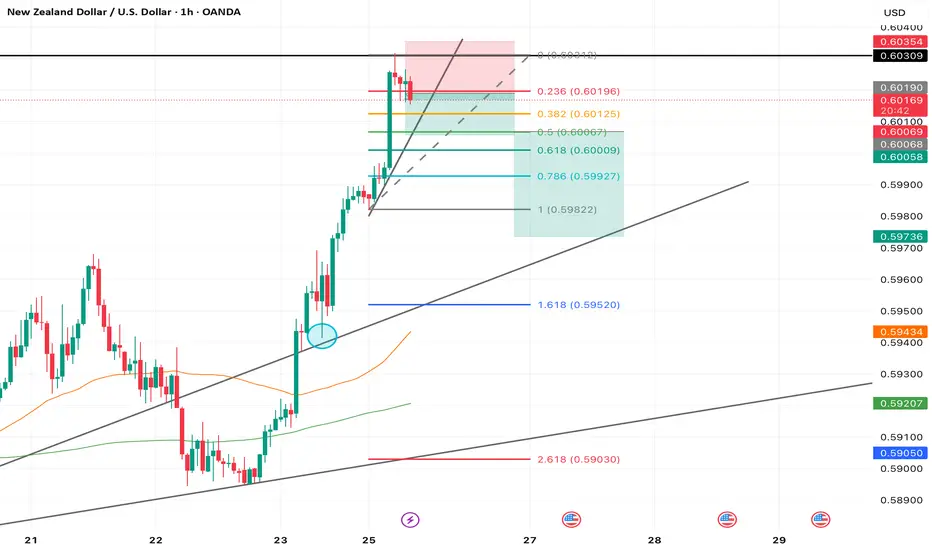
NZDUSD: Bullish Move From Key LevelI observe a solid bullish signal on 📈NZDUSD following a test of significant support,
The price formed an ascending triangle pattern and broke above its neckline.
I anticipate that it will soon reach the 0.6034 level.
USDNZD trade ideas

NZDUSD: Dips as Investors Await RBNZ Decision on May New Zealand Dollar Dips as Investors Await RBNZ Decision on May 28
The New Zealand dollar fell to around $0.6000 on Tuesday, following a volatile Monday session where it briefly reached its highest level in nearly seven months.
Now, all eyes are on the Reserve Bank of New Zealand’s upcoming policy announcement on Wednesday.
The central bank is widely expected to cut interest rates for the sixth time in a row, possibly lowering the official cash rate by 25 basis points to 3.25%.
Market participants will also pay close attention to the bank’s latest economic forecasts, looking for clues about how China Trade Tariffs could affect future growth.
Meanwhile, NZDUSD remains below the Daily Pivot Point, signaling a higher likelihood of further declines ahead of the RBNZ rate decision, as seen in the chart.
You may find more details in the chart!
Thank you and Good Luck!
❤️PS: Please support with a like or comment if you find this analysis useful for your trading day❤️

NZDUSD Range Tightens – Breakout Setup BuildingNZDUSD continues to coil within a contracting triangle, forming a symmetrical wedge bounded by lower highs and higher lows. Price is approaching the resistance zone near 0.6028, with visible indecision and rejection wicks, signaling potential for either breakout or rejection.
Key Levels:
Resistance: 0.6028 (structural ceiling, key pivot)
Support: ~0.5800 (ascending support line of wedge)
Breakout Target (Bullish): 0.6150–0.6200
Breakdown Target (Bearish): 0.5650–0.5550
Scenarios to Watch:
🔹 Bearish Rejection
Price rejects off 0.6028 and returns inside range
Watch for momentum drop and move toward wedge base (0.5800)
Clean breakdown opens path toward April lows (~0.5509)
🔹 Bullish Breakout
Break and hold above 0.6028
Confirmation on 4H close + retest
Opens room for bullish extension toward 0.6150+
Outlook:
Price is nearing apex compression, suggesting breakout is imminent.
Bias is neutral until price breaks out of the current wedge structure.
Expect volatility spike around the 0.6028 test.

NZDUSD Wave Analysis – 27 May 2025- NZDUSD reversed from the pivotal resistance level 0.6020
- Likely to fall to support level 0.5900
NZDUSD currency pair recently reversed down from the pivotal resistance level 0.6020 (which has been reversing the price from November).
The downward reversal from the resistance level 0.6020 formed the daily Shooting Star – which stopped the C-wave of the previous ABC corrections (2).
NZDUSD currency pair can be expected to fall to the next support level 0.5900, which has been reversing the price since the middle of May.

NZDUSD is in the Selling DirectionHello Traders
In This Chart NZDUSD HOURLY Forex Forecast By FOREX PLANET
today GBPUSD analysis 👆
🟢This Chart includes_ (NZDUSD market update)
🟢What is The Next Opportunity on NZDUSD Market
🟢how to Enter to the Valid Entry With Assurance Profit
This CHART is For Trader's that Want to Improve Their Technical Analysis Skills and Their Trading By Understanding How To Analyze The Market Using Multiple Timeframes and Understanding The Bigger Picture on the Charts

NZDUSD 1D Golden Cross, final bull signal.The NZDUSD pair has been trading within a Channel Up pattern that only broke during the early April sell-off and has found Support near its 1D MA50 (blue trend-line) on its recent May consolidation.
As the 1D MACD just formed the 4th Bullish Cross of the year we expect this long with the emerging 1D Golden Cross to be the final buy signal before a long-term correction. Our Target is 0.60900 representing a +4.30% rise, the minimum previous within this pattern.
-------------------------------------------------------------------------------
** Please LIKE 👍, FOLLOW ✅, SHARE 🙌 and COMMENT ✍ if you enjoy this idea! Also share your ideas and charts in the comments section below! This is best way to keep it relevant, support us, keep the content here free and allow the idea to reach as many people as possible. **
-------------------------------------------------------------------------------
💸💸💸💸💸💸
👇 👇 👇 👇 👇 👇

New Zealand dollar sharply lower, RBNZ cut expectedThe New Zealand dollar is sharply lower on Tuesday. In the North American session, NZD/USD is trading at 0.5950, down 0.83% on the day. A day earlier, the New Zealand dollar touched a high of 0.6031, its highest level since Oct. 2024.
The Reserve Bank of New Zealand is widely expected to lower rates by a quarter-point to 3.25% on Wednesday. With little doubt about the decision, investors will be focusing on the Reserve Bank's updated forecasts. The markets are looking at another rate cut in July and perhaps one more later in the year, which would lower the cash rate below 3.0%.
The RBNZ has been dealing with a weak domestic economy and a deteriorating outlook for the global economy due to US President Trump's erratic tariff policy. The RBNZ would like to continue trimming rates and restore consumer and business confidence.
New Zealand's inflation was higher than expected in the first quarter at 2.5%, up from 2.2% in Q4 2024. This is within the Bank's inflation target of 1%-3% and means that inflation levels won't prevent the Bank from lowering rates on Wednesday.
US durable goods orders plunges, consumer confidence surges
In the US, Durable Goods Orders declined by 6.3% m/m in April, after a 7.5% gain in March, which was the fastest pace of growth since July 2020. The soft reading managed to beat the market estimate of -7.8%. The Conference Board Consumer Confidence index, which has fallen steadily this year, surged to 98.0 in May, up from 86.0 in April and blowing past the market estimate of 87.0.
We'll hear from more Federal Reserve members on Wednesday, which could provide some insights into the Fed's rate path. The Fed has adopted a wait-and-see stance and is widely expected to hold rates for a fourth straight time at the next meeting on June 18.
NZD/USD has pushed below support at 0.5978 and is testing 0.5955. Below, there is support at 0.5928
There is resistance at 0.6005 and 0.6028

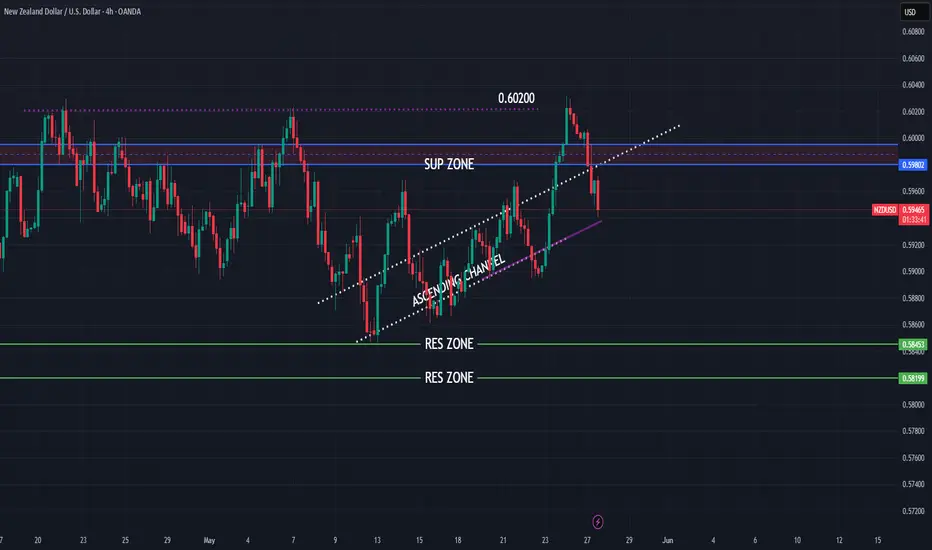
NZDUSD higher falls expecting
OANDA:NZDUSD ASCENDING CHANNEL visible, we are have break of same on 23.5, price is start pushing but on first res zone (0.60200), price is start making reverse.
Currently again in ASCENDING CHANNEL expectations for this week are to see break and bearish push.
SUP zone: 0.59800
RES zone: 0.58450, 0.58200
RBNZ rate decision coming upKeep your eyes on the rate cut tomorrow by the RBNZ and on the NZD reaction to all of it. We have an interesting technical set up building on FX_IDC:NZDUSD . Let's dig in...
MARKETSCOM:NZDUSD
Let us know what you think in the comments below.
Thank you.
77.3% of retail investor accounts lose money when trading CFDs with this provider. You should consider whether you understand how CFDs work and whether you can afford to take the high risk of losing your money. Past performance is not necessarily indicative of future results. The value of investments may fall as well as rise and the investor may not get back the amount initially invested. This content is not intended for nor applicable to residents of the UK. Cryptocurrency CFDs and spread bets are restricted in the UK for all retail clients.

NZD/USD 4 Hr. Real-Time Bias!1). Place Fib tool wherever it works, as theses will be key levels of Buy/Sell entries! 2). Strike a trendline off of whatever works best! 3). Establish a 5-wave/ABC sequence that seems to work! 4). Remember, wave 1 defines directional bias of price action! 5). Wave 5 slightly broke above a previous high, therefore the upward bias is likely still intact! 6). It's all the same price action principles on any timeframe any Instrument! 7). Practice...It's actually quite simple!

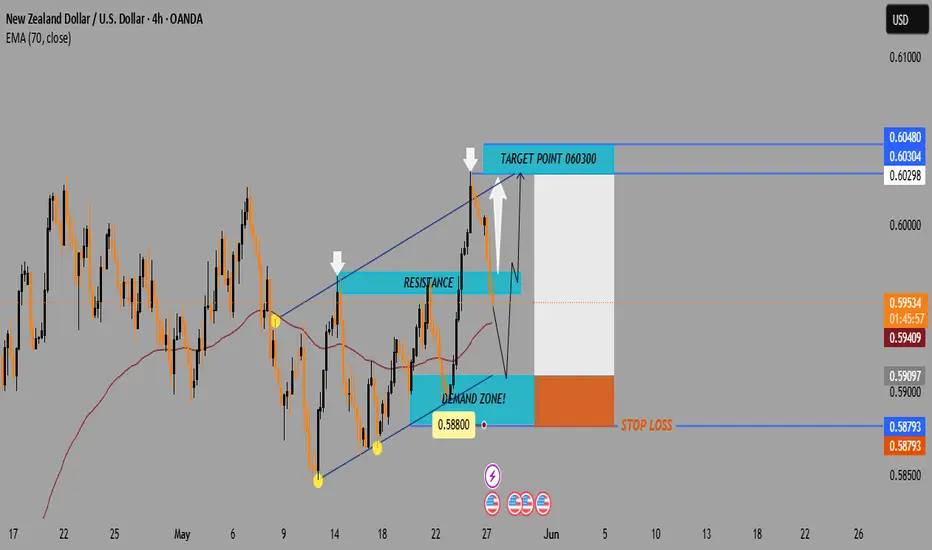
NZD/USD4H Chart Analysis Bullish Reversal Setup from Demand Zone📈 Price: 0.59552
📊 EMA 70: 0.59410 (🟤 Brown Line)
Chart Zones & Key Levels
🔷 Resistance Zone:
🔼 Around 0.60298 – 0.60304
🔹 Price reacted strongly here (🔽 white arrows)
🔹 Acts as a ceiling for now
🟢 Demand Zone:
🔽 Around 0.58800
✅ Buyers stepped in here before
📉 If price drops again, might bounce from here
🟥 STOP LOSS:
❗ 0.58793
🔸 Protects from deeper losses if trend breaks down.
TRADE IDEA
1️⃣ Entry Idea: Wait for a pullback into the Demand Zone
📉⬇️
2️⃣ Bullish Reversal Expected:
⬆️ Bounce toward Target Zone
🎯 Target Point: 0.60300
🟦 Profit zone marked in blue
💸 Good Risk/Reward ratio.
Indicators & Pattern
📐 Wedge Pattern:
🔹 Bullish breakout potential
🔹 Currently respecting the channel
📉 EMA Crossover Area:
🔸 Could act as dynamic support/resistance
🟤 Price hovering around EMA (0.59410)
Summary:
✅ Buy Setup if price holds above 0.58800
🎯 Target: 0.60300
🛑 Stop Loss: 0.58793
⚠️ Watch the price reaction at the Demand Zone for confirmation!
NZDUSD - growth ended with a false breakout NZDUSD makes a false breakout of resistance after strong growth in the Asian session. The dollar is correcting a bit before the news at this time, which may give a chance for the currency pair to correct
Scenario: Strong growth of 2.3% is tempered by a false breakout. The price is not ready to continue rising. Consolidation of the price below 0.60200 may intensify the sell-off and trigger a correction to the support at 0.5969 (0.5)

Qml Advanced liquidity....Same structure at the bottom is being generated again on the opposite side to push the price to the down side .


Momentum builds in GBP/USD and NZD/USD following tariff delayThe U.S. dollar weakened sharply in recent sessions as President Trump's announcement that the proposed 50% tariffs on EU imports will now be delayed until July 9, giving markets temporary relief.
GBP/USD edged toward 1.3600, testing levels last seen three years ago. The RSI sits just under 60, suggesting there’s still room before overbought conditions are reached. Volume has been gradually increasing, potentially reinforcing the strength of the breakout.
Risk-on flows also lifted the Australian and New Zealand dollars. NZD/USD has broken above the Ichimoku cloud and rose 0.62% on the day. Price is well above the Tenkan-sen (blue) and Kijun-sen (red), indicating strong upward momentum. However, the pair is pulling back slightly after the sharp breakout, suggesting short-term consolidation.

NZDUSD 3MONTHS CHARTNZD/USD Interest Rate Differential, 10-Year Bond Yields, and Carry Trade Analysis (May 25–30, 2025)
Current 10-Year Bond Yields
New Zealand 10-Year Bond Yield: 4.70% (as of May 21, 2025) .
US 10-Year Treasury Yield: 4.54% (as of May 22, 2025) .
Interest Rate Differential (IRD)
The yield spread between New Zealand and US 10-year bonds is:4.70%(NZD)−4.54%(USD)=+0.16%
the 4.70% (NZD)−4.54% (USD)=+0.16%
This modest differential slightly favors the New Zealand dollar, creating a limited carry trade opportunity.
Carry Trade Advantage
Investors can borrow USD at lower US rates and invest in higher-yielding NZD assets, earning the 0.16% yield spread.
The strategy is supported by New Zealand’s elevated bond yields despite recent Reserve Bank of New Zealand (RBNZ) rate cuts. However, the narrow spread reduces potential returns compared to higher-yielding currency pairs.
Key Events and Risks (May 25–30, 2025)
RBNZ Monetary Policy Meeting (May 27–28):
Markets expect a 25 basis point rate cut to 3.50% , which could pressure NZD yields lower and narrow the IRD.
Further easing signals may weaken NZD, offsetting carry trade gains.
US Economic Data and Fed Policy:
US inflation data and Fed Chair Powell’s speeches could influence USD strength. Traders currently price in five Fed rate cuts by year-end , which may limit USD upside.
China Trade Dynamics:
New Zealand’s trade ties with China (its largest partner) make NZD sensitive to US-China trade tensions. Progress in tariff negotiations could support NZD .
Summary Table
Metric New Zealand (NZD) United States (USD)
10-Year Bond Yield 4.70% 4.54%
Interest Rate Differential +0.16% (NZD over USD) —
Carry Trade Appeal Modest, but narrowing —
Conclusion
The 0.16% yield advantage for NZD over USD provides a limited carry trade opportunity. However, the upcoming RBNZ rate cut (May 27–28) and potential Fed easing could narrow the spread further. NZD/USD remains vulnerable to:
RBNZ policy: Further rate cuts may reduce NZD’s yield appeal.
US-China trade developments: Escalating tensions could pressure NZD due to its reliance on Chinese trade.
While the carry trade offers marginal gains, traders should prioritize risk management amid volatility from central bank decisions and geopolitical risks.

NZDUSDOvall direction (buy) .I'm only looking for buys and will wait for the market to come to me not chasing it. note this is an analysis and will be valid by confirmations at main zones

NZDUSD TEMPORARY SHORTPURELY TECHNICAL
Though with projections of growth, NZDUSD has been consolidating and trading between $0.60 and $0.58 for over a month. A sell position would be ideal at $0.60 as corroborated by the yellow line of the TDI indicator trending above 63 on the 1hr timeframe. Additionally, $0.60 appears to be the test limit to verify the appetite of potential buyers and so far, there is little insensitive to keep buying above $0.60. Moreover, the daily timeframe shows consistent rejection of prices above $0.60

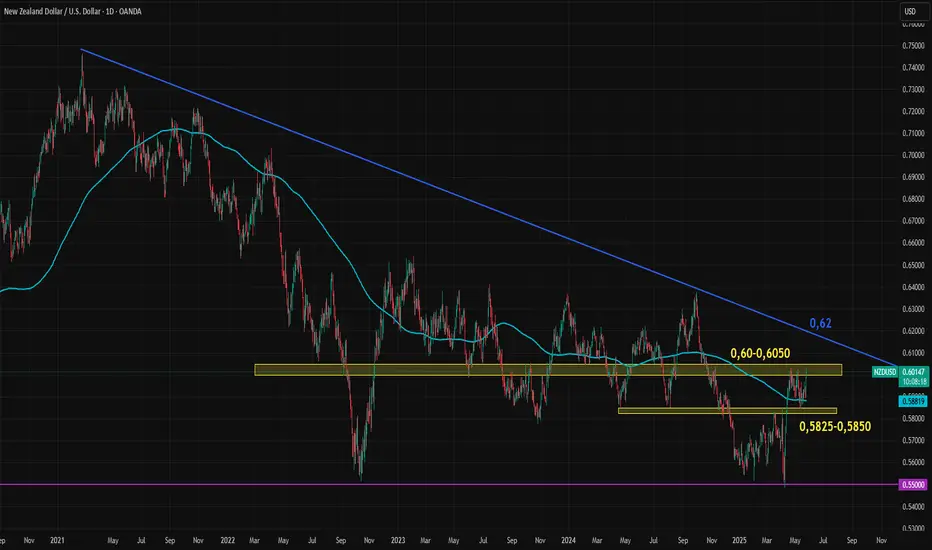
Calm Before the Storm for NZDUSD Ahead of RBNZ and US Data?NZDUSD has been forming a descending triangle pattern since 2020. After the wide swings triggered by the COVID-19 shock, price action has gradually contracted. The downside has been limited near 0.55, while the topside has followed a clear descending trendline, currently sitting around 0.62.
Following a brief surge in April, NZDUSD has entered a short-term flat trend, with two key support and resistance zones capping volatility, potentially the calm before the storm. The 0.5825–0.5850 zone acts as support, while 0.60–0.6050 serves as resistance.
This week, major events including the RBNZ decision, FOMC minutes, U.S. consumer sentiment, PCE, and GDP data could break this low-volatility pattern. A decisive move toward either the upper or lower boundary of the descending triangle may be imminent.
EURUSD,GBPUSD,AUDUSD and NZDUSD possible bounce?Hello traders, this is a complete multiple timeframe analysis of this pair. We see could find significant trading opportunities as per analysis upon price action confirmation we may take this trade. Smash the like button if you find value in this analysis and drop a comment if you have any questions or let me know which pair to cover in my next analysis.

NZDUSD | BUYJust looking at the structure of NZDUSD we can see that price is not changing bullish based on the pattern, 15min chang, so we may target that buyside liquidity.

NZDUSD short ideanzdusd short idea price retested high zone resistance and rejected Im expecting price fall back to fib 0.50 or 0.61 level at least taking short