USDNZD trade ideas

5 Trading Beliefs That Keep Me Untouchable! Do you check off 5?Everyone talks about edge, but few talk about identity.
These are the thoughts I rehearse every day.
Not to hype myself up, but to root myself deeper in who I must become.
These beliefs don’t just sharpen my trading — they shield my mind from chaos.
Welcome to The Part 2
1. Money is not important
It’s fuel, not the fire.
I don’t chase paper — I chase precision.
The second money becomes my reason, fear walks in the door.
But when it’s just the byproduct of execution and clarity?
That’s when I move with power.
> “He who chases the outcome loses the process. He who masters the process controls the outcome.”
2. It’s OK to lose in markets
Losses don’t mean I’m off-track — they mean I’m engaged.
Some trades are tuition.
And I pay them with purpose.
Because every great trader I study… bled first, banked later.
I lose like a winner — with awareness, not emotion.
3. Mental rehearsal is essential
Every night before bed — every morning before I trade —
I see it first.
I walk through the setup, the entry, the hold, the exit.
I rehearse calmness, I rehearse precision.
So when the real trade shows up?
I don’t react.
I recognize.
I’ve already been there.
4. Trading is a game
Serious results. Serious purpose.
But never serious emotion.
A game has rules. Patterns. Levels.
And like every master of any game —
I study, train, and outlast those who play sloppy.
> “The market isn’t trying to beat me. It’s just the board I’m learning to dominate.”
5. I’ve already won before I start
I walk in as the version of me who’s already achieved the outcome.
Not hoping — knowing.
I act from the future I’ve already decided is mine.
And when I operate from that space?
The market bends to meet me there.
> These aren’t just beliefs.
They’re mental armor.
If you’re walking this path to elite performance,
I’m not here to motivate you —
I’m here to remind you of who you already are.
Stay locked in.
If you trade, which one of these are you still working on?

NZDUSD: Weak Market & Bearish Forecast
It is essential that we apply multitimeframe technical analysis and there is no better example of why that is the case than the current NZDUSD chart which, if analyzed properly, clearly points in the downward direction.
Disclosure: I am part of Trade Nation's Influencer program and receive a monthly fee for using their TradingView charts in my analysis.
❤️ Please, support our work with like & comment! ❤️


NZDUSD → A retest of resistance may end in a false breakout.FX:NZDUSD bounces off the upward support line and forms a distribution towards the liquidity zone located above 0.597...
Strong resistance lies ahead at 0.5969 - 0.5975 (liquidity pool). If the current movement continues (distribution), the market will exhaust all its potential and the situation may end in a false breakout. There is no trend as such in the market, the price is inside the flat, and thus bearish pressure may resist the upward price movement.
Resistance levels: 0.5969, 0.5974
Support levels: 0.5932, 0.5917
Against the backdrop of a falling dollar, the currency pair is likely to continue its growth and may test 0.5969 in the short term, but based on the nature of the movement, we can assume that a downward correction will follow.
Best regards, R. Linda!

Heading into overlap resistance?The Kiwi (NZD/USD) is rising towards the pivot, which is overlap resistance, and could reverse to the 1st support.
Pivot: 0.5930
1st Support: 0.5893
1st Resistance: 0.5951
Risk Warning:
Trading Forex and CFDs carries a high level of risk to your capital and you should only trade with money you can afford to lose. Trading Forex and CFDs may not be suitable for all investors, so please ensure that you fully understand the risks involved and seek independent advice if necessary.
Disclaimer:
The above opinions given constitute general market commentary, and do not constitute the opinion or advice of IC Markets or any form of personal or investment advice.
Any opinions, news, research, analyses, prices, other information, or links to third-party sites contained on this website are provided on an "as-is" basis, are intended only to be informative, is not an advice nor a recommendation, nor research, or a record of our trading prices, or an offer of, or solicitation for a transaction in any financial instrument and thus should not be treated as such. The information provided does not involve any specific investment objectives, financial situation and needs of any specific person who may receive it. Please be aware, that past performance is not a reliable indicator of future performance and/or results. Past Performance or Forward-looking scenarios based upon the reasonable beliefs of the third-party provider are not a guarantee of future performance. Actual results may differ materially from those anticipated in forward-looking or past performance statements. IC Markets makes no representation or warranty and assumes no liability as to the accuracy or completeness of the information provided, nor any loss arising from any investment based on a recommendation, forecast or any information supplied by any third-party.

Kiwi H4 | Rising into a multi-swing-high resistanceThe Kiwi (NZD/USD) is rising towards a multi-swing-high resistance and could potentially reverse off this level to drop lower.
Sell entry is at 0.6019 which is a multi-swing-high resistance.
Stop loss is at 0.6095 which is a level that sits above the 161.8% Fibonacci extension.
Take profit is at 0.5854 which is a swing-low support.
High Risk Investment Warning
Trading Forex/CFDs on margin carries a high level of risk and may not be suitable for all investors. Leverage can work against you.
Stratos Markets Limited (tradu.com ):
CFDs are complex instruments and come with a high risk of losing money rapidly due to leverage. 63% of retail investor accounts lose money when trading CFDs with this provider. You should consider whether you understand how CFDs work and whether you can afford to take the high risk of losing your money.
Stratos Europe Ltd (tradu.com ):
CFDs are complex instruments and come with a high risk of losing money rapidly due to leverage. 63% of retail investor accounts lose money when trading CFDs with this provider. You should consider whether you understand how CFDs work and whether you can afford to take the high risk of losing your money.
Stratos Global LLC (tradu.com ):
Losses can exceed deposits.
Please be advised that the information presented on TradingView is provided to Tradu (‘Company’, ‘we’) by a third-party provider (‘TFA Global Pte Ltd’). Please be reminded that you are solely responsible for the trading decisions on your account. There is a very high degree of risk involved in trading. Any information and/or content is intended entirely for research, educational and informational purposes only and does not constitute investment or consultation advice or investment strategy. The information is not tailored to the investment needs of any specific person and therefore does not involve a consideration of any of the investment objectives, financial situation or needs of any viewer that may receive it. Kindly also note that past performance is not a reliable indicator of future results. Actual results may differ materially from those anticipated in forward-looking or past performance statements. We assume no liability as to the accuracy or completeness of any of the information and/or content provided herein and the Company cannot be held responsible for any omission, mistake nor for any loss or damage including without limitation to any loss of profit which may arise from reliance on any information supplied by TFA Global Pte Ltd.
The speaker(s) is neither an employee, agent nor representative of Tradu and is therefore acting independently. The opinions given are their own, constitute general market commentary, and do not constitute the opinion or advice of Tradu or any form of personal or investment advice. Tradu neither endorses nor guarantees offerings of third-party speakers, nor is Tradu responsible for the content, veracity or opinions of third-party speakers, presenters or participants.

NZD/USD 🔹Symbol: NZD/USD
🔹Price: 0.58933
🔹Stop loss: 0.58581
🔹Take profit 1: 0.59452
🔹Take profit 2: 0.59935
🔹Take profit 3: 0.60207
Low risk: % 1.🟢
📊Check your chart before entering.
♦️Check before use to make sure there is no important news.

NZDUSD SELL OPPORTUNITY!!Price is forming a bearish pennant triangle . Technically,Expect a 100 pip drop in price once the recent trend line breaks! A sell opportunity is envisaged. It’s an opportunity the market presents at the moment

NZDUSD Bearish Setup🔍 Market Structure Analysis
WSD Zone Rejection (Top):
Price tapped a wick-based supply & demand (WSD) zone at the top around 0.59486.
That zone also aligns with the previous liquidity grab + mitigation of the OB.
Price is now rejecting that area — forming a lower high (LH) inside the zone → classic sign of distribution.
Rising Channel Break:
Price was rising inside the red ascending channel.
Currently showing bearish intent, with multiple internal BOS (breaks of structure).
If price closes below the channel, that confirms bearish expansion.
Downtrend from Premium Zone:
We're clearly in premium pricing, where institutions prefer to offload longs.
This area also completes a liquidity sweep of prior highs inside the WSD zone.
🧠 Trade Logic (Sell Setup)
🔺 Entry Zone: Inside or after rejection of WSD at 0.59486.
🛑 Stop Loss: Just above the WSD zone and local high.
🎯 Take Profits:
TP1: 0.58669 → Local support + lower WSD zone (reaction zone).
TP2: 0.58398 → Previous liquidity pool and external low.
🧾 R:R = Clean 1:4.5+, textbook SMC setup.
📌 Confluences for Bearish Bias
✅ Multiple WSD zones tested with bearish rejection.
✅ Rising channel inside premium is breaking.
✅ Mitigation + BOS on smaller TF.
✅ News candle marked by blue vertical line may act as final volatility spike before continuation.
✅ Price is near VWAP/50% equilibrium → Ideal for smart money to expand to downside.
🧯 Invalidation Conditions
❌ If price closes above 0.59486, we reassess the bias.
❌ A re-entry into the upper WSD with strong bullish volume invalidates the current bearish flow.
🔮 Forecast Summary
This is a classic distribution setup with liquidity engineered into a WSD zone, now showing early mitigation and markdown signs. Unless major manipulation occurs, expect price to expand toward the 0.58398 low in the next 24–48 hours.

NZD/USD For Bearishyou can go short now
or
wait for pull-back near by entry point and then go short
General trend is down trend
NZD under Pressure
your confirmation for down will be break current support level H1 and back to retest it and then down to targets
have fun :)

NZDUSD - Potential BuyHi Traders,
Here is my view on CMCMARKETS:NZDUSD
BIAS: BUY
Logical Analysis:
From the 9th of April 2025 price has been rising, this makes me believe that the demand of this pair is very high and the BUYER is willing to pay a high price to get some.
Business has been great between 0.59 and 0.60 level.
I am wondering if the demand is till high?
Technical Analysis: see chart
Good Luck.

Continuing with my idea So far so good let’s see if it comes down to this area and respect or pushes through 60-70% believes that this will be respect because nzdusd likes to play around in the area for while before making decent moves that’s why is import to trim in profit angle have a sl

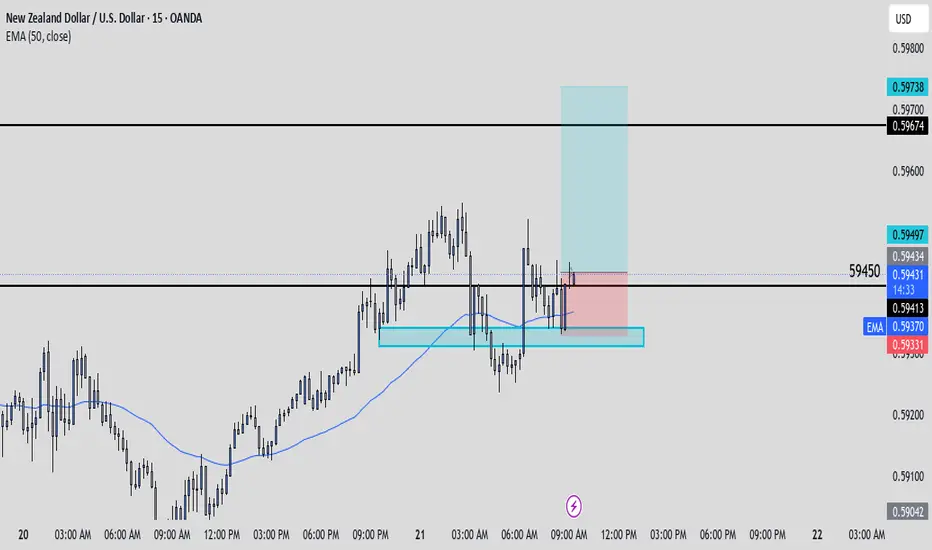
NzdUsd Trade UpdateNU shorts were published earlier with an update on why I was gonna go long! My main set up was to look for price break and retest below but instead price ended up coming back above the 1hr HL where structures were than flipped bullish. Once price CLOSED above 59450 that's when I decided to execute long positions on this pair! Targets were just at the next level with stops below structure! The set up played out well! I closed my profits once price got to the next level above. Solid rr.


NzdUsd Trade Idea/UpdateI published NU shorts and stated my reasoning for looking to go short on the pair. With NU flipping back bullish and closing above 59450 I've decided to go long with stops just underneath the level. IF all goes well we could expect the next level to get hit being at 59674. We'll see what happens.
NzdUsd Trade IdeaNU is currently sitting at a strong level of resistance. We do have a structure shift on the 15m at that level of resistance but the hourly is still showing signs of bulls taking over. In order for me to execute shorts here I'll have to see price break and retest below to confirm the shift in structure. We'll see what happens.

NZDUSD – Short-Term Push Lower ExpectedNZDUSD – Short-Term Push Lower Expected
🔻 Short Bias | 🎯 Target: 0.59060 | ⏱️ 15-Min Outlook
Currently watching this for a drop toward 0.59060. Price appears to be curling and momentum could follow through soon. I'm in the trade already, short setup in motion.
🚨 Not financial advice. Use your own judgment.
#NZDUSD #ForexTrade #PriceAction #ShortSetup #GlobalHorns #TradingView

NZDUSDBuy. market Execution. Trade 1:2. riesgo 0.50%
I went into buy because the market is respecting the buyers' zone.

NZD/USD TRADING PLAN – MAY 21 | RETEST OR CONTINUATION?NZD/USD TRADING PLAN – MAY 21 | RETEST OR CONTINUATION? 🔍
After several steady bullish sessions, NZD/USD is pulling back slightly from the 0.5961 resistance zone. The pair remains within a well-defined ascending channel on the H1 chart and is approaching a key support area around 0.5910 — a zone that could trigger a technical bounce and continuation of the current bullish trend.
🌍 MACRO CONTEXT:
The US Dollar Index (DXY) is showing signs of weakness following disappointing CPI and PPI data. This opens up room for commodity currencies like NZD to recover further.
Meanwhile, New Zealand's domestic consumption data has exceeded expectations, and the RBNZ continues to maintain a stable policy outlook — a medium-term bullish sign for NZD.
Market sentiment is leaning cautiously against the USD, especially as the Fed holds its “no cut but no hike” stance — boosting interest in alternative currencies.
📊 TECHNICAL OUTLOOK (H1):
NZD/USD is trading within an ascending price channel.
EMA 13 is above EMA 34 and EMA 200 — a positive short-term trend signal.
Two important zones to watch today are 0.5910 (key support) and 0.5961 (key resistance).
🎯 TRADE SETUPS FOR TODAY:
✅ SCENARIO A – BUY THE RETEST:
If price tests the 0.5910 zone and shows strong reaction:
BUY ZONE: 0.5910 – 0.5915
SL: 0.5890
TP: 0.5960 → 0.5980 → 0.6000 → 0.6006
→ This zone aligns with ascending channel support + prior FVG → strong rebound probability.
✅ SCENARIO B – BREAKOUT & CONTINUATION:
If price breaks and holds above 0.5961:
BUY SCALP: 0.5965 – 0.5970
SL: 0.5950
TP: 0.5980 → 0.6000 → 0.6006
❌ SCENARIO C – BEARISH BREAKDOWN:
If price fails to hold above 0.5910 and closes H1 candle below it:
SELL SCALP: 0.5900 – 0.5895
SL: 0.5915
TP: 0.5870 → 0.5850 → 0.5820
📌 FINAL THOUGHTS:
NZD/USD is at a critical decision point — this could be a retest before continuation to 0.6000 or the beginning of a deeper drop.
Watch the 0.5910 level closely to determine market direction.
⚠️ Risk management is key — high volatility expected as U.S. PMI data is set for release during today’s NY session.
🧠 Be patient. Let price come to your zone. React, don’t predict.

CURRENT OUTLOOK ON NZDUSDThe pair is in an uptrend and has broken out of its consolidation/correction phase, forming a bullish flag. This suggests the uptrend is likely to continue. We're watching for a potential retest of the broken structure around 0.59276, which could present a buying opportunity.

NZDUSD to find sellers at market price?NZDUSD - 24h expiry
Indecisive price action has resulted in sideways congestion on the intraday chart.
Pivot resistance is at 0.5925.
A move through 0.5875 will confirm the bearish momentum.
The measured move target is 0.5750.
Risk/Reward would be poor to call a sell from current levels.
We look to Sell at 0.5925 (stop at 0.5975)
Our profit targets will be 0.5805 and 0.5750
Resistance: 0.5925 / 0.5950 / 0.5975
Support: 0.5850 / 0.5800 / 0.5750
Risk Disclaimer
The trade ideas beyond this page are for informational purposes only and do not constitute investment advice or a solicitation to trade. This information is provided by Signal Centre, a third-party unaffiliated with OANDA, and is intended for general circulation only. OANDA does not guarantee the accuracy of this information and assumes no responsibilities for the information provided by the third party. The information does not take into account the specific investment objectives, financial situation, or particular needs of any particular person. You should take into account your specific investment objectives, financial situation, and particular needs before making a commitment to trade, including seeking advice from an independent financial adviser regarding the suitability of the investment, under a separate engagement, as you deem fit.
You accept that you assume all risks in independently viewing the contents and selecting a chosen strategy.
Where the research is distributed in Singapore to a person who is not an Accredited Investor, Expert Investor or an Institutional Investor, Oanda Asia Pacific Pte Ltd (“OAP“) accepts legal responsibility for the contents of the report to such persons only to the extent required by law. Singapore customers should contact OAP at 6579 8289 for matters arising from, or in connection with, the information/research distributed.

NZDUSD (LONG)
Weak dollare prediction correlate with this idea
of nzdusd long.
NZDUSD broke out of consolidation and came back to retest the zone of breakout.
which confirm the bull move on NZDUSD.
