NZDUSD..SHORTPrice is nearing a critical level around .
** No setup, no trade. **
For me, a solid plan always comes before any prediction.
*****If the zone is broken and confirmed with a retest, I’ll adjust my plan accordingly for a possible reverse trade.
For detailed entry points, trade management, and high-probability setups, follow the channel:
ForexCSP
USDNZD trade ideas

NZdUSd SHORTMarket structure bearish on HTF 3
Entry at Daily AOi
Weekly Rejection at AOi
Daily Rejection at AOi
Previous Structure point Daily
Around Psychological Level 0.59500
H4 EMA retest
H4 Candlestick rejection
Rejection from Previous structure
Levels 5
Entry 100%
REMEMBER : Trading is a Game Of Probability
: Manage Your Risk
: Be Patient
: Every Moment Is Unique
: Rinse, Wash, Repeat!
: Christ is King.

NZDUSD: Long Trade Explained
NZDUSD
- Classic bullish pattern
- Our team expects retracement
SUGGESTED TRADE:
Swing Trade
Buy NZDUSD
Entry - 0.5869
Stop - 0.5842
Take - 0.5924
Our Risk - 1%
Start protection of your profits from lower levels
Disclosure: I am part of Trade Nation's Influencer program and receive a monthly fee for using their TradingView charts in my analysis.
❤️ Please, support our work with like & comment! ❤️

New Zealand dollar extends losses, inflation expectations expectNew Zealand releases inflation expectations for the first quarter on Friday. Inflation expectations can manifest into actual inflation and are considered a market-mover. Over the past three quarters, inflation expectations have hovered around the 2% level, which is the mid-point of the Reserve Bank of New Zealand's target band of 1%-3%. However, inflation expectations are expected to climb to 2.4% in the second quarter, which could complicate the Reserve Bank's plans to further trim interest rates.
New Zealand consumer inflation rose 2.5% y/y in the first quarter, up from 2.5% in Q4 2024 and above the market estimate of 2.2%. This is comfortably within the RBNZ target band and enabled the Bank to cut rates to 3.5% from 3.75% last month.
The central bank left the door open to further rate cuts at the April meeting, stressing the risk to the New Zealand economy due to rising global trade tensions. New Zealand's largest trading partner is China and the temporary agreement between the US and China to slash tariffs is good news for New Zealand's export sector. The Reserve Bank meets next on May 28.
US retail sales in April posted a weak gain of 0.1% m/m. This was well below the upwardly revised 1.7% gain in March but edged above the market estimate of 0%. There was also soft data from the inflation front. Producer Price inflation declined 0.5% in April, down from the upwardly revised 0% in March and below the market estimate of 0.2%.
The Federal Reserve is virtually certain to hold rates at the June 30 meeting, but there is a 36% chance of a rate cut in July and a 50% likelihood in September, according to CME's FedWatch. Fed Chair Powell has adopted a wait-and-see stance due to the uncertainty over US trade policy. With inflation largely under control and the labor market in solid shape, Powell is no rush to lower rates.
NZD/USD is testing support at 0.5871. Below, there is support at 0.5844
There is resistance at 0.5920 and 0.5947

FRD TRADING Nice playbook short set up. clear pump an dump at the levels.
this is one of the things i love about this pair and aud/usd that the similarities they carry can give you more options to profit.

Potential bullish bounce for the Kiwi?The price has bounced off the pivot, which is an overlap support, and could rise to the 61.8% Fibonacci resistance.
Pivot: 0.5886
1st Support: 0.5861
1st Resistance: 0.5940
Risk Warning:
Trading Forex and CFDs carries a high level of risk to your capital and you should only trade with money you can afford to lose. Trading Forex and CFDs may not be suitable for all investors, so please ensure that you fully understand the risks involved and seek independent advice if necessary.
Disclaimer:
The above opinions given constitute general market commentary, and do not constitute the opinion or advice of IC Markets or any form of personal or investment advice.
Any opinions, news, research, analyses, prices, other information, or links to third-party sites contained on this website are provided on an "as-is" basis, are intended only to be informative, is not an advice nor a recommendation, nor research, or a record of our trading prices, or an offer of, or solicitation for a transaction in any financial instrument and thus should not be treated as such. The information provided does not involve any specific investment objectives, financial situation and needs of any specific person who may receive it. Please be aware, that past performance is not a reliable indicator of future performance and/or results. Past Performance or Forward-looking scenarios based upon the reasonable beliefs of the third-party provider are not a guarantee of future performance. Actual results may differ materially from those anticipated in forward-looking or past performance statements. IC Markets makes no representation or warranty and assumes no liability as to the accuracy or completeness of the information provided, nor any loss arising from any investment based on a recommendation, forecast or any information supplied by any third-party.

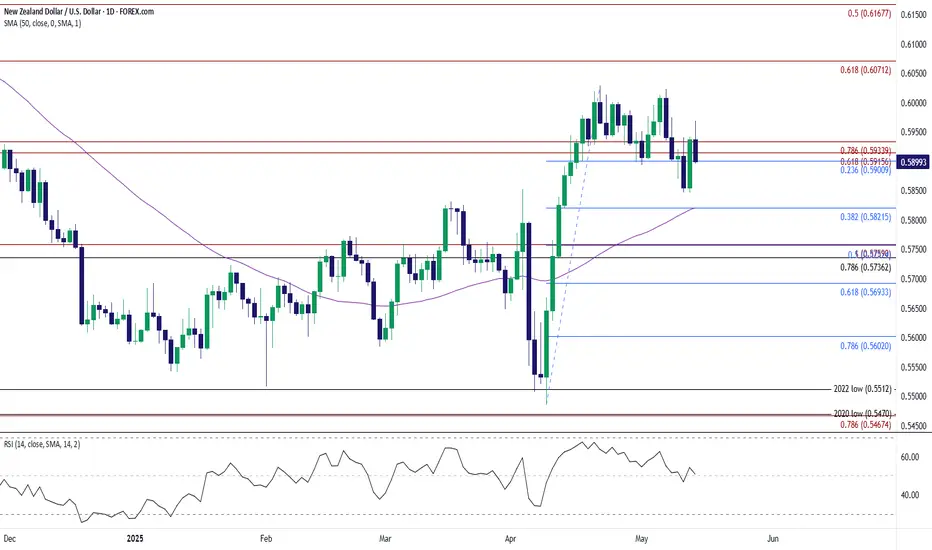
NZD/USD Rebound UnravelsNZD/USD gives back the rebound from earlier this week to hold below the monthly high (0.6023), and lack of momentum to hold above the 0.5900 (23.6% Fibonacci retracement) to 0.5930 (78.6% Fibonacci extension) region may push the exchange rate towards 0.5820 (38.2% Fibonacci retracement).
Next area of interest comes in around 0.5740 (78.6% Fibonacci retracement) to 0.5760 (100% Fibonacci extension), but the recent weakness in NZD/USD may turn out to be temporary should it defend the advance from the weekly low (0.5847).
A move above the monthly high (0.6023) may lead to a test of the April high (0.6029), with a breach above the November high (0.6038) opening up 0.6070 (61.8% Fibonacci extension).
--- Written by David Song, Senior Strategist at FOREX.com
Falling towards 61.8% Fibonacci support?NZD/USD is falling towards the support level which is an overlap support that lines up with the 61.8% Fibonacci retracement and could bounce from this level to our take profit.
Entry: 0.5887
Why we like it:
There is an overlap support level that lines up with the 61.8% Fibonacci retracement,.
Stop loss: 0.5863
Why we like it:
There is a pullback support level.
Take profit: 0.5932
Why we like it:
There is a pullback resistance level.
Enjoying your TradingView experience? Review us!
Please be advised that the information presented on TradingView is provided to Vantage (‘Vantage Global Limited’, ‘we’) by a third-party provider (‘Everest Fortune Group’). Please be reminded that you are solely responsible for the trading decisions on your account. There is a very high degree of risk involved in trading. Any information and/or content is intended entirely for research, educational and informational purposes only and does not constitute investment or consultation advice or investment strategy. The information is not tailored to the investment needs of any specific person and therefore does not involve a consideration of any of the investment objectives, financial situation or needs of any viewer that may receive it. Kindly also note that past performance is not a reliable indicator of future results. Actual results may differ materially from those anticipated in forward-looking or past performance statements. We assume no liability as to the accuracy or completeness of any of the information and/or content provided herein and the Company cannot be held responsible for any omission, mistake nor for any loss or damage including without limitation to any loss of profit which may arise from reliance on any information supplied by Everest Fortune Group.

Nzdusd As we can see we hv 3 time frame on a down trend so we follow de trend though am posting a little bit late but is just tp confirm with ur own entry

NZDUSD - NEW BREAKOUT !Hello Traders !
On Monday 12 May, The NZDUSD reached the support level (0.5853 - 0.5830).
The price broke the lower high (change of character).
So, I expect a bullish move🚀
_______________
TARGET: 0.60030🎯

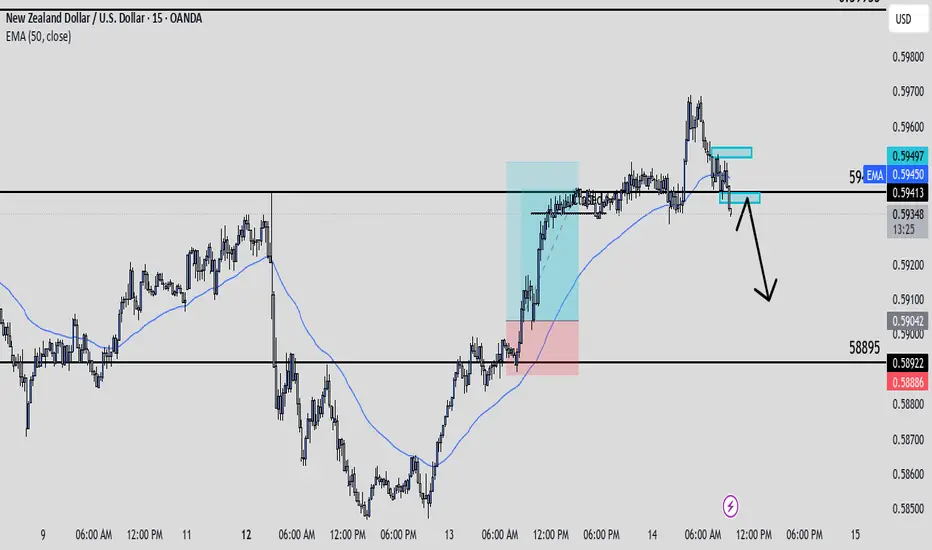
NzdUsd Trade IdeaAfter catching some longs on NU yesterday we could be getting into some shorts this morning. Price managed to hit 59450 yesterday as expected but now we have smaller and higher time frames closing below the level. I'll personally be waiting on price to pullback and retest 59450 before executing any shorts on the pair for a 1:3rr. The retest would confirm our shift in structure. We'll see what happens.
NZDUSD Short Setup📘 Educational Caption for Your Trading Chat
🔻 NZD/USD Short Setup (4H Supply Zone Trade)
I'm placing a sell limit at 0.59850, based on a return to a clean 4H supply zone after a recent Break of Structure (BOS) and Change of Character (COC).
📉 Entry: 0.59850
🎯 Take Profit: 0.59850
🛡️ Stop Loss: 0.60372
⚖️ Risk-Reward Ratio: ~1:3.1
This setup follows a Smart Money strategy — entering short after price returns to a premium zone post-displacement. The supply area was created by aggressive selling, making it a high-probability reaction zone.
⚠️ Disclaimer: This is for educational purposes only. Not financial advice. Always manage your own risk and trade responsibly.

NZDUSD SELL TRADE PLAN🔥 Pair: NZD/USD | Date: 13 May 2025
📋 Plan Overview
Type Direction Confidence R:R Status
Intraday SELL 🔶 87% ~1:3.0 🟢 Active Plan
📈 Market Bias & Type
* Market Bias: Bearish
* Type: Continuation sell setup from premium retracement zones (H1/H4 aligned with D1 lower high structure)
* Structure: Lower highs/lows forming post D1 rejection + bearish order flow
🔰 Confidence Level: 87% High Probability
Element Weight
HTF Bias (D1 + H4) ✅ 25%
OB + FVG Confluence (H1/H4) ✅ 20%
Liquidity Sweeps ✅ 15%
H1 Candle Structure ✅ 15%
Clean Range to Downside ✅ 12%
Volume + Session Context ✅ 10%
📍 Entry Zones
🟥 Primary Sell Zone: 0.5905 – 0.5922
* Location: H1 Order Block + H4 Imbalance + Pre-sweep rejection base
* Reason: Clean OB + EQH sweep; ideal reaction + compression zone
🟥 Secondary Sell Zone: 0.5938 – 0.5953
* Location: D1 FVG edge + Final stop-hunt zone above major EQHs
* Note: Only if price aggressively sweeps primary with no rejection
❗ Stop Loss (SL)
* Above Secondary Zone high: 0.5965
* Reason: Protects against deep liquidity sweep beyond unmitigated OBs
🎯 Targets
TP Level Price Reason
🎯 TP1 0.5860 Mid-range H1 structure zone
🎯 TP2 0.5828 H4 FVG low + clean inefficiency
🎯 TP3 0.5790 D1 range base + March 2024 EQ lows
🧠 Management Strategy
* Risk: 0.5% max if only Primary; if both zones possible, staggered 0.25% each
* Scaling: Allow partial fill on reaction candles
* Breakeven: Secure at TP1 with tight trailing thereafter
* Re-Entry: Only if price returns to zone post-BOS + lower high
⚠️ Confirmation Checklist (REQUIRED)
Confirmation Status
H1 Bearish Engulfing Awaiting
Volume Spike (US) Awaiting
EQH Sweep Liquidity ✅ Seen
Rejection Candle Awaiting
London/NY Session Preferred for activation
⏳ Validity
* H1 Setup Validity: 12–16 hours from issuance
* H4 Structure Alignment Valid: up to 48h
❌ Invalidation
* Price closes firmly above 0.5965 on H1 candle or
* Market structure shifts bullish with BOS + HL + high-volume breakout
🌐 Fundamental & Sentiment Snapshot
* USD: Mildly strong due to recent NFP and CPI beats
* NZD: Weak macro prints, fading RBNZ tone
* Risk Sentiment: Slight risk-off tone — favoring USD strength
📋 Final Trade Summary
* Trade Type: Structured HTF-aligned intraday/swing sell
* Plan Logic: Sell retracement into key supply zones, following multi-timeframe bearish structure
* Trigger Requirement: Tap + confirmation only (NOT pre-entry)

NZD/USD SELL SETUP – May 14, 2025🔻 Entry: 0.59641
🎯 TP: 0.59291 (🟢 35 PIPS)
🛑 SL: 0.59760 (🔴 12 PIPS)
⚖️ RRR: 1:3 ✅
📍 Confluences:
🔹 FVG Fill – Clean imbalance filled on 1H
🔹 61.8% Fib Level – Perfect alignment with resistance
🔹 H1 Supply Zone – Holding firm with rejection wicks
💰 Risk Mindfully 🔒 low risk, clean setup
🧠 Invalidation: If price closes above 0.59760 on 1H, consider cutting or reevaluating 🔄
⏰ Best to monitor during NY session for continuation. Malaysian Time 8-10pm.
📛 No chasing. No FOMO. Precision only.

NZD/USD Bulish trde Reason behind the technical - This market following a bullish structure for long time, last month on April 2025 gone side sidewise and slowly fall for the nearest support zone at 0.58500. Touched and started to follow the bullish structure once again. The next nearest bullish zone at 0.640000.
That's all for this NZD/USD TRADE

NzdUsd Trade IdeaNU has a solid level of support at 58895 where price has respected multiple times in the past. We even had a clean break and retest to the downside below 58895. With smaller time frames shifting bullish and pushing back above 58895 with a solid retest and bullish candle I've decided to go long. I'll be trading level to level with a 1:3rr. We'll see what happens. If the set up can go to plan then we could expect price to tap back into 59450 once again.

NZDUSD ICT ConceptI would like
Purge on BSL
Displacement with Ideal FVG
50% Retracement
Enter and aim for inefficiently/Sell Side

NZD/USD SENDS CLEAR BEARISH SIGNALS|SHORT
Hello, Friends!
Bearish trend on NZD/USD, defined by the red colour of the last week candle combined with the fact the pair is overbought based on the BB upper band proximity, makes me expect a bearish rebound from the resistance line above and a retest of the local target below at 0.586.
Disclosure: I am part of Trade Nation's Influencer program and receive a monthly fee for using their TradingView charts in my analysis.
✅LIKE AND COMMENT MY IDEAS✅

NZDUSD Short BUYERS' LAST BREATH — THE SWITCH IS IN
Pair: NZDUSD
Timeframe: 4H (pullback in a Daily downtrend)
Bias: Short
Setup: SnR retest sell, Potential 5R setups
Daily trend is down — this 4H move was just a pullback.
I watched the buyers push from support with weak momentum. First sign? Volume dries up, price stalls — buyer exhaustion kicks in. But no real sellers stepped in yet — they waited. That's what made it deadly.
Then came the final buyer push. One last attempt to save the move.
But instead of strength, it exposed weakness — and the sellers took over. Fast. Clean break, shift in pressure, game flipped.
Entry & Risk:
Entry: After the failed buyer push and a clean shift in momentum.
Stop: Just above the last push (invalidates if price gets back there).
Target: Back into the daily move — lower liquidity zones.
What I’m Trading Here?
Trap logic: Buyers thought they had it — they didn’t.
Structure shift: Reclaim confirms control switched.
Daily momentum: This is a continuation play — not a reversal.
I'm already short

NZD/USD "Kiwi" Forex Vault Heist Plan!🌟 Yo, what's good? Salaam! Ciao! Konnichiwa! 🌟
Dear Cash Snatchers & Market Bandits, 🤑💰💸😎
Get ready to raid the NZD/USD "Kiwi" Forex Vault with the slickest 🔥Thief Trading Style🔥 Our tech-fueled, fundamental-backed heist plan is locked and loaded for a long-entry score. Stick to the chart’s sneaky blueprint and aim to slip out near the Red Zone—a high-stakes trap where overbought vibes, consolidation, and bearish bandits lurk. 🏆💸 Grab your loot and treat yourself, you sly foxes! 💪🎉
- 📈 Entry Point: The heist’s ON! 🕵️♂️ Lay low for the MA pullback at Institutional Buy Zone 1 (0.57700) or Buy Zone 2 (0.56000), then pounce for juicy bullish profits! 🚀
- 🛑 Stop Loss: Yo, ears up! 🗣️ If you’re setting a buy stop order, don’t touch that stop loss ‘til the breakout pops off. 📍 Stash it at the closest swing low on the 4H: Buy Zone 1 SL at 0.56500, Buy Zone 2 SL at 0.54500. Size it to your risk, lot, and multi-order game plan. Mess around, and you’re toast! 🔥
- 🎯 Target: Shoot for 0.62500 or ghost out early with the goods. 💰
- 👀 Scalper Crew: Long-side scalping only! Got deep pockets? Dive in. Tight budget? Roll with swing traders and slap on a trailing SL to shield your stash. 🧲
- 📊 Why It’s Lit: The Kiwi’s bullish run is powered by fundamentals, macro trends, COT reports, quant analysis, market vibes, and intermarket signals. Scope the full scoop from legit sources! 🌍🔗
⚠️ Heads-Up: News drops can flip the game! 📰 Stay sharp:
- Dodge new trades when news hits.
- Slap trailing stop-losses on to lock profits and cover your back.
💖 Fuel the heist! 💥 Smash that Boost Button to power up our Thief Trading Style squad. Swipe profits daily like a pro and roll with the slickest crew! 🏆🤝🚀 Catch you on the next big score, bandits! 🤑🐱👤😎

NZDUSD SELL SETUPPrice broke out of my sell zone in the 1 hr so am waiting for a retracement into the zone
Meanwhile i spotted another BB in the lower TF am waiting for small retracement into the zone to take a scalp sell
NOTE: I WILL STILL WAIT FOR OTHER CONFLUENCES BECAUSE TAKING THIS TRADE
ENTER AT UR OWN RISK ❗❗❗❗❗❗

NZD/USD Daily AnalysisPrice has printed multiple rejections of the 0.6000 zone over April and May 2025 whilst at the same time finding support at 0.5900.
Finally the market has seen a close below 0.5900 after printing a bearish engulfing candle.
We may see a pullback and retest of 0.5900 and a further move lower. However if we close above 0.5900 then we have likely to have seen a false break.
This is an idea of what may happen. Always trade with a profitable strategy and good risk management.

400 pips drop on NZDUSD in the coming weeks ??As the Dollar Index TVC:DXY strengthens, most of the major FX pairs are gearing up for massive drop or have started dropping already. One of these pairs is OANDA:NZDUSD which is about to drop 400 pips in the coming days.
OANDA:NZDUSD having formed a Double Top chart pattern, the bullish momentum of the TVC:DXY has caused a break of the neckline of the above mentioned chart pattern.
Below are the expected targets for this setup
TP1: 0.57
TP2: 0.55
SL: 0.60
Kindly support this analysis to enable it reach to other people, and do comment your thoughts.
