SELL NZDUSDThe market is ripe this week, presenting opportunities for the mindful. I see a bearish pennant, I would like to see price fall to 0,59620
USDNZD trade ideas

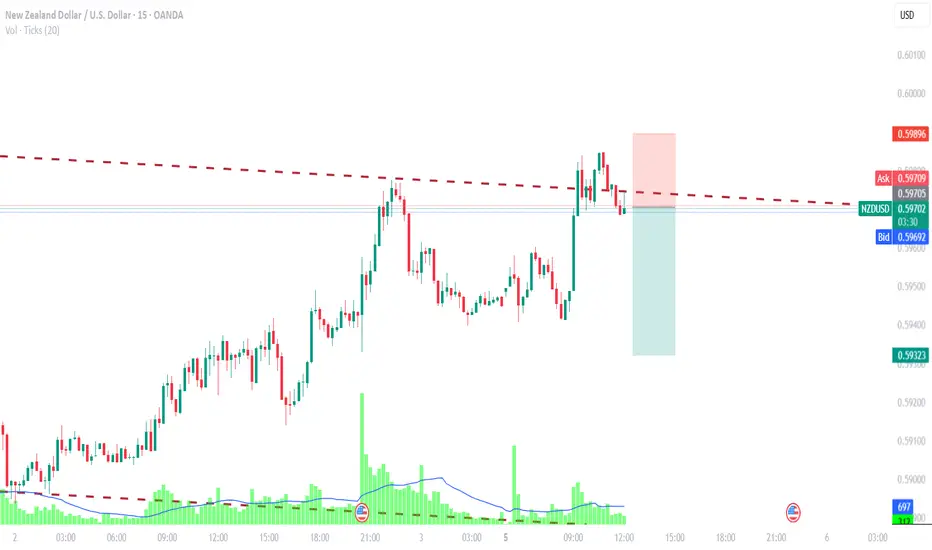
NZDUSDOur previous trade was on **EURUSD**, and it’s just a few pips away from hitting the **Take Profit** level — even though I shared it only 5 minutes ago! 🙂
From a **correlation perspective**, I’ve identified a similar opportunity on **NZDUSD** in the same direction. That’s why I’ve opened a **Buy** trade on NZDUSD as well.
🔍 **Criteria:**
✔️ Timeframe: 15M
✔️ Risk-to-Reward Ratio: 1:1.50
✔️ Trade Direction: Buy
✔️ Entry Price: 0.59722
✔️ Take Profit: 0.59923
✔️ Stop Loss: 0.59588
🔔 **Disclaimer:** This is not financial advice. It's a trade I’m taking based on my own system, shared purely for educational purposes.
📌 If you're also interested in systematic and data-driven trading strategies:
💡 Don’t forget to follow the page and subscribe to stay updated on future analyses.

NZDUSD to continue in the upward move?NZDUSD - 24h expiry
Indecisive price action has resulted in sideways congestion on the intraday chart.
Momentum is flat, highlighting the lack of clear direction.
Risk/Reward would be poor to call a buy from current levels.
A move through 0.6000 will confirm the bullish momentum.
The measured move target is 0.6075.
We look to Buy at 0.5950 (stop at 0.5900)
Our profit targets will be 0.6050 and 0.6075
Resistance: 0.6000 / 0.6025 / 0.6050
Support: 0.5950 / 0.5925 / 0.5900
Risk Disclaimer
The trade ideas beyond this page are for informational purposes only and do not constitute investment advice or a solicitation to trade. This information is provided by Signal Centre, a third-party unaffiliated with OANDA, and is intended for general circulation only. OANDA does not guarantee the accuracy of this information and assumes no responsibilities for the information provided by the third party. The information does not take into account the specific investment objectives, financial situation, or particular needs of any particular person. You should take into account your specific investment objectives, financial situation, and particular needs before making a commitment to trade, including seeking advice from an independent financial adviser regarding the suitability of the investment, under a separate engagement, as you deem fit.
You accept that you assume all risks in independently viewing the contents and selecting a chosen strategy.
Where the research is distributed in Singapore to a person who is not an Accredited Investor, Expert Investor or an Institutional Investor, Oanda Asia Pacific Pte Ltd (“OAP“) accepts legal responsibility for the contents of the report to such persons only to the extent required by law. Singapore customers should contact OAP at 6579 8289 for matters arising from, or in connection with, the information/research distributed.

NZY vs USD ChartBullish trend in the NZY vs USD chart and setting my trade using candlesticks dow theory

NZD/USD DoubBottom Breakout: Bulls Eyeing Higher LevelsThe NZD/USD chart showcases a classic double bottom pattern, indicating a potential shift from a downtrend to an uptrend. The price has broken above the neckline resistance, confirming the pattern and suggesting bullish momentum. Volume indicators support the breakout, and momentum oscillators like RSI and MACD are trending upwards, reinforcing the bullish bias. Traders should watch for a retest of the breakout zone as support before considering entry points. Potential targets can be projected based on the height of the double bottom formation.

Trade outlook explain nzdusdTrade outlook explain nzdusd = 5-5-25
Trade idea for the week explained for my friend

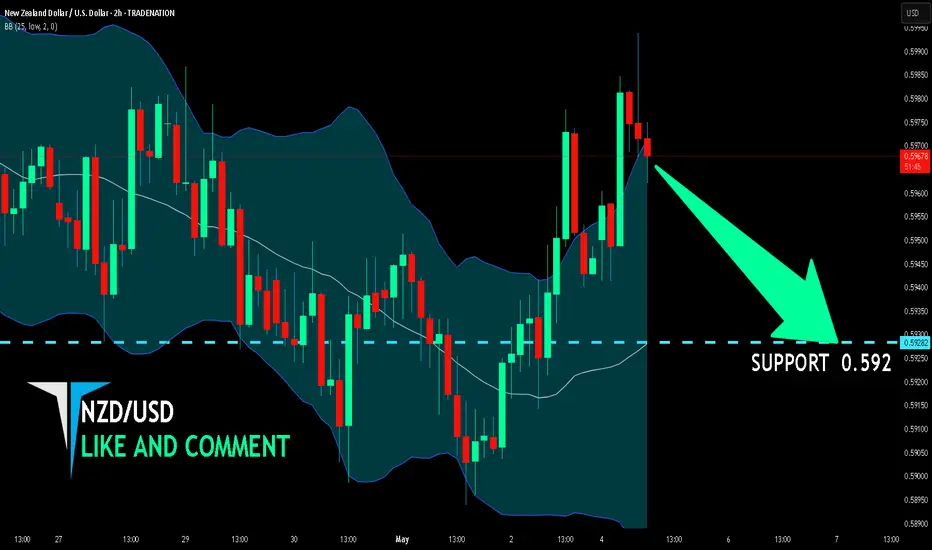
NZD/USD BEARISH BIAS RIGHT NOW| SHORT
Hello, Friends!
NZD/USD is trending down which is obvious from the red colour of the previous weekly candle. However, the price has locally surged into the overbought territory. Which can be told from its proximity to the BB upper band. Which presents a classical trend following opportunity for a short trade from the resistance line above towards the demand level of 0.592.
Disclosure: I am part of Trade Nation's Influencer program and receive a monthly fee for using their TradingView charts in my analysis.
✅LIKE AND COMMENT MY IDEAS✅
NZDUSD - LONG - Trade plan - 1hr TFNZD is fundamentally strong as compared to DXY according to last weeks data
its a buy call for NZDUSD, 1hr TF, Entry at 0.382(0.59464)
SL at 0.59149 (Major Support 0.58936)
TP 1= 0.59788
TP 2=0.60004
TP 3= 0.60298
Make your trade breakeven after TP 1 is hit,
Make your SL at TP1 when TP 2 is hit and so on.

NZDUSD SEEL TRADE
Sell ENTRY: 0.59846
SL: 0.60033
TP: 0.59011
NZDUSD is at a very important Resistance level. So Sell opportunity is necessary.
Comment your opinion below please 🙏


NZD/USD🔹Symbol: NZD/USD
🔹Price: 0.59403
🔹Stop loss: 0.59073
🔹Take profit 1: 0.59781
🔹Take profit 2: 0.60140
🔹Take profit 3: 0.60411
🔹Low risk: % 1.5 🟢
📊 Check your chart before entering.
Check before use to make sure there is no important news.

Real #009 NZDUSD Moving Average Sell 1208SGT 05052025Selling NZDUSD on tradingview, oanda mt4 and ftmo 10k.
This time, instead of waiting for price to come back again to the stabbing area, I just sell as a "confirmation".
I think that as long as I could reconcile with myself that I am selling into "value", I would place a position in.
1210SGT 05052025
Good chance on NZDUSD NZDUSD in down trend at 4H TF , and it reached the key level on 4H TF
if we move to 1H TF we will see that the pair completed wave cycle
there is a big chance in selling the pair from current price with 2: 2.3 RR
Sell price around 0.5980
Target : 0.5820
Stoploss : 0.6040

Bullish bounce off pullback support?The Kiwi (NZD/USD) is falling towards the pivot and could bounce to the pullback resistance.
Pivot: 0.5818
1st Support: 0.5690
1st Resistance: 0.6025
Risk Warning:
Trading Forex and CFDs carries a high level of risk to your capital and you should only trade with money you can afford to lose. Trading Forex and CFDs may not be suitable for all investors, so please ensure that you fully understand the risks involved and seek independent advice if necessary.
Disclaimer:
The above opinions given constitute general market commentary, and do not constitute the opinion or advice of IC Markets or any form of personal or investment advice.
Any opinions, news, research, analyses, prices, other information, or links to third-party sites contained on this website are provided on an "as-is" basis, are intended only to be informative, is not an advice nor a recommendation, nor research, or a record of our trading prices, or an offer of, or solicitation for a transaction in any financial instrument and thus should not be treated as such. The information provided does not involve any specific investment objectives, financial situation and needs of any specific person who may receive it. Please be aware, that past performance is not a reliable indicator of future performance and/or results. Past Performance or Forward-looking scenarios based upon the reasonable beliefs of the third-party provider are not a guarantee of future performance. Actual results may differ materially from those anticipated in forward-looking or past performance statements. IC Markets makes no representation or warranty and assumes no liability as to the accuracy or completeness of the information provided, nor any loss arising from any investment based on a recommendation, forecast or any information supplied by any third-party.

NzdUsd Trade IdeaWith NU still trading between 59450 and 58895 I'll be personally waiting on smaller time frames to either create bearish structures below 59459 to confirm a range continuation or wait for bullish structures to form above 59450 before executing any longs. I'll be looking for a 1:2.5 - 1:3rr for both set ups.

Buy Nzdusd if break the level of Trend lineBuy Nzdusd if break the level of Trend line
* due to usd Week in this week

NZDUSD Potential DownsidesHey Traders, in today's trading session we are monitoring NZDUSD for a selling opportunity around 0.59650 zone, NZDUSD is trading in a downtrend and currently is in a correction phase in which it is approaching the trend at 0.59650 support and resistance area.
Trade safe, Joe.

NZD/USD For Bullishwait for pull-back near by entry point and then go long
general trend is up trend
have fun :)

Kiwi H1 | Rising into an overlap resistanceThe Kiwi (NZD/USD) is rising towards an overlap resistance and could potentially reverse off this level to drop lower.
Sell entry is at 0.5946 which is an overlap resistance that aligns with the 38.2% Fibonacci retracement.
Stop loss is at 0.5995 which is a level that sits above the 61.8% Fibonacci retracement and a multi-swing-high resistance.
Take profit is at 0.5897 which is a multi-swing-low support.
High Risk Investment Warning
Trading Forex/CFDs on margin carries a high level of risk and may not be suitable for all investors. Leverage can work against you.
Stratos Markets Limited (tradu.com):
CFDs are complex instruments and come with a high risk of losing money rapidly due to leverage. 63% of retail investor accounts lose money when trading CFDs with this provider. You should consider whether you understand how CFDs work and whether you can afford to take the high risk of losing your money.
Stratos Europe Ltd (tradu.com):
CFDs are complex instruments and come with a high risk of losing money rapidly due to leverage. 63% of retail investor accounts lose money when trading CFDs with this provider. You should consider whether you understand how CFDs work and whether you can afford to take the high risk of losing your money.
Stratos Global LLC (tradu.com):
Losses can exceed deposits.
Please be advised that the information presented on TradingView is provided to Tradu (‘Company’, ‘we’) by a third-party provider (‘TFA Global Pte Ltd’). Please be reminded that you are solely responsible for the trading decisions on your account. There is a very high degree of risk involved in trading. Any information and/or content is intended entirely for research, educational and informational purposes only and does not constitute investment or consultation advice or investment strategy. The information is not tailored to the investment needs of any specific person and therefore does not involve a consideration of any of the investment objectives, financial situation or needs of any viewer that may receive it. Kindly also note that past performance is not a reliable indicator of future results. Actual results may differ materially from those anticipated in forward-looking or past performance statements. We assume no liability as to the accuracy or completeness of any of the information and/or content provided herein and the Company cannot be held responsible for any omission, mistake nor for any loss or damage including without limitation to any loss of profit which may arise from reliance on any information supplied by TFA Global Pte Ltd.
The speaker(s) is neither an employee, agent nor representative of Tradu and is therefore acting independently. The opinions given are their own, constitute general market commentary, and do not constitute the opinion or advice of Tradu or any form of personal or investment advice. Tradu neither endorses nor guarantees offerings of third-party speakers, nor is Tradu responsible for the content, veracity or opinions of third-party speakers, presenters or participants.

The #1 Step To Risk ManagementRisk management is very important for you to understand.
Because this will help you become a professional trader.
But i need to share something personal about me before
we dive into the "The #1 Step To Risk Management".
One thing about me is that i love being a leader.
Even looking for people that enjoy being leaders is what i like.
Sometimes i look at certain friends of mine.This particular person
i am thinking about was a good friend.
Now the problem is that this friend of mine never grew up
to like leadership.If you want to be my friend you
have to love leadership.
Because once you become a leader you wont
be scared to keep people accountable.
I was reading a book on real estate AMEX:IYR
And the writer said he hired his elder brother to collect rent.
Listen if you need help collecting rent - then you
are sacred to keep people accountable.Now in some situations
you will to be in a position of insurance.This means you have
to screen the tenant before you rent out the property.
==
When you look at this forex pair OANDA:NZDUSD
Notice that it does not follow the rocket booster strategy
at all.But its in a trending position.
This means it is a good dip buy.Coming from a "multi-day runner" .
To enter this trade reset your simulation trading account
and then put a margin level of ONLY X10 for forex
trading.
Place you buy position then see what happens.
Your #1 Step To Risk management is to not risk too much.
Do not risk more than 10% on your down payment for the margin.
Also learn the right strategy.
Using the MACD to confirm the trade.I will do a demonstration
video on how to do that for now enter a trade in the simulation account.
==
Rocket boost this content to learn more.
Disclaimer:Trading is risky please learn risk management and
profit taking strategies.Also feel free to use a simulation
trading account before you trade with real money.

Descending TriangleThe price has broken out of the descending channel and made a sharp pullback in the form of a trendline, and now we have a smaller pullback, this is clear confirmation of a bearish impulse
Time to go short
WE ONLY TRADE PULLBACKS

Fri 2nd May 2025 NZD/USD Daily Forex Chart Sell SetupGood morning fellow traders. On my Daily Forex charts using the High Probability & Divergence trading methods from my books, I have identified a new trade setup this morning. As usual, you can read my notes on the chart for my thoughts on this setup. The trade being a NZD/USD Sell. Enjoy the day all. Cheers. Jim

Potential bearish drop?NZD/USD is rising towards the resistance level which is an overlap resistance and could drop from this level to our take profit.
Entry: 0.5936
Why we like it:
There is an overlap resistance level.
Stop loss: 0.5997
Why we like it:
There is a pullback resistance level.
Take profit: 0.5829
Why we like it:
There is a pullback support level that aligns with the 38.2% Fibonacci retracement.
Enjoying your TradingView experience? Review us!
Please be advised that the information presented on TradingView is provided to Vantage (‘Vantage Global Limited’, ‘we’) by a third-party provider (‘Everest Fortune Group’). Please be reminded that you are solely responsible for the trading decisions on your account. There is a very high degree of risk involved in trading. Any information and/or content is intended entirely for research, educational and informational purposes only and does not constitute investment or consultation advice or investment strategy. The information is not tailored to the investment needs of any specific person and therefore does not involve a consideration of any of the investment objectives, financial situation or needs of any viewer that may receive it. Kindly also note that past performance is not a reliable indicator of future results. Actual results may differ materially from those anticipated in forward-looking or past performance statements. We assume no liability as to the accuracy or completeness of any of the information and/or content provided herein and the Company cannot be held responsible for any omission, mistake nor for any loss or damage including without limitation to any loss of profit which may arise from reliance on any information supplied by Everest Fortune Group.
