NZDUSD: Rejection possible on the 1D MA200.NZDUSD is bullish on its 1D technical outlook (RSI = 60.829, MACD = 0.001, ADX = 25.517) as it is on the bullish wave of the 8 month Channel Down. The trend should be turning bearish soon however as not only is the pair approaching the top of the Channel Down but also the 1D MA200 and has completed a +6.18% increase like the June 12th 2024 high did. The 1D RSI is already ranged and is losing momentum so this may be the perfect level to sell. The trade is short, aiming at the S1 level (TP = 0.55250).
See how our prior idea has worked out:
## If you like our free content follow our profile to get more daily ideas. ##
## Comments and likes are greatly appreciated. ##
USDNZD trade ideas

NZDUSD: Bearish Continuation & Short Trade
NZDUSD
- Classic bearish formation
- Our team expects fall
SUGGESTED TRADE:
Swing Trade
Sell NZDUSD
Entry Level - 0.5838
Sl - 0.5886
Tp - 0.5743
Our Risk - 1%
Start protection of your profits from lower levels
Disclosure: I am part of Trade Nation's Influencer program and receive a monthly fee for using their TradingView charts in my analysis.
❤️ Please, support our work with like & comment! ❤️

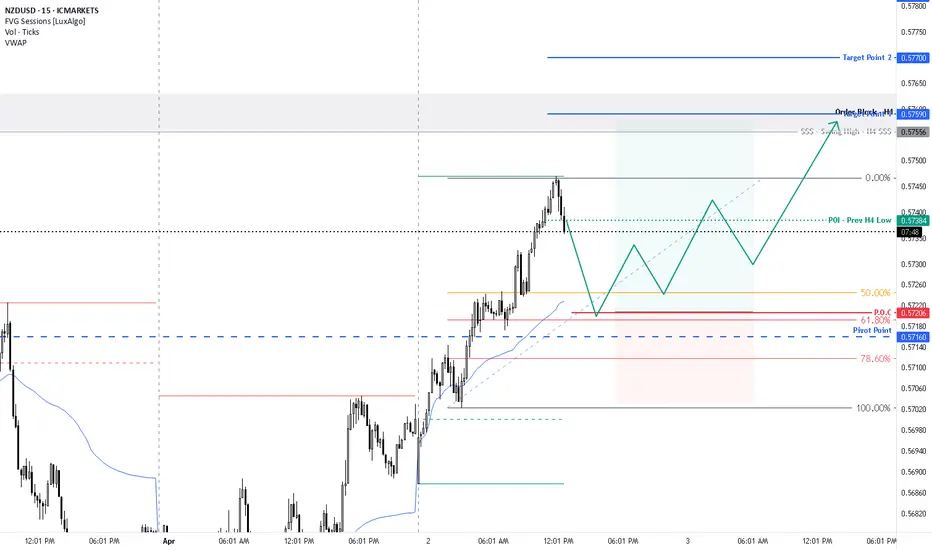
NZD/USD For Bullishwait for pull-back near entry point or FVG and then go long
general trend is up trend
have fun :)

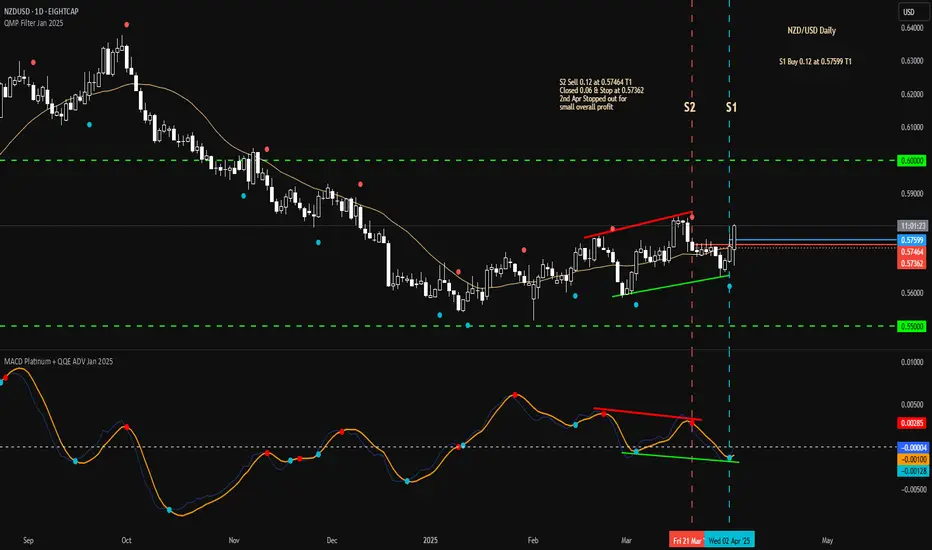
Thu 3rd Apr 2025 NZD/USD Daily Forex Chart Buy SetupGood morning fellow traders. On my Daily Forex charts using the High Probability & Divergence trading methods from my books, I have identified a new trade setup this morning. As usual, you can read my notes on the chart for my thoughts on this setup. The trade being a NZD/USD Buy. Enjoy the day all. Cheers. Jim
NZDUSD Technical Analysis! BUY!
My dear subscribers,
This is my opinion on the NZDUSD next move:
The instrument tests an important psychological level 0.5666
Bias - Bullish
Technical Indicators: Supper Trend gives a precise Bullish signal, while Pivot Point HL predicts price changes and potential reversals in the market.
Target - 0.5722
My Stop Loss - 0.5632
About Used Indicators:
On the subsequent day, trading above the pivot point is thought to indicate ongoing bullish sentiment, while trading below the pivot point indicates bearish sentiment.
Disclosure: I am part of Trade Nation's Influencer program and receive a monthly fee for using their TradingView charts in my analysis.
———————————
WISH YOU ALL LUCK

NZD/USD Upward Momentum: AI Signal Indicates Potential RiseUsing the proven EASY Trading AI strategy, today's analysis points toward a bullish bias on the NZD/USD. Entering a buy position at 0.56985, the algorithm anticipates upward movement targeting a Take Profit at 0.57140667. A protective Stop Loss is placed at 0.56723667, managing risk effectively. The BUY position is justified by EASY Trading AI's analysis of support-resistance dynamics, recent price volatility, and favorable momentum indicators, collectively suggesting likely upward pressure in the short-term scenario.

Could the Kiwi reverse from here?The price is risng towards the resistance level which is aa pullback resistance that lines up with the 61.8% Fibonacci retracement and could reverse from this level to our take profit.
Entry: 0.5760
Why we like it:
There is a pullback resistance level that aligns with the 61.8% Fibonacci retracement.
Stop loss: 0.5810
Why we like it:
There is a pullback resistance level.
Take profit: 0.5689
Why we like it:
There is a pullback support level.
Enjoying your TradingView experience? Review us!
Please be advised that the information presented on TradingView is provided to Vantage (‘Vantage Global Limited’, ‘we’) by a third-party provider (‘Everest Fortune Group’). Please be reminded that you are solely responsible for the trading decisions on your account. There is a very high degree of risk involved in trading. Any information and/or content is intended entirely for research, educational and informational purposes only and does not constitute investment or consultation advice or investment strategy. The information is not tailored to the investment needs of any specific person and therefore does not involve a consideration of any of the investment objectives, financial situation or needs of any viewer that may receive it. Kindly also note that past performance is not a reliable indicator of future results. Actual results may differ materially from those anticipated in forward-looking or past performance statements. We assume no liability as to the accuracy or completeness of any of the information and/or content provided herein and the Company cannot be held responsible for any omission, mistake nor for any loss or damage including without limitation to any loss of profit which may arise from reliance on any information supplied by Everest Fortune Group.

NU Updatethe technical analysis suggests a neutral to slightly bearish outlook for NZD/USD over the next few weeks. The pair is likely to either continue trading within its current range of 0.5660–0.5760 or experience a modest decline, driven by its position below key moving averages and pressure from a stronger US dollar. Traders should monitor the support at 0.5660 and resistance at 0.5760 closely, as a breakout from this range will likely determine the next significant move.
NZDUSD SHORTMarket structure bearish on HTFs 3
entry at Daily AOi
Weekly Rejection at AOi
Daily Rejection at AOi
Daily EMA retest
Previous Daily Structure Point
Around Psychological Level 0.57000
H4 EMA retest
H4 Candlestick rejection
Rejection from Previous structure
Levels 5.01
Entry 105
REMEMBER : Trading is a Game Of Probability
: Manage Your Risk
: Be Patient
: Every Moment Is Unique
: Rinse, Wash, Repeat!
: Christ is King.

Price action Price pulled back to a place where there was selling interest the next tp would support

NZD/USD For Bullishwait for pull-back near by entry point and the go long
general trend is up trend
have fun :)
NZDUSD - Like a Bow and Arrow!!Hello TradingView Family / Fellow Traders. This is Richard, also known as theSignalyst.
📈NZDUSD has been overall bullish trading within the rising wedge pattern marked in blue.
Today, NZDUSD is retesting the lower bound of the wedge.
Moreover, it is approaching a strong structure marked in green.
🏹 Thus, the highlighted blue circle is a strong area to look for buy setups as it is the intersection of structure and lower blue trendline acting as a non-horizontal support.
📚 As per my trading style:
As #NZDUSD approaches the blue circle zone, I will be looking for bullish reversal setups (like a double bottom pattern, trendline break , and so on...)
📚 Always follow your trading plan regarding entry, risk management, and trade management.
Good luck!
All Strategies Are Good; If Managed Properly!
~Rich
Disclosure: I am part of Trade Nation's Influencer program and receive a monthly fee for using their TradingView charts in my analysis.

NZDUSD → Consolidation within the correctionFX:NZDUSD is forming a local correction on the background of the uptrend. The dollar has been consolidating and strengthening for the last week, which generally creates pressure on the forex market
NZDUSD after a false break of the trend resistance, which also coincided with the stopping of the strong decline of the dollar, entered the correction phase. Locally, it is a downtrend, followed by consolidation, which in general forms a flag - a figure of continuation of the movement.
The chart reveals strong levels that can be paid attention to. The dollar may continue its growth due to the US policy, which generally has a negative impact on the market.
The price exit from the current consolidation may be accompanied by a strong impulse. Emphasis on 0.575 - 0.571.
Resistance levels: 0.57426, 0.57674
Support levels: 0.571, 0.5684
After stopping at 0.571, the price is not pulling back, but forming consolidation on the background of the local downtrend. Most likely a big player lures the crowd to get to the imbalance zone or trend support at their expense.
Regards R. Linda!

NZD/USD hit that weekly zone NZD hit that weekly zone an has been trending up every since we may still have some bullish momentum lets keep an eye out..

Shorting NUDaily chart showing bearishness
4h chart showing potential internal range to external range move.
1h chart showing liquidity purge, SMT with AU, entry above midnight open

NZDUSD is following DOW theorywith no sign of reversal, the price action seems bullish as it has marked HL and is now ready to start the upward movement. By analyzing the trend, I believe that the price will mark HH with 4.50%, which is the average of the last two.

NU updateUnexpected US economic releases or shifts in Fed policy could boost the USD, reversing the pair lower. Traders should monitor news and set stop-losses.In summary, NZD/USD is poised for a slight upward move in the next few days, potentially reaching 0.5750–0.5800

Possible 10R on NZDUSD . Swing BuysHere's how I'm engaging NZDUSD for a buy trade. It's absolutely okay to find refinements at POI but I expect more bullishness to complete HTF corrective wave.
DYOR.
Like if you agree

Bearish reversal off pullback resistance?NZD/USD is rising towards the resistance level which is a pullback resistance that line sup with the 61.8% Fibonacci retracement and could reverse from this level to our take profit.
Entry: 0.5712
Why we like it:
There is a pullback resistance level that lines up with the 61.8% Fibonacci retracement.
Stop loss: 0.5747
Why we like it:
There is a pullback resistance that is slightly above the 50% Fibonacci retracement.
Take profit: 0.5648
Why we like it:
There is a pullback support level.
Enjoying your TradingView experience? Review us!
Please be advised that the information presented on TradingView is provided to Vantage (‘Vantage Global Limited’, ‘we’) by a third-party provider (‘Everest Fortune Group’). Please be reminded that you are solely responsible for the trading decisions on your account. There is a very high degree of risk involved in trading. Any information and/or content is intended entirely for research, educational and informational purposes only and does not constitute investment or consultation advice or investment strategy. The information is not tailored to the investment needs of any specific person and therefore does not involve a consideration of any of the investment objectives, financial situation or needs of any viewer that may receive it. Kindly also note that past performance is not a reliable indicator of future results. Actual results may differ materially from those anticipated in forward-looking or past performance statements. We assume no liability as to the accuracy or completeness of any of the information and/or content provided herein and the Company cannot be held responsible for any omission, mistake nor for any loss or damage including without limitation to any loss of profit which may arise from reliance on any information supplied by Everest Fortune Group.

Short trade
Day TF overview
Sellside trade
Pair NZDUSD
Sun 30th March 25
5.00 pm (NY Time)
NY Session AM
Structure Day
Entry 4Hr
Entry 0.56969
Profit level 0.56389 (1.02%)
Stop level 0.57247 (0.49%)
RR 3.68
Reason: Price action seems indicative
of a Sellside momentum since Sunday
30th March 25.
Target Wed 5th March - liquidity low

A bullish movement on NZDUSDNZDUSD has been bearish for a while, and it seems to be starting a new bullish movement.
currently on a support and valid uptrend on a 4h timeframe

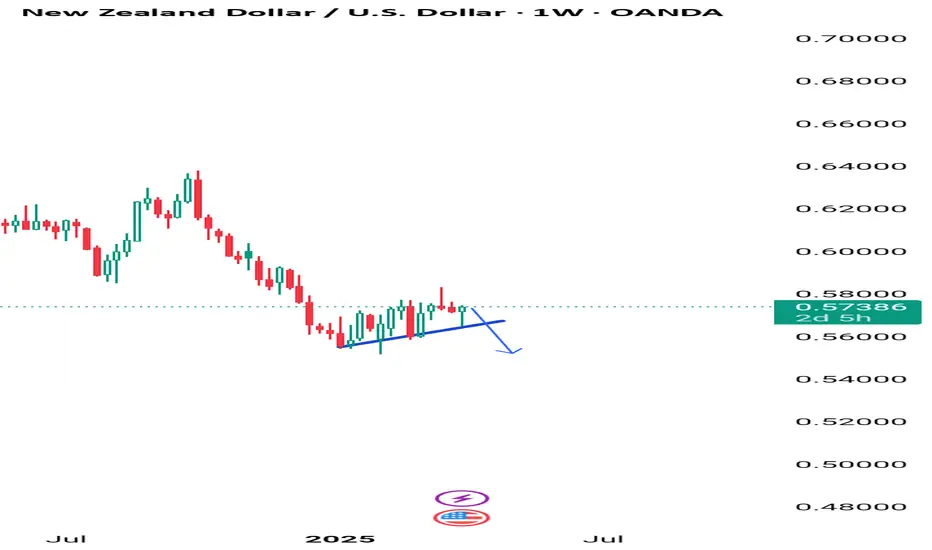
NZDUSD has broken it's support and already in Down TrendNZDUSD has broken its support and is already experiencing a downward trend.
A short position may be taken.

NZD/USD at Risk of Retesting Yearly LowsThe Kiwi is clinging to uptrend support within a broader rising wedge, with selling pressure reemerging at .5680 despite Monday’s late recovery.
A clean break below the uptrend could see bears target .5650, the low from Monday. A move through that level would put .5600 in focus as the next downside target.
Momentum signals reinforce the bearish case—RSI (14) and MACD continue to trend lower into negative territory, favouring selling rallies and downside breaks.
If the price were to fail beneath the uptrend again and reverse back above .5680, the bearish bias would be invalidated for now.
Good luck!
DS
