Heading into pullback resistance?The Kiwi (NZD/USD) is rising towards the pivot which acts as a pullback resistance and could revere to the 1st support.
Pivot: 0.5827
1st Support: 0.5695
1st Resistance: 0.5915
Risk Warning:
Trading Forex and CFDs carries a high level of risk to your capital and you should only trade with money you can afford to lose. Trading Forex and CFDs may not be suitable for all investors, so please ensure that you fully understand the risks involved and seek independent advice if necessary.
Disclaimer:
The above opinions given constitute general market commentary, and do not constitute the opinion or advice of IC Markets or any form of personal or investment advice.
Any opinions, news, research, analyses, prices, other information, or links to third-party sites contained on this website are provided on an "as-is" basis, are intended only to be informative, is not an advice nor a recommendation, nor research, or a record of our trading prices, or an offer of, or solicitation for a transaction in any financial instrument and thus should not be treated as such. The information provided does not involve any specific investment objectives, financial situation and needs of any specific person who may receive it. Please be aware, that past performance is not a reliable indicator of future performance and/or results. Past Performance or Forward-looking scenarios based upon the reasonable beliefs of the third-party provider are not a guarantee of future performance. Actual results may differ materially from those anticipated in forward-looking or past performance statements. IC Markets makes no representation or warranty and assumes no liability as to the accuracy or completeness of the information provided, nor any loss arising from any investment based on a recommendation, forecast or any information supplied by any third-party.
USDNZD trade ideas

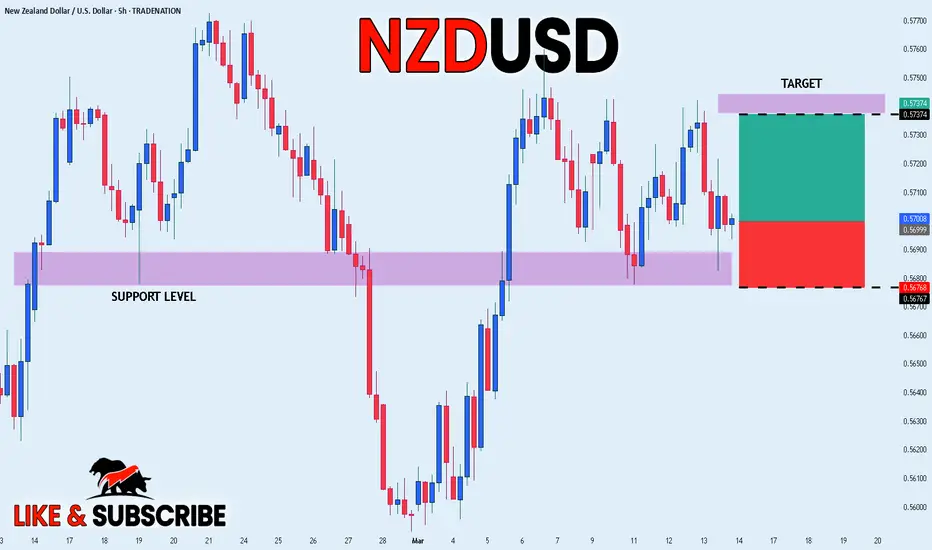
NZDUSD: Short Trade with Entry/SL/TP
NZDUSD
- Classic bearish formation
- Our team expects fall
SUGGESTED TRADE:
Swing Trade
Sell NZDUSD
Entry Level - 0.5739
Sl - 0.5777
Tp - 0.5682
Our Risk - 1%
Start protection of your profits from lower levels
Disclosure: I am part of Trade Nation's Influencer program and receive a monthly fee for using their TradingView charts in my analysis.
❤️ Please, support our work with like & comment! ❤️

Heading into pullback resistance?NZD/USD is rising towards the resistance level which is a pullback resistance that aligns with the 138.2% Fibonacci extension and could reverse from this level to our take profit.
Entry: 0.5850
Why we like it:
There is a pullback resistance level that aligns with the 138.2% Fibonacci extension.
Stop loss: 0.5913
Why we like it:
There is an overlap resistance level that is slightly above the 161.8% Fibonacci extension.
Take profit: 0.5696
Why we like it:
There is a pullback support level.
Enjoying your TradingView experience? Review us!
Please be advised that the information presented on TradingView is provided to Vantage (‘Vantage Global Limited’, ‘we’) by a third-party provider (‘Everest Fortune Group’). Please be reminded that you are solely responsible for the trading decisions on your account. There is a very high degree of risk involved in trading. Any information and/or content is intended entirely for research, educational and informational purposes only and does not constitute investment or consultation advice or investment strategy. The information is not tailored to the investment needs of any specific person and therefore does not involve a consideration of any of the investment objectives, financial situation or needs of any viewer that may receive it. Kindly also note that past performance is not a reliable indicator of future results. Actual results may differ materially from those anticipated in forward-looking or past performance statements. We assume no liability as to the accuracy or completeness of any of the information and/or content provided herein and the Company cannot be held responsible for any omission, mistake nor for any loss or damage including without limitation to any loss of profit which may arise from reliance on any information supplied by Everest Fortune Group.

Buy nzdusdStrong buy expected respecting the current buy channel downtrend broken already
Pair momentum shifted to buy side already


NZDUSD is in the Selling DirectionHello Traders
In This Chart NZDUSD HOURLY Forex Forecast By FOREX PLANET
today GBPUSD analysis 👆
🟢This Chart includes_ (NZDUSD market update)
🟢What is The Next Opportunity on NZDUSD Market
🟢how to Enter to the Valid Entry With Assurance Profit
This CHART is For Trader's that Want to Improve Their Technical Analysis Skills and Their Trading By Understanding How To Analyze The Market Using Multiple Timeframes and Understanding The Bigger Picture on the Charts

NZDUSD Is Going Up! Buy!
Here is our detailed technical review for NZDUSD.
Time Frame: 10h
Current Trend: Bullish
Sentiment: Oversold (based on 7-period RSI)
Forecast: Bullish
The market is approaching a significant support area 0.575.
The underlined horizontal cluster clearly indicates a highly probable bullish movement with target 0.582 level.
P.S
The term oversold refers to a condition where an asset has traded lower in price and has the potential for a price bounce.
Overbought refers to market scenarios where the instrument is traded considerably higher than its fair value. Overvaluation is caused by market sentiments when there is positive news.
Disclosure: I am part of Trade Nation's Influencer program and receive a monthly fee for using their TradingView charts in my analysis.
Like and subscribe and comment my ideas if you enjoy them!

NZD/USD SHORT ENTRY IDEA📈 NZDUSD Technical Analysis 🚀
🔹 Bullish Channel Formation: The price is moving within an ascending channel, respecting both support and resistance levels.
🔹 Retest & Continuation: After testing the lower boundary, the price is showing bullish momentum towards the upper channel.
🔹 Target Zone: If the structure holds, the price could reach the upper resistance area around 0.5900 - 0.5950.
⚠️ Key Considerations:
• Watch for any potential rejection at key resistance levels.
• Proper risk management is crucial to handle possible pullbacks.
🔥 Let’s see how this plays out! 🚀

NZD-USD Short From Resistance! Sell!
Hello,Traders!
NZD-USD was going up
Yet failed to reach and
Break the horizontal resistance
Of 0.5772 before the trading week's
End so the bulls are not as strong
As we initially thought which
Give us a nice opportunity
To enter a short trade on
The pair on Monday
With the Target of 0.5732
And Stop Loss of 0.5775
Sell!
Comment and subscribe to help us grow!
Check out other forecasts below too!
Disclosure: I am part of Trade Nation's Influencer program and receive a monthly fee for using their TradingView charts in my analysis.

NZDUSDOverall price is bearish but it has been bullish as of late. Price is approaching daily resistance so I'd wait to see how price reacts at daily resistance. If price rejects daily resistance then begins forming bearish structure on lower timeframes (M5, M15), I'd start looking to sell towards daily support. If price breaks the daily resistance. then I'd look for buys to the 0.59000 area.

NZDUSD💡The chart shows a technical analysis of the NZDUSD currency pair on the four-hour timeframe. Liquidity and Trend Change: The chart shows a Liquidity Sweep at the bottom, indicating liquidity was accumulated before the price reversed upwards. There is a symmetrical triangle pattern, and the price managed to break through it to the upside. The MACD indicator is showing positive signals with the emergence of buying momentum, supporting the continuation of the upward trend.
⛔️Not investment advice for educational purposes only.

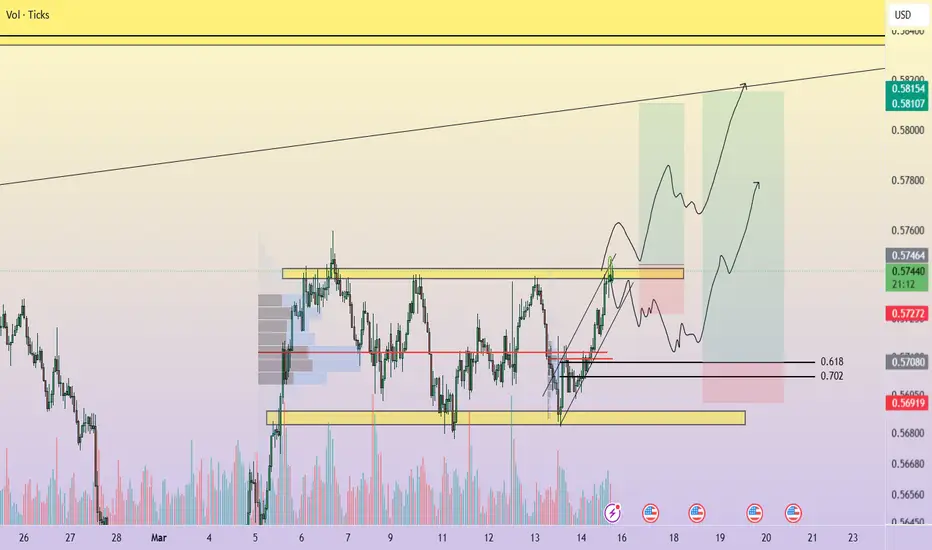
NZDUSD 1H BUY IDEANZDUSD price has entered a range. The price has tested the range high four times before and is now testing it again. However, from a price action perspective, it seems to be holding below the upper resistance without breaking through.
If the price breaks above the 0.57400 level, I expect it to rise by the range’s height. Interestingly, if it moves exactly by the range’s height, it aligns with the upper point of the trendline.
On the other hand, if the price fails to break above 0.574, I anticipate it will test the Fibonacci 0.618 level before making another attempt to push higher. Additionally, there is notable volume around the 0.618 level, which could support a potential bounce.
NZDUSDthis is NZDUSD Lets take short sell, aiming for long buy term, we are aiming for 90% role after a breakout

NZDUSD Neutral H4Remember, successful trading relies on proper risk management and a disciplined approach. Use stop-losses to safeguard your assets and carefully plan each trade. Analysis is the key to making informed decisions. Stay updated and continue refining your strategies!

ABOUT NZDUSDMy option about nzdusd Is more bearish so that zone is good and strong restanice if the price comes to that zone it can pullback

Could the Kiwi reverse from here?The price is rising towards the pivot which has been identified as a pullback resistance and could drop to the pullback support.
Pivot: 0.5722
1st Support: 0.5677
1st Resistance: 0.5750
Risk Warning:
Trading Forex and CFDs carries a high level of risk to your capital and you should only trade with money you can afford to lose. Trading Forex and CFDs may not be suitable for all investors, so please ensure that you fully understand the risks involved and seek independent advice if necessary.
Disclaimer:
The above opinions given constitute general market commentary, and do not constitute the opinion or advice of IC Markets or any form of personal or investment advice.
Any opinions, news, research, analyses, prices, other information, or links to third-party sites contained on this website are provided on an "as-is" basis, are intended only to be informative, is not an advice nor a recommendation, nor research, or a record of our trading prices, or an offer of, or solicitation for a transaction in any financial instrument and thus should not be treated as such. The information provided does not involve any specific investment objectives, financial situation and needs of any specific person who may receive it. Please be aware, that past performance is not a reliable indicator of future performance and/or results. Past Performance or Forward-looking scenarios based upon the reasonable beliefs of the third-party provider are not a guarantee of future performance. Actual results may differ materially from those anticipated in forward-looking or past performance statements. IC Markets makes no representation or warranty and assumes no liability as to the accuracy or completeness of the information provided, nor any loss arising from any investment based on a recommendation, forecast or any information supplied by any third-party.

NZD_USD LONG SIGNAL|
✅NZD_USD made a retest
Of the horizontal support
Of 0.5680 from where we
Are already seeing a bullish
Rebound so we can enter a
Long trade from around 0.5700
With the target being 0.5737
And the SL of 0.5676
LONG🚀
✅Like and subscribe to never miss a new idea!✅
Falling WedgeThe price broke out of a falling wedge, and now we have a pullback, if the price makes a higher high its confirmation to go long
WE ONLY TRADE PULLBACKS


NZDUSD: Bullish Continuation
The charts are full of distraction, disturbance and are a graveyard of fear and greed which shall not cloud our judgement on the current state of affairs in the NZDUSD pair price action which suggests a high likelihood of a coming move up.
Disclosure: I am part of Trade Nation's Influencer program and receive a monthly fee for using their TradingView charts in my analysis.
❤️ Please, support our work with like & comment! ❤️

Lingrid | NZDUSD long Trade SETUP in CONSOLIDATION ZoneThe price perfectly fulfilled my previous idea. It hit the target zone. FX:NZDUSD market is currently consolidating after a period of bullish momentum. It has been making false breakouts at previous support and resistance zones, indicating that it is in a sideways trend. The market is approaching the previous day's low, and I believe it may create a false breakout in this zone before moving higher, especially given the prevailing bullish momentum. My goal is resistance zone around 0.57270
Traders, If you liked this educational post🎓, give it a boost 🚀 and drop a comment 📣

NZDUSD LONGMarket reacting from a strong demand level from the Daily TF. Expecting markets to keep rallying to the upside taking out levels like 0.57600 and later on 0.8850 . focusing on LTF is essential to catch these trades ... Drop a comment and tell me what you think

BUYGod First
Minimum Risk Maximum Reward
Action Backed Believe
# faith, strategy, and execution all in one #
