USDPLN trade ideas

"Top and Bottom Analysis" USD/PLN by ThinkingAntsOk4H CHART EXPLANATION:
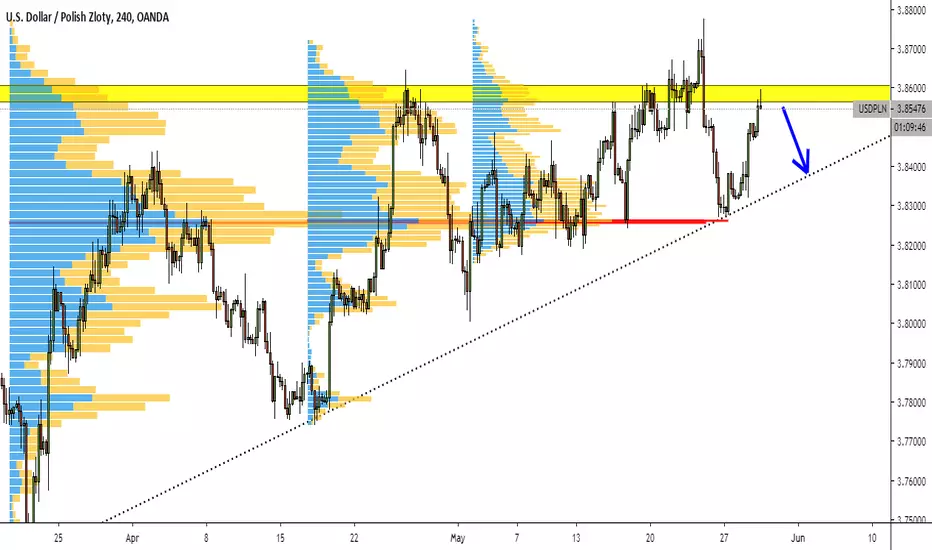
We observe that price broke down the Ascending Wedge Pattern, so, we expect a corrective movement since it did not correct after the breakout. It would be an optimal point to place an entry, looking for a downside move towards the support zone.
MULTI TIMEFRAME ANALYSIS:
- Daily:
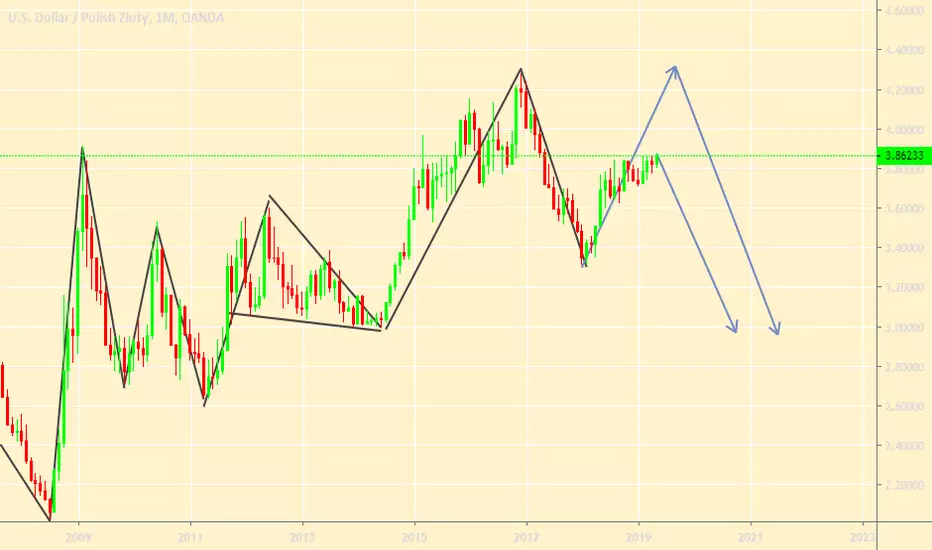
- Weekly:

4 tops on D1 - great short oportunityHi Guys,
in my opinion its time to short USDPLN - even for next 16 months, great risk reward and 3 attractive targets - if u like it leave a comment.
Have a nice trades!


Waiting signal USDPLNUSDPLN has formed a symetrical triangle,
Any breakout is a signal to buy or sell.

usdpln longplease do your own research and analysis. i am not responsible for your decisions/outcomes.


PLN goes down in to a purple zonePLN polish zloty. Country has issues with EU deficit limitation -2,8% gdp, in meantime Poland has -2,6% gdp currently. Upcoming elections contain too much of "free money" promises.

USDPLN Sell SignalPattern: 1D Ascending Triangle.
Signal: Bearish as the price was rejected inside the 1D Resistance Zone.
Target: 3.7700 (expected Higher Low).

USDPLN SHORT Sorry for this markup. I feel so comfortable.
No comments required. All description on the chart. Do not forget to look at the chart when closing each bar. All transactions are at your own risk. This is my personal opinion, it may differ from yours.
!!!You make money, not someone instead of you!!!

USDPLN - (Bullish) Inside Bar / Pin Bar Fake-Out within TriangleIn USDPLN we have a nice bullish setup on the weekly charts with a bullish inside bar / pin bar fake-out that has formed off of the bottom of a rising triangle. There have been numerous attempts to break out of this rising triangle, with a number of the attempts producing bearish pin bars which saw price drop immediately lower. Even so, price has continued to produce higher lows. This latest pin bar that has formed may be the setup that finally gets this pair to break out of its rising triangle.

LONG USDPLN 4HNO target
If this bar does not work, then the order is desirable to remove
#givemeyourmoney

USDPLN - Short breakout setup - 1HRAfter a very profitable long trade on the hourly chart I’m now facing a short setup. The higher timeframes are alls till in bullish territory, but they also show some solid bearish divergence.
The hourly chart is trading below MTFA resistance, which seems to be rejecting the price at its current level. The CMF is showing bearish divergence and is currently still negative. No divergence shown by the RSX on this timeframe though..
The first MTFA support is a good few pips away, and reaching that may be a bit far fetched, but we’ll have to see how it plays out. Trail the stop loss with the green dots, and watch for overextension signals.. You know the drill ;)
There are no certainties in trading, and it’s very possible that we’ll see some ranging before price decides to break down (or up for that matter, as the higher timeframes are still bullish). If the indicator cancels the short setup I’ll cancel the entry order and re-evaluate. Here again, I’d rather be late to the party than end up at the wrong house..
If you find this useful, like and subscribe to get notified of updates and new ideas
If you want to tryout the indicators and strategy, follow and pm me and I’ll get you set up.
Stay calm, and happy trading!

Polonia a la baja!! // Poland goes down !!OANDA:USDPLN
Resistencia fuerte donde suele rebotar el precio.
Agosto 2018: el precio rebotó en la zona de resistencia.
Octubre 2018: el precio rebotó en la zona de resistencia.
Noviembre 2018: el precio rebotó en la zona de resistencia.
Febrero 2019: el precio comienza el rebote en la zona de resistencia, se comienza a confirmar con velas rojas de venta.
Strong resistance where the price usually bounces.
August 2018: the price rebounded in the resistance zone.
October 2018: the price rebounded in the resistance zone.
November 2018: the price rebounded in the resistance zone.
February 2019: the price starts the rebound in the resistance zone, it begins to confirm with red candles for sale.

USDPLNSELF DEVELOPMENT/METHODOLOGY/PSYCHOLOGY
Chart time frame -
Timeframe -
Actions on -
A – Activating Event
Currency Pair creating a Double Top .
B – Beliefs
Market will find support at current levels and move towards the first Target 1 level @ --------
FX:USDPLN
ALL DETAILS MENTION IN THE CHART IDEA
Trade Management
Entered @ Sign up for details
Stop Loss @ Sign up for details
Target 1 @
Target 2 @
Risk/Reward @
Happy trading :)
Follow your Trading plan, remain disciplined and keep learning !!
Please Follow, Like,Comment & Follow
Thank you for your support :)
www.tradingview.com
www.tradingview.com
www.youtube.com
This information is not a recommendation to buy or sell. It is to be used for educational purposes only!

USD/PLN gearing towards the SouthWhy I belief like this.
Plan A
As the EURO is getting ready to go North. The EURO is a leading indicator for the Zlotty. So fundamentally the USD/PLN has to go down.
The Trendline which had acted as Support has been broken and is acting as resistance.
Remember their are always 3 scenario's how a trendline can play out.
The you see some rejection allready, for first target (I put a flag a a symbol, the first green barrier will stop price slightly.
Plan B
If none of this plays out, and EURO has gone south and became bearish, go long on PLN. As an extra the overnight cost "swap" are favourable for a long.


USD / Polish Zloty. Published on 12/26/2018This chart was originally published on Tradingview on 12/26/2018

USDPLN is offering some GREAT ODDS off the daily chartSmaller timeframe charts and more information available to followers and received upon request through PM

USDPLN Bulls faces a big levelThe bullish price action needs alot of "mojo" to break above the red critical level. Once broken, I hope price will continue to go upwards from the momentum and test the next important level. I can see alot of Bear Stop Loss orders in the vicinity of the red critical level, if I can see it, big money can too.
whichever side you are at, make sure to always have a proper risk management in place so that your account is always protected.

Buy USD/PLNThis is just a journal for me. I strongly warn you to not take this in your real account. Good luck!
