USDPLN trade ideas

USDPLN-BUY strategyThe USDPLN had a nice run down and we are oversold right now. The DC also kind of suggesting little lower.
Based on that I suggest BUY current 3.9400-3.9550 for a move back to 4.0500 short-term. Stop-loss let's say below 3.9000 for now.


USDPLN- Great time to open SELL positionUSDPLN after a short break with a declining trend is trying to continue with lower blows.
Here it is wise to open the SELL position and monitor if it happens that the daytime spark plug is canceled by the candlestick, then you should watch and choose the moment to close the position so that there are no unnecessary losses. This currency pair has a chance to hit up to level 4.0.
Trade safely.

USDPLN Lots of uncertainty in the growing trendThis currency pair has had a lot of uncertainty about the direction of movement for several days.
If the Omicron strain were to grow dizzyingly in the US, it is very likely that it will move towards 4.0.
We have to take care of the risk in order to trade as long as possible.
Inflation in Poland is also growing dizzyingly, the effect of the TURKISH LIRA may appear ... :)

USDPLN- Trend changeWe have had a decline for a few days this currency pair looks set to reverse its upward trend.
They will probably test level 4.20 or 4.21.
If I have time, I will try to give a more serious analysis of this currency pair later.

USDPLN CAN BE HIGHER NEXT WEEK?!As we can see USD/PLN rejected this support zone quite nicely, we can surf the trend and pick the next wave soon.

USDPLNUSDPLN
I dont have anything to explain here. after this omricon it will be there
omricon I view it as just market manipulation

USD PLN - SELL positionWhen I look at the daily chart I see that the MA100 is far from the current price, on the other hand last week on the daily level we had several times higher prices or 4.10, it seems that this currency pair will move to 4.0 level next week.
On the other hand, we have several important events for the USD, which will additionally create sales pressure.
Next week, Wednesday will be a crucial day for the movement of this currency pair.
Should there be green candles on Monday and Tuesday , we may need to consider selling with the obligatory SL.
I will probably sell, but maybe on 4.09 or 4.10 with SL 4.11 or 4.12.
Thank you

USDPLN - The declining trend continuesWhen we look at the W1 chart, we notice that the higher price has been disliked several times. Personally, it seems to me that the declining trend will continue. Maybe up to 4 or lower ..

USDPLN EMA 200 USDPLN, encountering the EMA200 line, what could that mean?
It will probably have a certain stay at this level for a couple of days, if the ipk is one day with a big green Japanese candle, there will probably be a change in the trend and a transition to growth.
My personal opinion to begin with will stay here. and will have several tests.

USDPLN Great SellI think this is a good pair for sale right now. There is a good Japanese candle here, which indicates a decline in the coming days.

USDPLN - SELL strategyThe USDPLN (Polish Zloty) is overbought, and also in top range BB and also regression channel top. The candle stick also starts showing good top patterns.
Sell 4.1700 current for a move to 3.9800.

USD/PLN Here we have two big saints on the H4 chart signaling a big sale. I believe that this couple will start in a declining trend.
Entry: 4.1721
TP1 4.10
TP2 4.00
If the ratio returns as 4.21 we need to get out of the trade.
I risk only 3% of my capital.

USDPLN variant.
start of implementation to the bottom.
the fibo level coincides with the upper border of the ascending channel, so this is the most likely target if, of course, it passes through 61% (there will be a slight upward movement) perhaps a little to the border of the H1 channel.
but I consider it risky to try go down.

USDPLN long position.possible long position to the borders of H1 and then H4 frame channel:
sl = 4,15679
tp = 4,21698

USDPLN Exponential Moving Average and Trend Line Foreign Currency
Trend: Up
Level: Diagonal Level, EMA 10 Level, EMA 20 Level
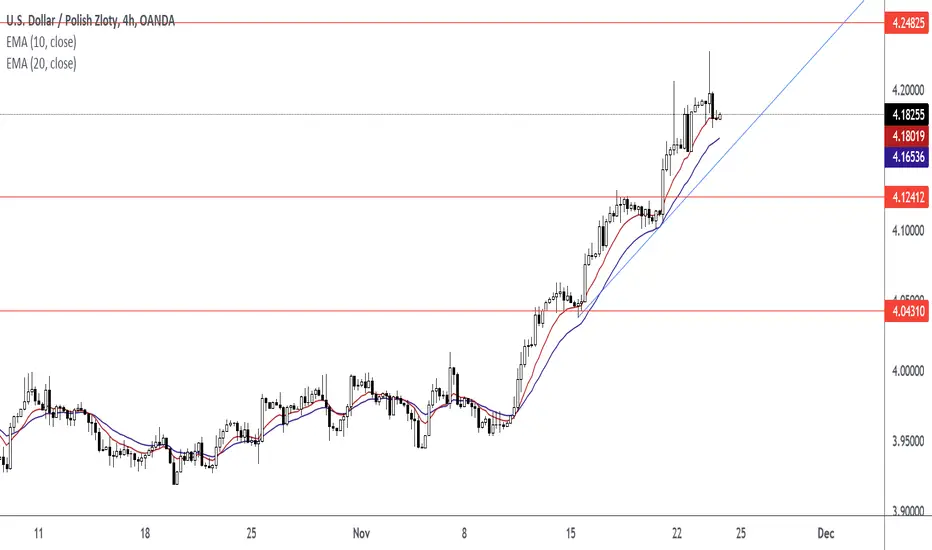
USDPLN Triangle Chart Pattern (Target Price 4.24825)USDPLN Foreign Currency Pair
Trend: Up
Level: EMA 10, EMA 20, Diagonal, Horizontal
Signal: Break Out Candle

USD-PLN breaks the .702 fib extensionBreaking above the .702 fib extension is a bullish indicator for the currency pair.
My immediate target is up at around 4.30 in the midterm (next few weeks to months).
From there we will have to see if the pair will respect the previous ATH on the pair or if it will execute the massive multi-year cup and handle and break out to ~5.50.
I plan to enter a small position at 4.30 with a target of 3.80 and a SL at 4.40
If the SL triggers my next attempt at entry will be 5.50 targeting 4 flat with a SL at 5.65

yano14 | USDPLN long after pullback. Target 4.30 Why long?
-Poland has the biggest inflation in EU
-Poland has conflict at the boarder with Belarus
-Polish government hands out money a lot
-USDPLN crossed psychologic 4.00 area
Wait for pullback to 4.00
Remember about risk and do not overleverage your positions.
-------------------
Share your opinion in the comments and support the idea with like.
Thanks for your support!


USDPLN ShortHesitation by the Fed and 50 basis point interest rate raise for Poland. Should be an easy move down until Powell decides to be tougher on inflation. Strong Reward to risk although this trade will take about a week to play out. Keep an eye on any FED move for an earlier exit

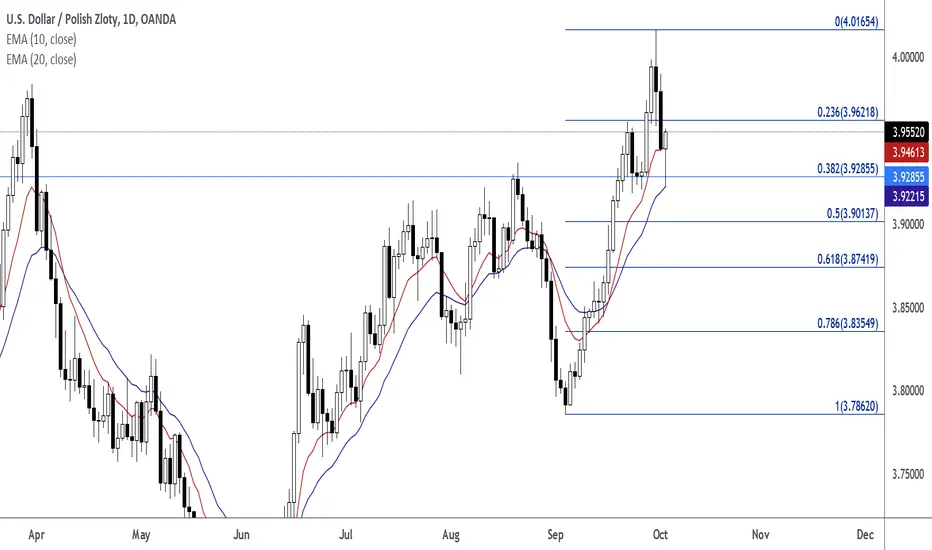
USDPLN Target Price 4.01654USDPLN. Price closed above EMA 10, EMA 20, Fibonacci Retracement Level. 38.2% Fibonacci Level is in line with previous highs and lows on the Daily Time Frame.