Help Ukraine, Short the RubbleSanctions already in place, and it will only get worse for Russia. Last time Russia invaded Crimea, rubble fell dramatically.
Let's support Ukraine by deflating Russian economic power.
USDRUB_TOM trade ideas

RUBUSD - War And FXNot a chart I trade but it is interesting to see Russia Vs USA today on the chart - or RUB vs USD rather.
And RUBUSD was down 9% today, probably more to come.
Not advice.

Russian Ruble VS the US Dollar after the Ukraine invasion If you haven`t seen my last USDRUB fulfilling prophecy chart:
Then if we use the Fibonacci extension tool to calculate a possible price target in an uncharted territory, that would be 95!
Looking forward to read your opinion about it.

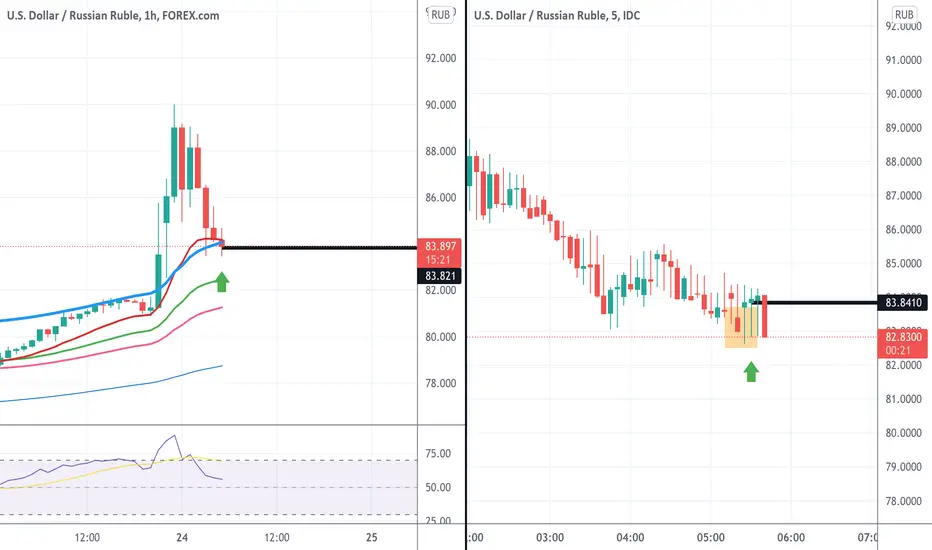
Usdrub on 1hrUsdrub broje above top bolinger on 1hr and now declines to test from above
In the same time on 5min time frame at the same level - price leaves single candle left behind separated by gapping - orange square.
Buy on this let’s see if top bolinger holds decline and push price higher.
See idea attached:
Usdrub hitting top bolinger target on monthly today.
Seme setup now on 1hr as same setup was on daily
USD/RUB ANOTHER HiT!!! $$$The next hit will be today! Next destination is 110. And it's best time to buy! Till today 17:00 gmt+4. That time Russian central bank has a conference!

USDRUB-SELL ++It's risky without a doubt.
The run up has been sharp and of course it is expected based on the news. However, if we see certain levels, we may wish to venture it. RSI is high and may go higher, and that is why pick levels only. SELL $ 89-91 and take profit quickly at $ 85 below.
Repeat this if it ia erratic that way. No stop-loss as it is very thin market conditions.

USDRUB next level 100Everything is going according to plan, the next level is 100.
My forecast is STRONG SELL.

Rouble could see a collapse US President Joe Biden has said he would consider imposing economic sanctions personally targeting Vladimir Putin if the Russian president orders a new attack on Ukraine.
Meanwhile, British Prime Minister Boris Johnson urged European allies to have sanctions ready to go if Russia invades Ukraine.
that could lead to a dramatic fall in the Russian currency

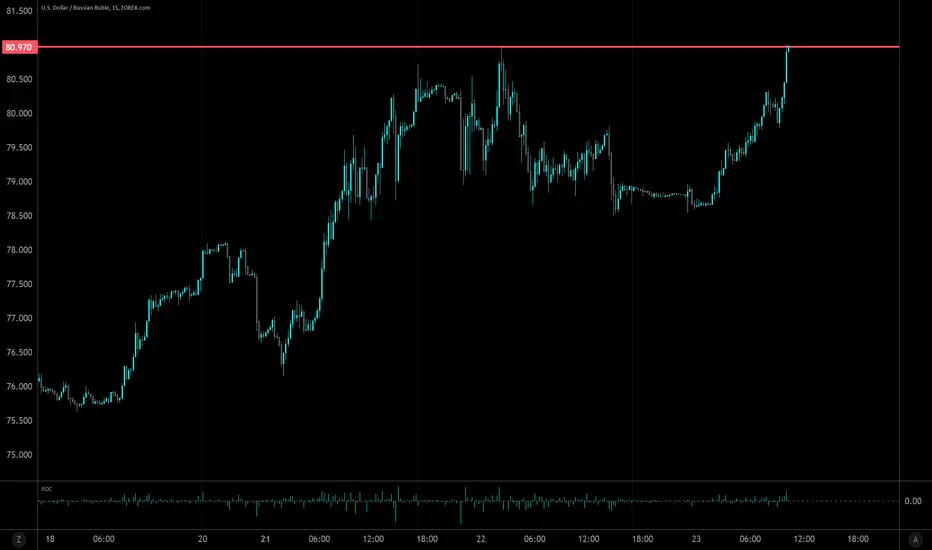
USD/RUB WEEKLY TRIPPLE TOPOn Wednesday, the Russian rouble slumped, diving around 3% to hit a near two-year low past 81 to the dollar as Ukraine declared a state of emergency, with sanctions and invasion fears hammering Russian bonds and stocks. Ukraine told its citizens in Russia to come home. At the same time, Moscow began evacuating its Kyiv embassy in the latest ominous sign for Ukrainians who fear an all-out Russian military onslaught.
USD/RUB has been consolidating in a narrow range of 81.48-81.63 in the early Asian session amid the declaration of emergency by Ukraine and formed a triple top formation on a weekly chart. The USD/RUB pair peaked above the 80.0000 earlier today, returning to Oct. 30, 2020, high before retreating, potentially forming a Shooting Star. This one-candle pattern demonstrates a bearish response, signaling bulls have been beaten back. It touches and rebounds from the 81 levels. It would be interesting how the traders will reach in the following days and weeks. However, if the price does make new highs, there is a chance that some investors will be aware of this resistance failure. Their interest could become support, pushing the price yet higher. For now, however, traders should treat the 80 levels with caution. If the bears are awakened, they can bring the price to test the peak from April 2021 around 78. Looking at Fibonacci levels, which are confirmed many times on the weekly chart, the price can correct 61.8 Fibo level, which is strong support around 73 or lower to 50 Fibo levels around 70 and confirmed the formation October 2020 to December 2020.
But if the bulls decide to remain aggressive on the market, the price could be taken further north and reach the levels from the beginning of 2016 around 85.
Risk Disclosure: Trading Foreign Exchange (Forex) and Contracts of Difference (CFD's) carry a high-risk level. By registering and signing up, any client affirms their understanding of their own personal accountability for all transactions performed within their account and recognizes the risks associated with trading on such markets and such sites. Furthermore, one understands that the company carries zero influence over transactions, needs, and trading signals. Therefore, it cannot be held liable nor guarantee any profits or losses.

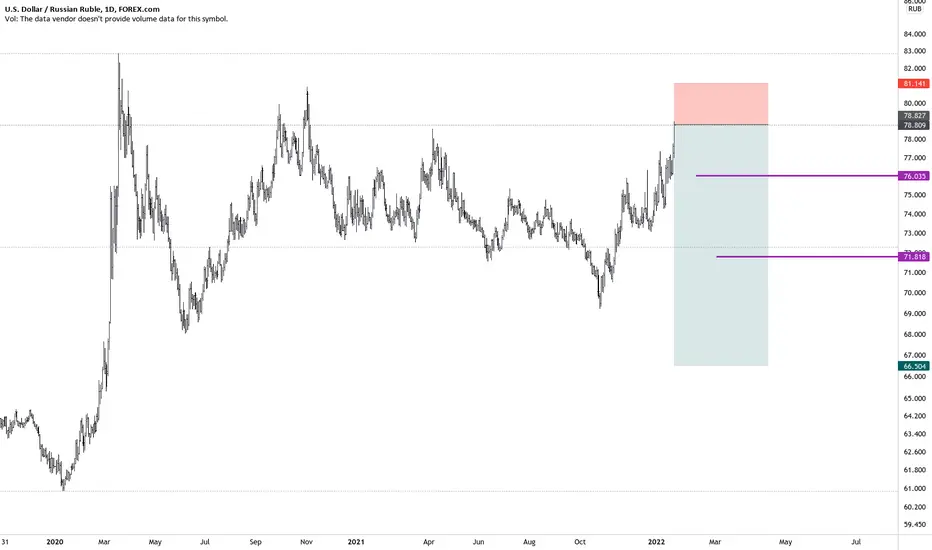
Possible warfare scenario for USDRUB?If conflict escalation continues with invasion and new annexation then Russian currency will be highly likely under pressure and using historical data we may estimate new trading range based on suggestion that strength of impact will be the same.

USDRUBThis is what I'm waiting for with the Ruble. I expect a quick sell off and then follow the pitchfork up as sanctions take hold. Unfortunately there's always a large spread on USDRUB so you have to be quite liberal with your stop loss. I could ride the roller coaster on this for a month and probably make a lot of money or just buy now and hold long term. What do you all think?

Here we goUSD/RUB now testing the yearly high. Heavy shelling at the line of contact, cyber attacks and more sanction details.
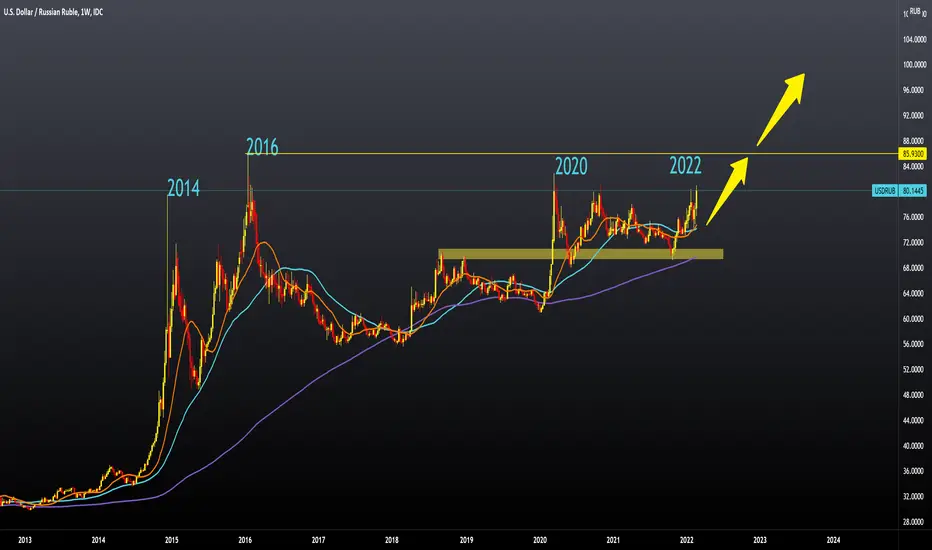
USDRUB long viewThe dollar's value against the Russian ruble has more than doubled in the last ten years. In 2012 the USDRUB exchange rate ranged from 29.0000-34.0000, while in 2022, the current USDRUB exchange rate was 79.4000. This shows us that the value of the Russian ruble has fallen by two and a half times in the last ten years, and current global developments could continue the further collapse of the Russian ruble. The first major fall in the ruble occurred in 2014 when the conflict between Russia and Ukraine began, and then the USDRUB jumped to 79.5000 level where we are now. Two years later, in 2016, the ruble fell to its historical level of 85.9300, after which the USDRUB exchange rate retreated, and again in 2020 at the beginning of the pandemic climbed above 80,000, forming the current high to 83,000.
It is very likely that we will soon see the USDRUB pair test its historical high again at 85.9300, and if this crisis continues and deepens, even more, we may see this pair at new historical levels on the chart. The pair has technical support in moving averages to continue the bullish trend. Our intermediate target is the previous high from 2020.
USDRUBI think USDRUB may break out from the larger pitchfork. If sanctions go through the effects will play out over several months so if it breaks out there will be another opportunity for an entrance.

Usdrub on monthly chartUsdrub after hitting top bolinger on monthly chart -red square, usdrub declines again to test green support scd band on monthly chart, now getting rejected with rsi well above 50mark and aiming to test top bolinger on monthly again around 87-88 levels.
Let’s see developments from here.

Usdrub on daily Bitcoin on daily broke above top bolinger on daily- blue line , and now declining to test it from above.
It was resistance before- red square and stop bitcoin on the way up, let’s see if it will turns support and push price higher from here.
Red line is first support 3ema on daily.
Buy on this test of 3ema and I will look for reaction from buyers if price declines more to the blue line- top bolinger on daily.

USDRUB The collapse is comingBreakkout of the ascending triangle fore the USDRUB gives us a price target of 125 rub for 1 USD.
Short RUB LONG USD!

USDRUB | RISE FROM SUPPORTUSDRUB is trading in a bullish trendline making good higher highs and higher lows, the current price has hit the top which can be the double top on shorter timeframe. We are expecting a dip atleast to 77 area and then bulls will again active to push the price byond the 80 levels.
Alternatively, the fall till support trendline will be a game on for bears and they can push the price to even lower.
Trade your levels accordingly.

Usdrub 1hrUsdrub declines to test green support scd band on 1hr again.
On smaller time frames cluster of candles left behind by gaping separation
Let’s see it it push price higher to test top Bolinger on 1hr again
Buy78.75 tp1 79.32 tp2 79.74

Correction takes some timeDollar overbought by now, potentially could test 78-79 area.
Sanctions details are foggy by now, movement will follow details. Not everybody in ruble zone is covered obviously.

USDRUB_shortI'm selling this pair with good risk/reward.
It's not a reommendation.
Pls keeep R&MM if trading.
USDRUB-SELL strategyAmidst the ongoing issues, we may create an opportunity for ourselves.
The market has for good reasons weakened the RUB, but also corrected a bit that move.
The chart shows we may have a SELL opportunity, and if missed no issue, but at least place a SELL order in case.
Strategy suggested SELL at $ 80.10 - 80.75 area and tale profit at $ 77.78 for now. The stop-loss I suggest at $ 83.27 for now.
We may add at $ 82 above when seen.

