Short Vision on USD RUB for 26/01/2021Hello Dear Traders,
You find below my analysis for USD/RUB , the currency pair is in the sell zone. I expect the price to fall. According to my set of rules, in the M30 frame USD/RUB will fall to 78.4 as I am showing in my chart. Our Daily Goal is 78.25.
Currently, USD/RUB is moving towards the resistance level of 80, where there is some liquidity from this value we are looking for short-term selling opportunities of USD/RUB.
Good Luck and enjoy your Bearish Market for today.
Entry:@79.95
TP1: @79.65
TP2: @79.45
TP3: @79.25
SL: @80.25
As mentioned on previous posting, we oscillate daily with the market based on Human Behavior and Sentiment.
Feel free to share your thoughts and opinions in the comment section below, I will be glad to discuss my friends!
USDRUB_TOM trade ideas


Usdrub on 4hrUsdrub broke above top bolinger on 4hr
Top bolinger was resistance before and hold the price, after price broke above and decline to retest it from above- it becomes support.
Retest on 4hr - at the retest point on 4hr at the same time on smaller time frame- big buyer stepped in and creates cluster of two candles separated by gapping and left behind.
It is good buy set up with stop below . Just another example.

Is this why Russia goes to War?The ruble has been under constant strain from US exporting inflation, even more so during COVID. The ruble is already near record low valuations against the $. Russia has been forced to stem inflation by raising rates:
"Reuters: MOSCOW, Dec 17 (Reuters) - Russia's central bank raised its key interest rate by 100 basis points to 8.5% on Friday and said more than one rate increase was still possible in coming months as inflation was near a six-year high.
Russia has raised the rate seven times this year from a record low of 4.25%, increasing the cost of borrowing to fight stubbornly high price pressures and expectations for inflation - its main area of responsibility - that are close to a five-year peak."
Russia has a severe dollar problem and it seems she is ready to play her trump card. Russia has been feverishly buying gold since 2012, tripling their reserves : (source: tradingeconomics.com). Does Russia along with China and others announce a Gold backed Ruble/Yuan? They cannot risk invasion without severe inflation/hyperinflation. They need to get off the dollar system, the US is already threatening SWIFT.
Is this why Russia and China are ready to go to war? To defend their new currency?

USD RUB - Ascending Triangle USD RUB preparing for ascending triangle breakout - putting targets to 121-131

USD/RUB shortUsd Rub short is good for now
We are in triangle for short
If you like these analysis pls follow me

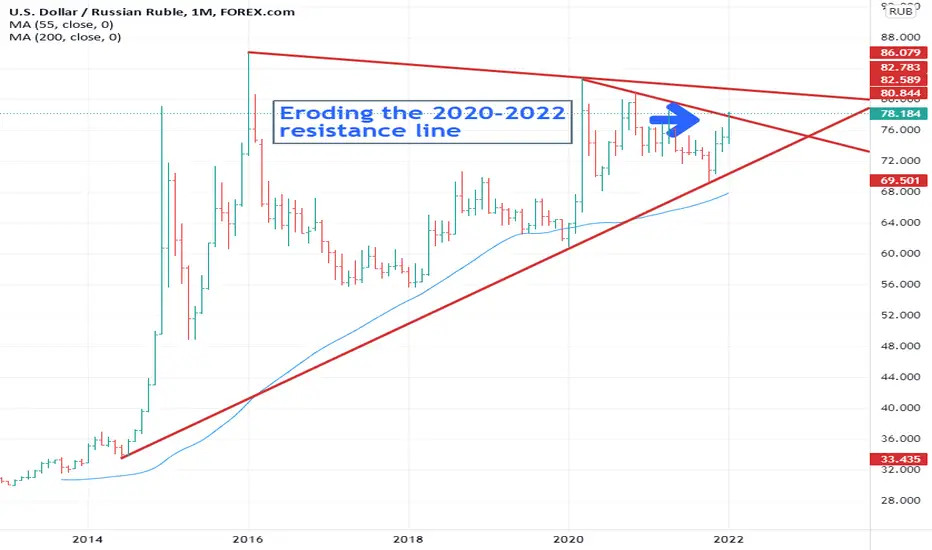
The Russia Risk It is hardly surprising to see USD/RUB creeping through its 2020-2022 resistance line given the increasing tensions between Russia and the Ukraine. That gives us the fundamental reason, but how can the chart to help with our trading strategy when something is hard quantify from a fundamental perspective?
Will Russia invade the Ukraine? Who knows, I was chatting about this with my friend yesterday who is convinced they will not, due to the risk of sanctions, but I have to say I am not so convinced and there is a real risk here and I am not convinced that the markets are fully pricing in that risk premium….and here’s where some basic chart knowledge really comes into its own. Charts help to take out some of the emotion out of decision making and it has some basic rules. For example, the definition of an up move is for higher reaction highs and higher reaction lows. For USD/RUB the last reaction low and the 55-day moving average coincide well in the 74.36/25 region, so placing a stop below there is logical. Too far away? Look at an hourly chart and follow the same principle.
Need a target zone, or somewhere you need to aim for? The 2016-2022 resistance line at 81.40 is a good place to start. What do you do when it starts to reach your target zone? There is a decision to be made... do you lock in profits and exit or hold on? You need to take a closer look at the chart at this point– is the RSI overbought? Is the market running out of steam, struggling to get through this level? At the very least you should be looking to tighten your stops.
By the way resistance lines that only connect 2 points are not as good as down trends (these connect 3 points) and with USD/RUB bouncing off its 2014-2022 uptrend at the end of last year all the risks are on the topside. Above 81.40, we have the 82.86 March 2020 high and the 85.98 January 2016 high.
Disclaimer:
The information posted on Trading View is for informative purposes and is not intended to constitute advice in any form, including but not limited to investment, accounting, tax, legal or regulatory advice. The information therefore has no regard to the specific investment objectives, financial situation or particular needs of any specific recipient. Opinions expressed are our current opinions as of the date appearing on Trading View only. All illustrations, forecasts or hypothetical data are for illustrative purposes only. The Society of Technical Analysts Ltd does not make representation that the information provided is appropriate for use in all jurisdictions or by all Investors or other potential Investors. Parties are therefore responsible for compliance with applicable local laws and regulations. The Society of Technical Analysts will not be held liable for any loss or damage resulting directly or indirectly from the use of any information on this site.
Short Vision on USD RUB for 24/01/2021Hello Dear Traders,
You find below my analysis for USD/RUB , the currency pair is in the sell zone. I expect the price to fall. According to my set of rules, in the M30 frame USD/RUB will fall to 77.4 as I am showing in my chart. Our Daily Goal is 77.25.
Currently, USD/RUB is moving towards the resistance level of 78.1,where there is some liquidity from this value we are looking for short-term selling opportunities of USD/RUB.
Good Luck and enjoy your Bearish Market for today.
Entry:@78.1
TP1: @77.85
TP2: @77.55
TP3: @77.25
SL: @78.45
As mentioned on previous posting, we oscillate daily with the market based on Human Behavior and Sentiment.
Feel free to share your thoughts and opinions in the comment section below, I will be glad to discuss my friends!


Short Vision on USD RUB 14/01/2022Hello Dear Traders,
You find below my analysis for USD/RUB, the currency pair is in the sell zone. I expect the price to fall. According to my set of rules, in the M30 frame USD/RUB will fall to 76.4 as I am showing in my chart. Our Daily Goal is 76.25.
Currently, USD/RUB is moving towards the resistance level of 77,where there is some liquidity from this value we are looking for short-term selling opportunities of USD/RUB.
Good Luck and enjoy your Bearish Market for today.
Entry:@77
TP1: @76.85
TP2: @76.55
TP3: @76.25
SL: @77.25
As mentioned on previous posting, we oscillate daily with the market based on Human Behavior and Sentiment.
Feel free to share your thoughts and opinions in the comment section below, I will be glad to discuss my friends!

Same patterns, same fractal behaviour. History doesn't repeat itself but it often rhymes. Ruble will likely experience another leg down. The main catalyst for such move is prolonged conflict with Ukraine, judging by recent news coverage.

Critical Area If it comes under 76.11 this may work.
This is 15 minutes chart and on Friday I will look for this pattern.

LONG USDRUBUSDRUB looks like in the wave 2 of C of iii which targets 90-95 zone sometimes in mid-2022
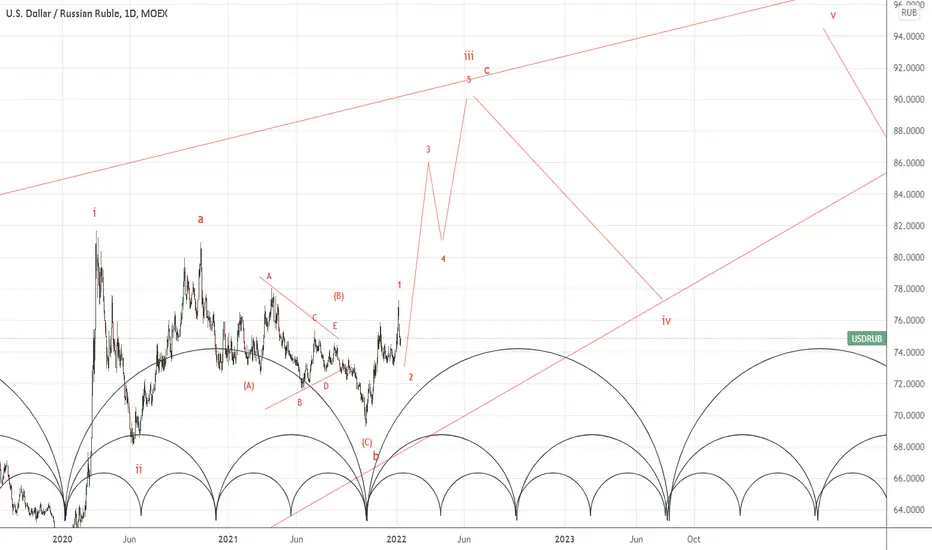
USD/RUB....Will there be an overshoot or is it a correction in the form of a triangle -> will there be a 5th wave?

$USDRUB fractal wavefractal formation of the two bearish flags consisting of 4 smaller waves just have formed up so we might see the third one, if also divide the two flags into 4 waves too its a bigger wave start on a bigger timeframe

USDRUB top-down analysisHello traders, this is the full breakdown of this pair. We will take this trade if all the conditions are satisfied as discussed in the analysis. Smash the like button if you find value in this analysis and drop a comment if you have any questions or let me know which pair to cover in my next analysis.

USDRUB, BUY?It seems USDRUB is going to up as many indicators prove it. Maybe The next three months would be not good for RF. Good luck in trades, buddy.

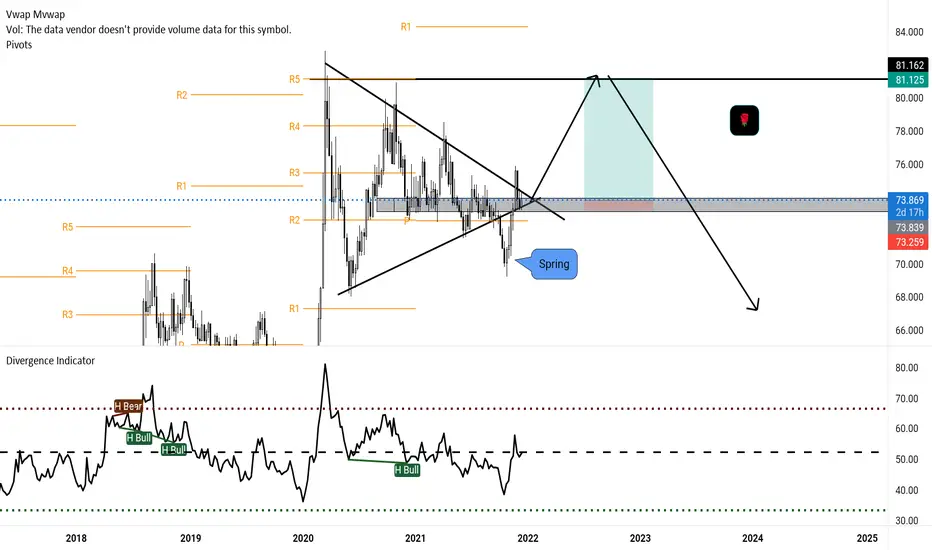
Set to reverse?Market spring n broke above months of structure retested it sold dwn n brought up with these 2 small candle which is the strongest signal as this could show the stopping if price dropping back below when a market stops a direction temporarily it'll move the same pips in the opposite direction especially under key area of resistance n support so that was the go well targe the pivotal high n no higher these moves usually start a start reversal once done so well b looking out for a strong drop afterwards
Something major is coming. Cup and handle pattern Something major is coming. Cup and handle pattern. Somebody knows something. War?? Sanctions???

USDRUB SHORTS 📉📉📉I know this is not the most common currency trading pair to trade but i see there a lot of technical reasons to entry, we are in a bearish market structure on a D1/H4 TF, could expect shorts if price is rejecting bearish orderblock + psychological level 74.000 with targets below trendline liquidity around 60.
Be aware if you take SHORTS there the SWAP IS GREEN
What do you think ? Comment below

Make a choicelying on strong support zone + daily 200 EMA + 0.5 Fib lvl + daily trend line + RSI Support zone
wait for more confirmation
if the daily trend line broke down ( also inline with 200EMA and support zone ) open your short and follow the red arrow
if the 4H trend line broke up open your long and follow the green arrow
play safe

USDRUB TOMdecision point for USDRUB with 2 possible scenarios:
1 Fake breakout from descending channel
2 Zizag completion
